SaaS valuation multiples 2026: the 15 largest software stocks
NTM price-to-sales, EV/revenue, growth, ARR and Rule of 40 for the 15 largest listed software companies, January 2020 to October 2026
by Compound Team · November 4, 2026 · 13 min read
The full 16-slide deck behind this post, with every exhibit, the company appendix and the method, every figure sourced to FactSet, company earnings calls or filings.
Download · FreeOn October 30, 2026, the 15 largest software companies traded at a median 9.2x their next twelve months (NTM) of revenue. On trailing revenue, the basis SaaS indices use, the median was 11.4x EV/revenue, nearly three times their roughly 4x. Names expected to grow 25% or more traded at 24.3x NTM; the rest at 5.8x.
We had Compound pull monthly prices, consensus estimates and reported revenue for those 15 companies from FactSet, every month back to January 2020. The large caps grow faster than the broad index, and growth is what the market pays for. The median sits 38% below its October 2021 peak of 14.9x, and the gap between the top and bottom quartile is the widest it has been in six years.
Five findings
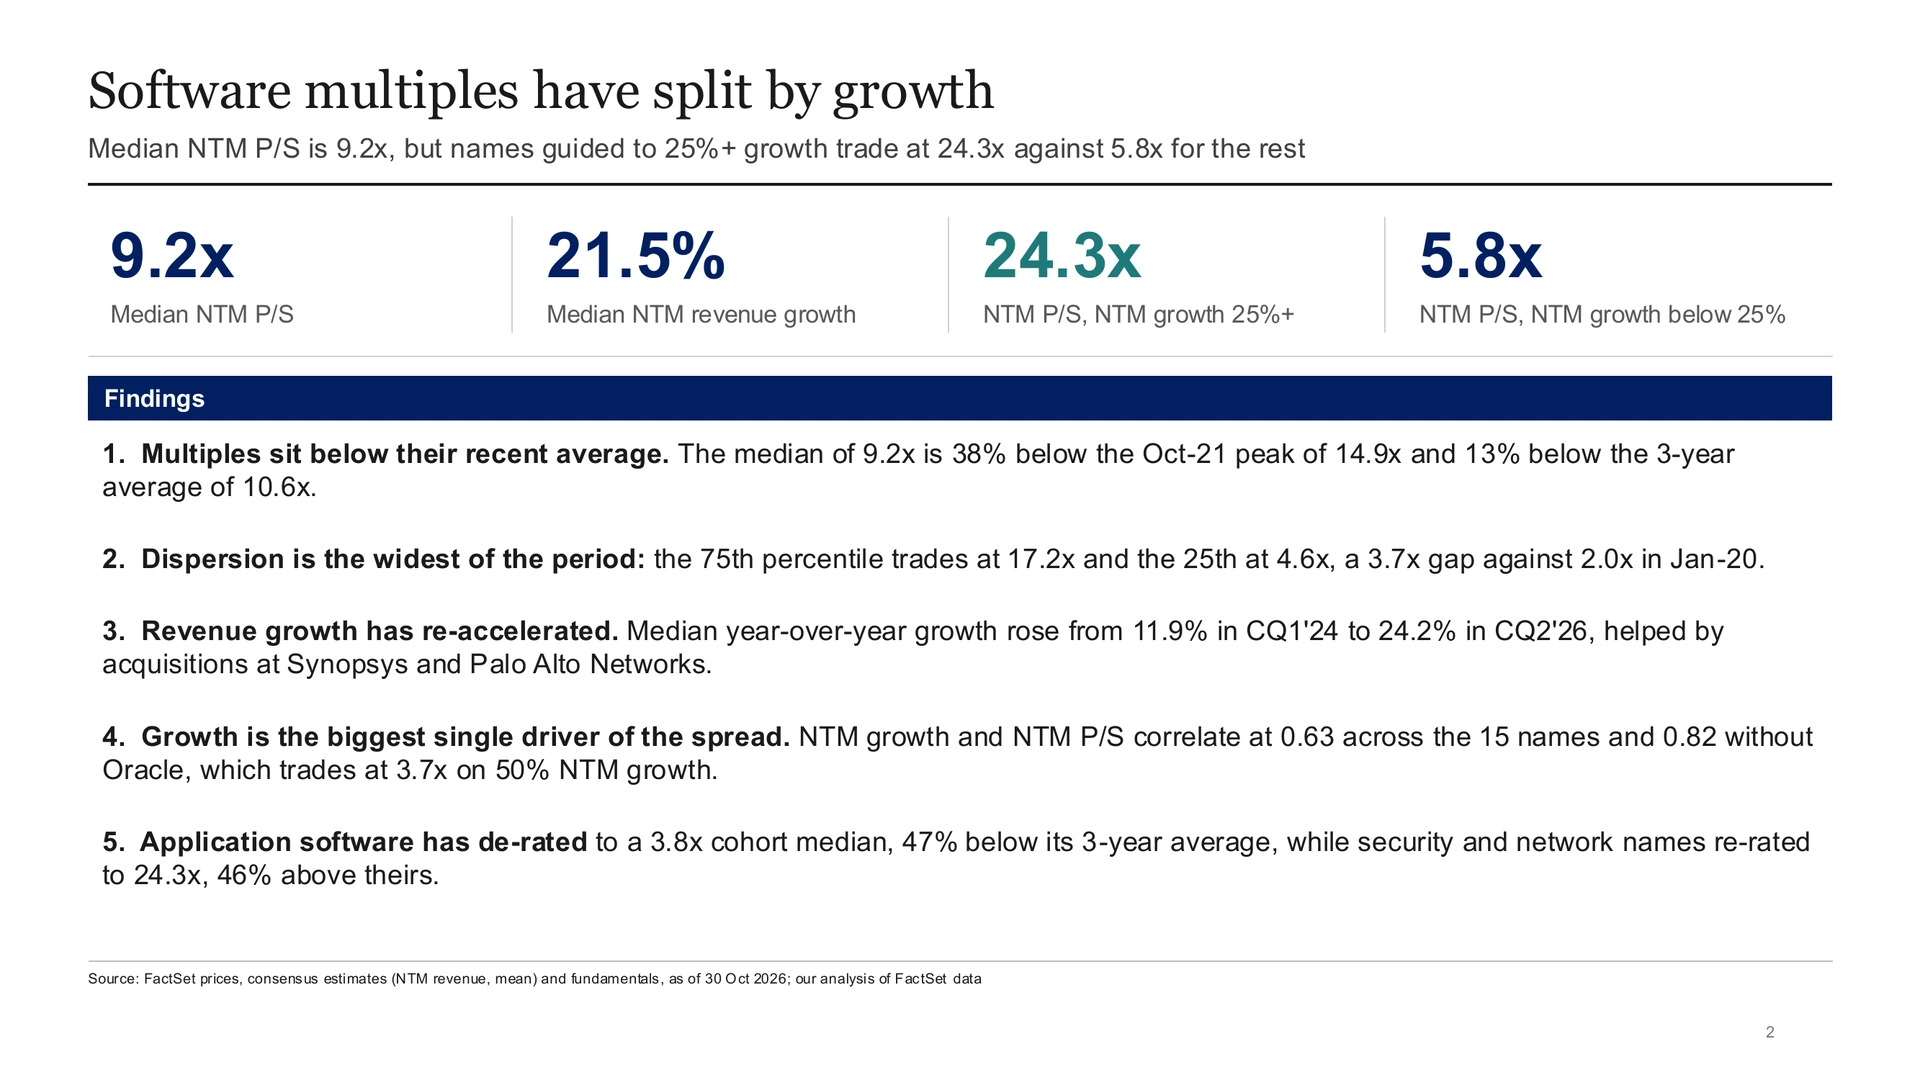
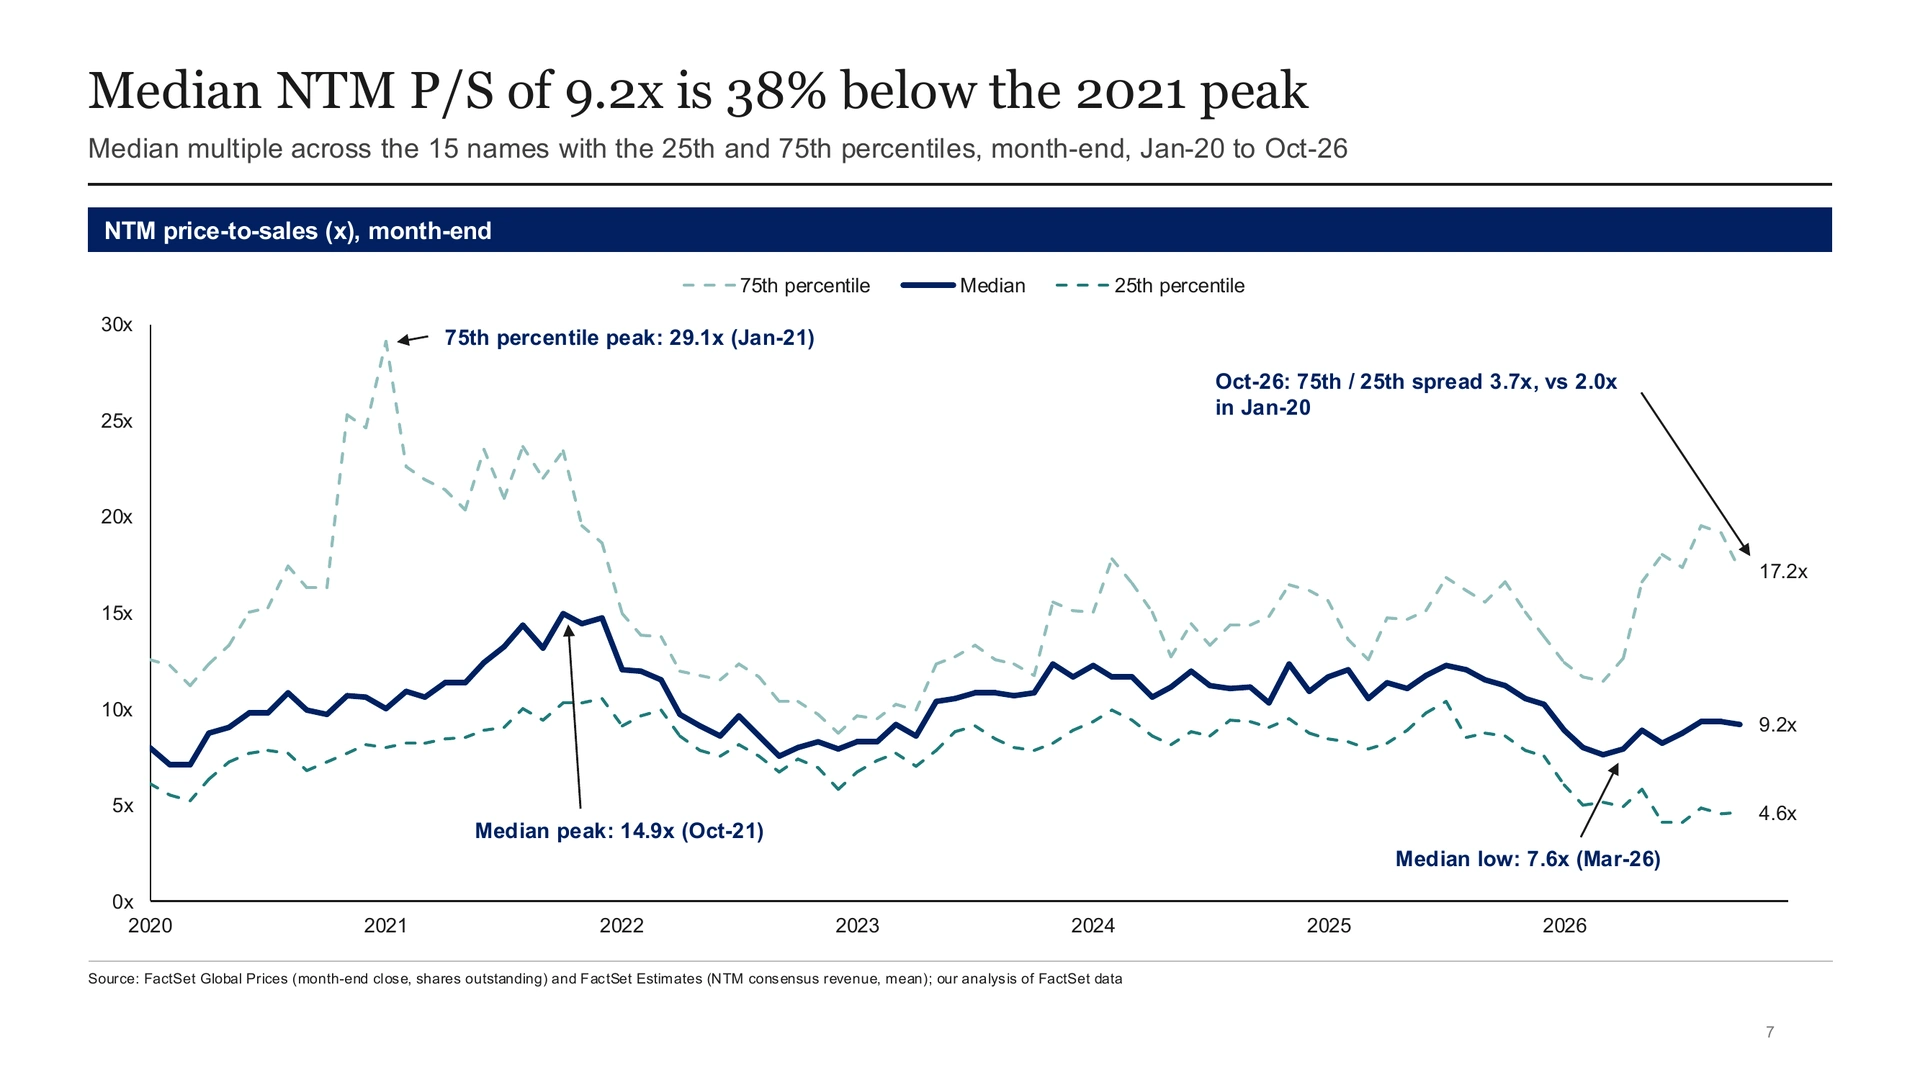
- Multiples sit below their recent average. The median of 9.2x is 38% below the October 2021 peak and 13% below the 3-year average of 10.6x.
- Dispersion is the widest of the period. The 75th percentile trades at 17.2x and the 25th at 4.6x, a 3.7x gap against 2.0x in January 2020.
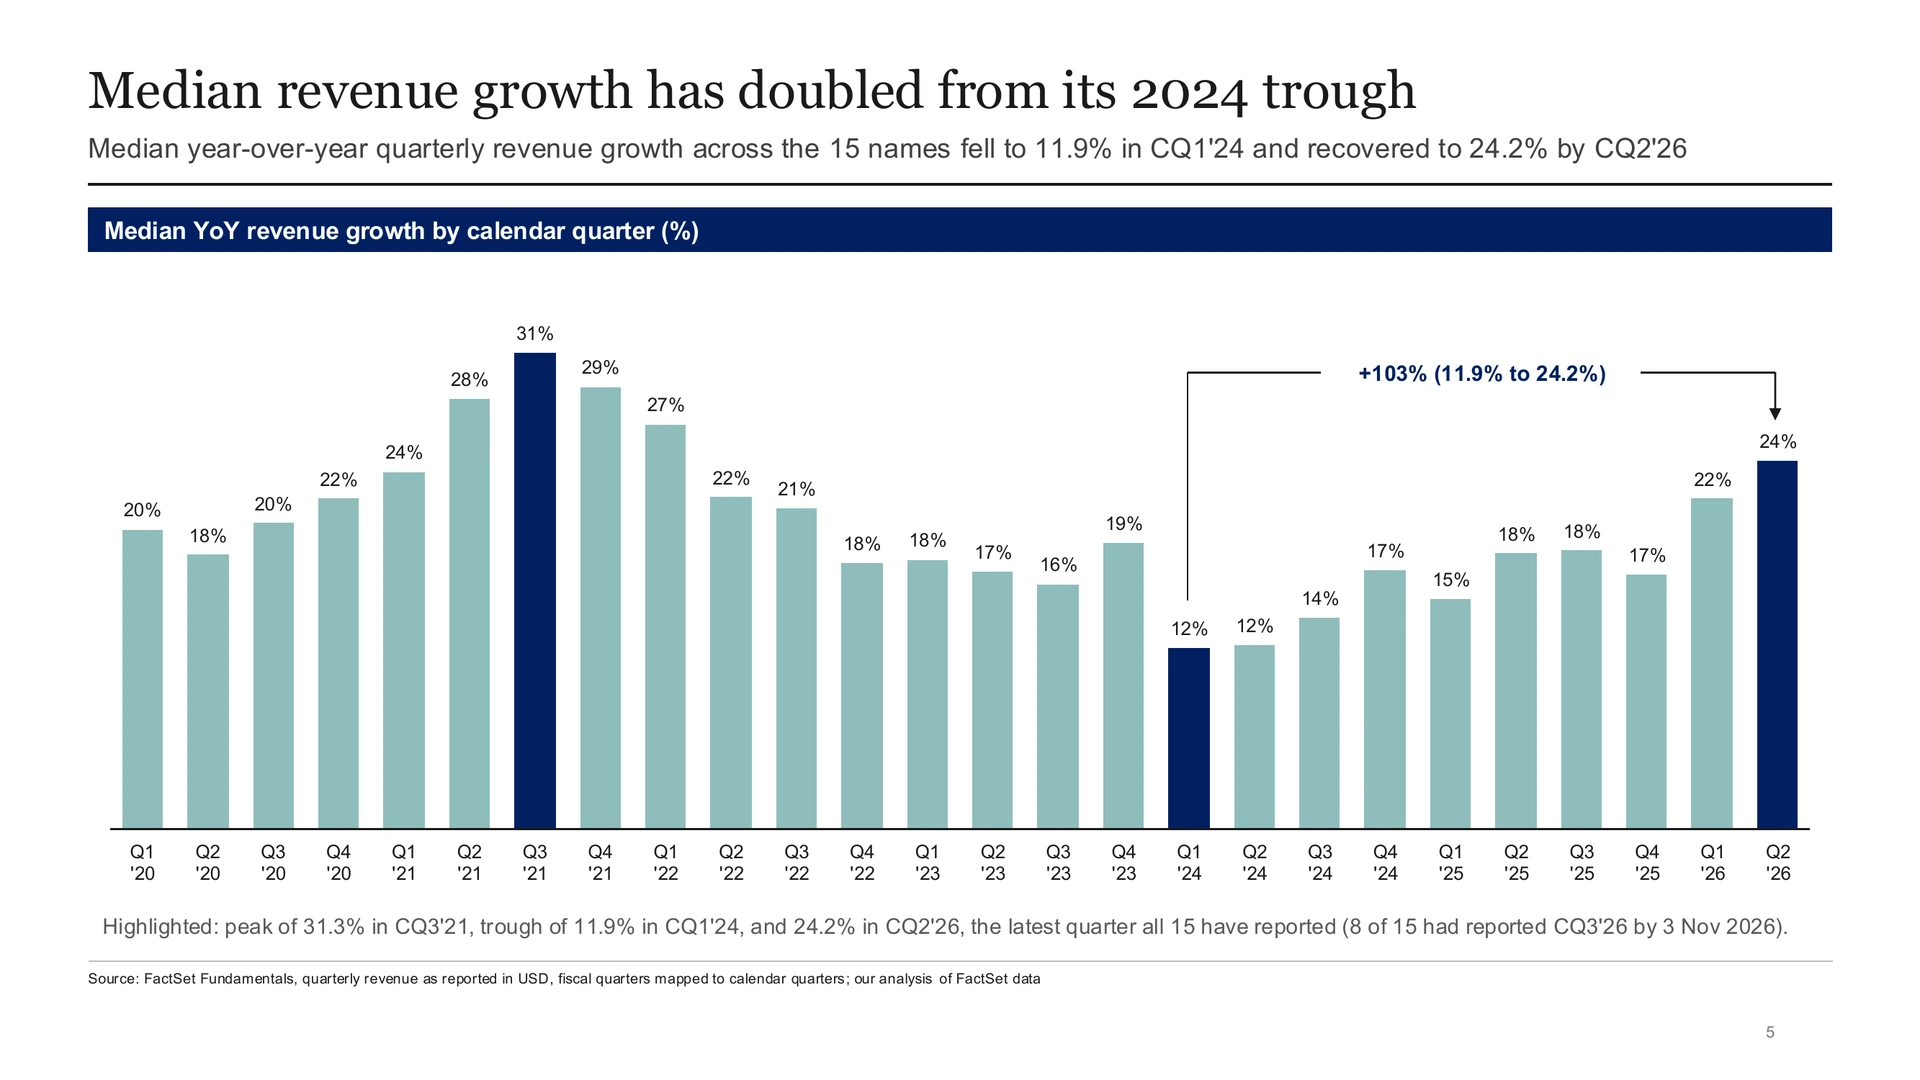
- Revenue growth has re-accelerated. Median year-over-year growth rose from 11.9% in the first quarter of 2024 to 24.2% in the second quarter of 2026, helped by acquisitions at Synopsys and Palo Alto Networks.
- Growth is the biggest single driver of the spread. NTM growth and NTM P/S correlate at 0.63 across the 15 names, so growth accounts for about 40% of the variance in multiples; without Oracle the correlation is 0.82, about two-thirds.
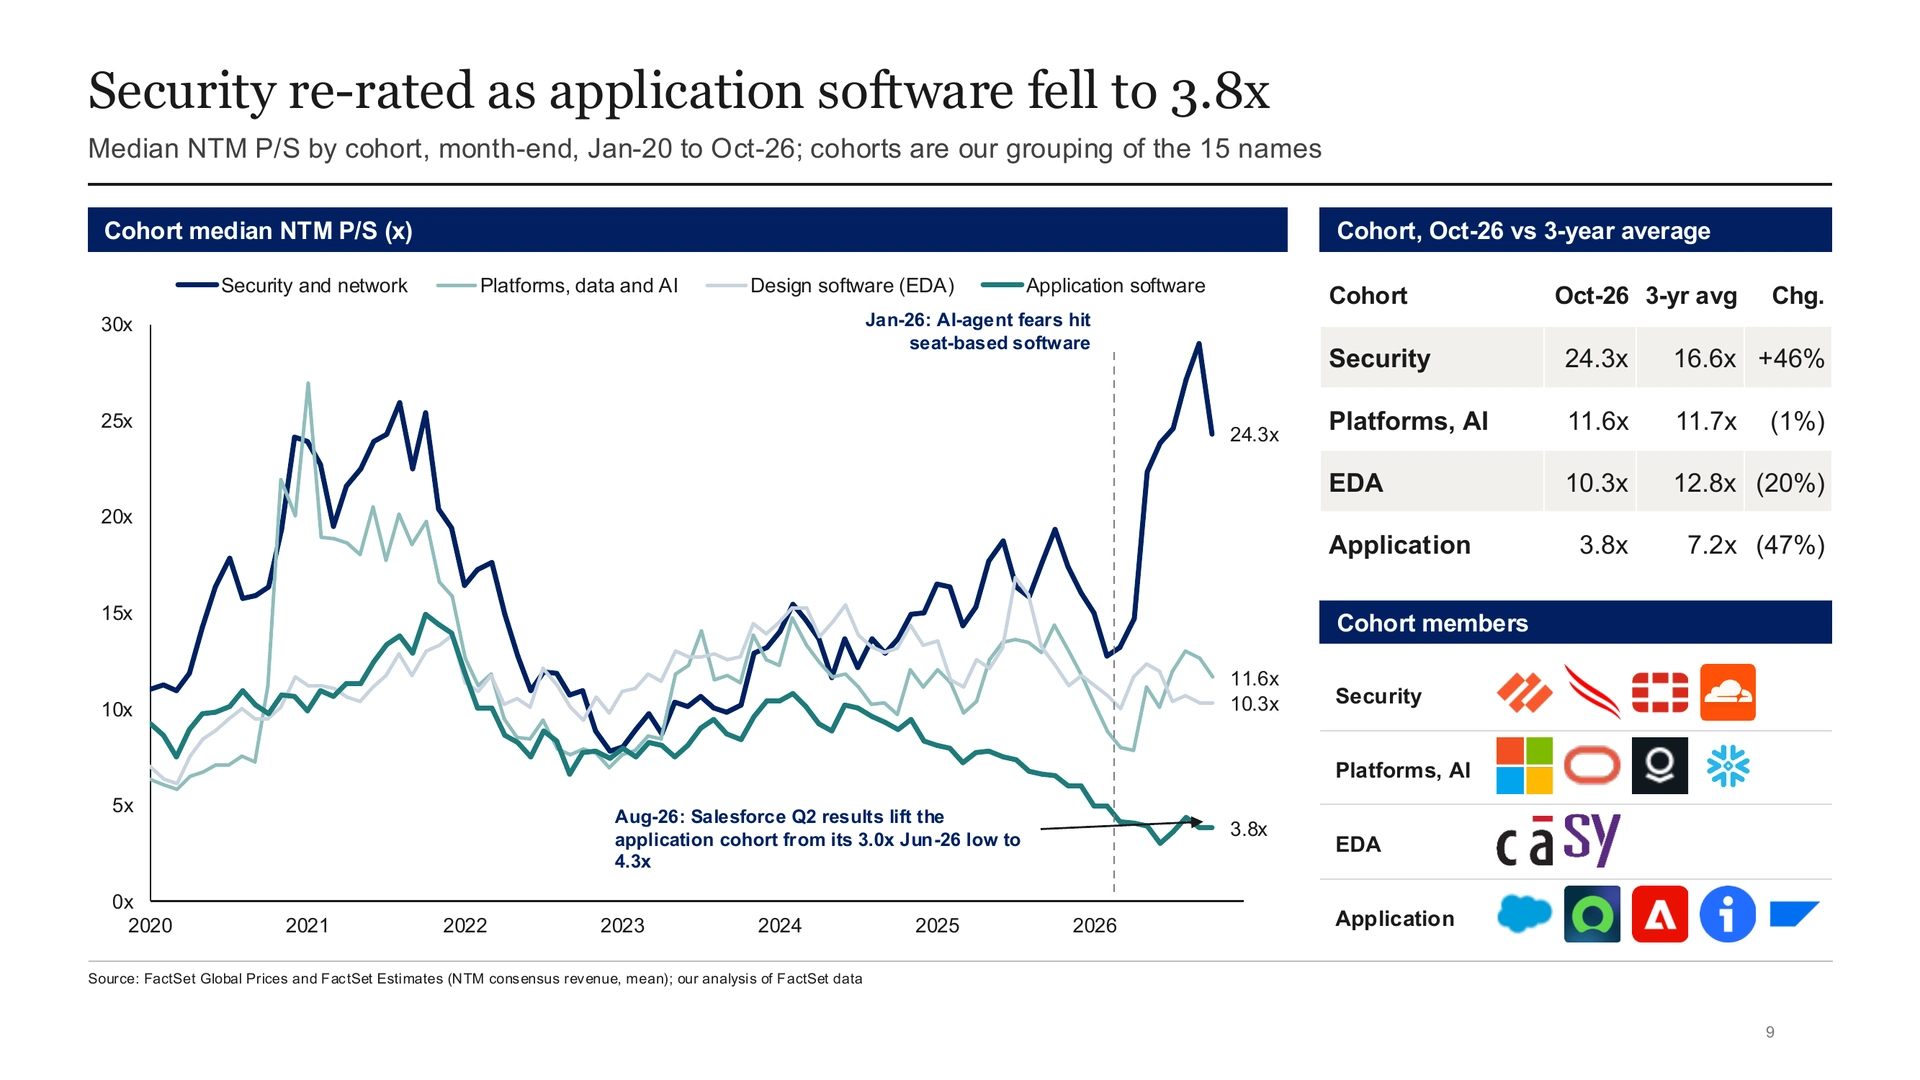
- Security re-rated; application software de-rated. Security names trade at a 24.3x cohort median, 46% above their 3-year average. Application software trades at 3.8x, 47% below.
SaaS valuation multiples by growth and by company
By expected revenue growth
The multiple roughly quadruples from the slowest growers to the fastest. Equity value (P/S) and enterprise value (EV/sales) give almost the same medians, because most of these companies hold little net debt.
| NTM revenue growth | Companies | Median NTM P/S | Median EV/NTM sales |
|---|---|---|---|
| 40% or more | Palantir, Oracle, Snowflake, Cloudflare | 21.1x | 21.0x |
| 20% to 40% | Microsoft, Palo Alto Networks, CrowdStrike, ServiceNow | 14.8x | 14.8x |
| Below 20% | SAP, Salesforce, Fortinet, Adobe, Intuit, Cadence, Synopsys | 5.5x | 5.5x |
| All 15 | 9.2x | 9.3x |
By company
| Company | Market cap ($B) | NTM P/S | EV/NTM sales | NTM growth | Rule of 40 | vs 3-year average P/S |
|---|---|---|---|---|---|---|
| Microsoft | 3,876 | 9.2x | 9.3x | 21.9% | 31% | -10% |
| Palantir | 444 | 37.9x | 37.0x | 60.5% | 116% | -12% |
| Oracle | 395 | 3.7x | 4.9x | 50.3% | 2% | -45% |
| Palo Alto Networks | 299 | 20.4x | 20.3x | 27.9% | 64% | +54% |
| SAP | 272 | 5.5x | 5.5x | 8.5% | 24% | -8% |
| CrowdStrike | 256 | 36.4x | 35.8x | 30.4% | 59% | +71% |
| Salesforce | 189 | 3.8x | 4.4x | 13.2% | 44% | -33% |
| ServiceNow | 109 | 5.8x | 6.0x | 21.5% | 52% | -50% |
| Snowflake | 108 | 14.0x | 14.1x | 41.7% | 64% | +4% |
| Fortinet | 100 | 11.2x | 10.7x | 13.6% | 57% | +14% |
| Cloudflare | 100 | 28.1x | 28.0x | 41.3% | 54% | +26% |
| Adobe | 97 | 3.4x | 3.4x | 11.2% | 52% | -53% |
| Intuit | 91 | 3.8x | 3.9x | 11.6% | 46% | -52% |
| Cadence Design Systems | 90 | 12.5x | 12.7x | 17.1% | 46% | -17% |
| Synopsys | 90 | 8.1x | 8.8x | 17.4% | 47% | -23% |
| Median | 109 | 9.2x | 9.3x | 21.5% | 52% | -12% |
Source: FactSet. Market cap and NTM P/S at October 30, 2026; EV uses debt and cash from the latest reported quarter. Rule of 40 (NTM revenue growth plus LTM free cash flow margin), the medians and the growth bands are our computation. The 3-year average covers November 2023 to October 2026.
Valuation
The median multiple is 38% below the 2021 peak
The median NTM P/S peaked at 14.9x in October 2021 and bottomed at 7.6x in March 2026. It has recovered to 9.2x. The 75th percentile peaked at 29.1x in January 2021.
The quartiles have pulled apart. The 75th percentile is now 3.7x the 25th, against 2.0x in January 2020.
Security re-rated as application software fell to 3.8x
We grouped the 15 names into four cohorts. Security and network (Palo Alto Networks, CrowdStrike, Fortinet, Cloudflare) trades at a 24.3x median, 46% above its 3-year average. Application software (Salesforce, ServiceNow, Adobe, Intuit, SAP) trades at 3.8x, 47% below.
The application cohort fell hard in January 2026, as fears that AI agents would replace software seats hit the group. It bottomed at 3.0x in June. Salesforce’s second-quarter results in August lifted it to 4.3x, but it is still far below the 7.2x it averaged over the last three years.
Ten of the 15 trade below their own 3-year average
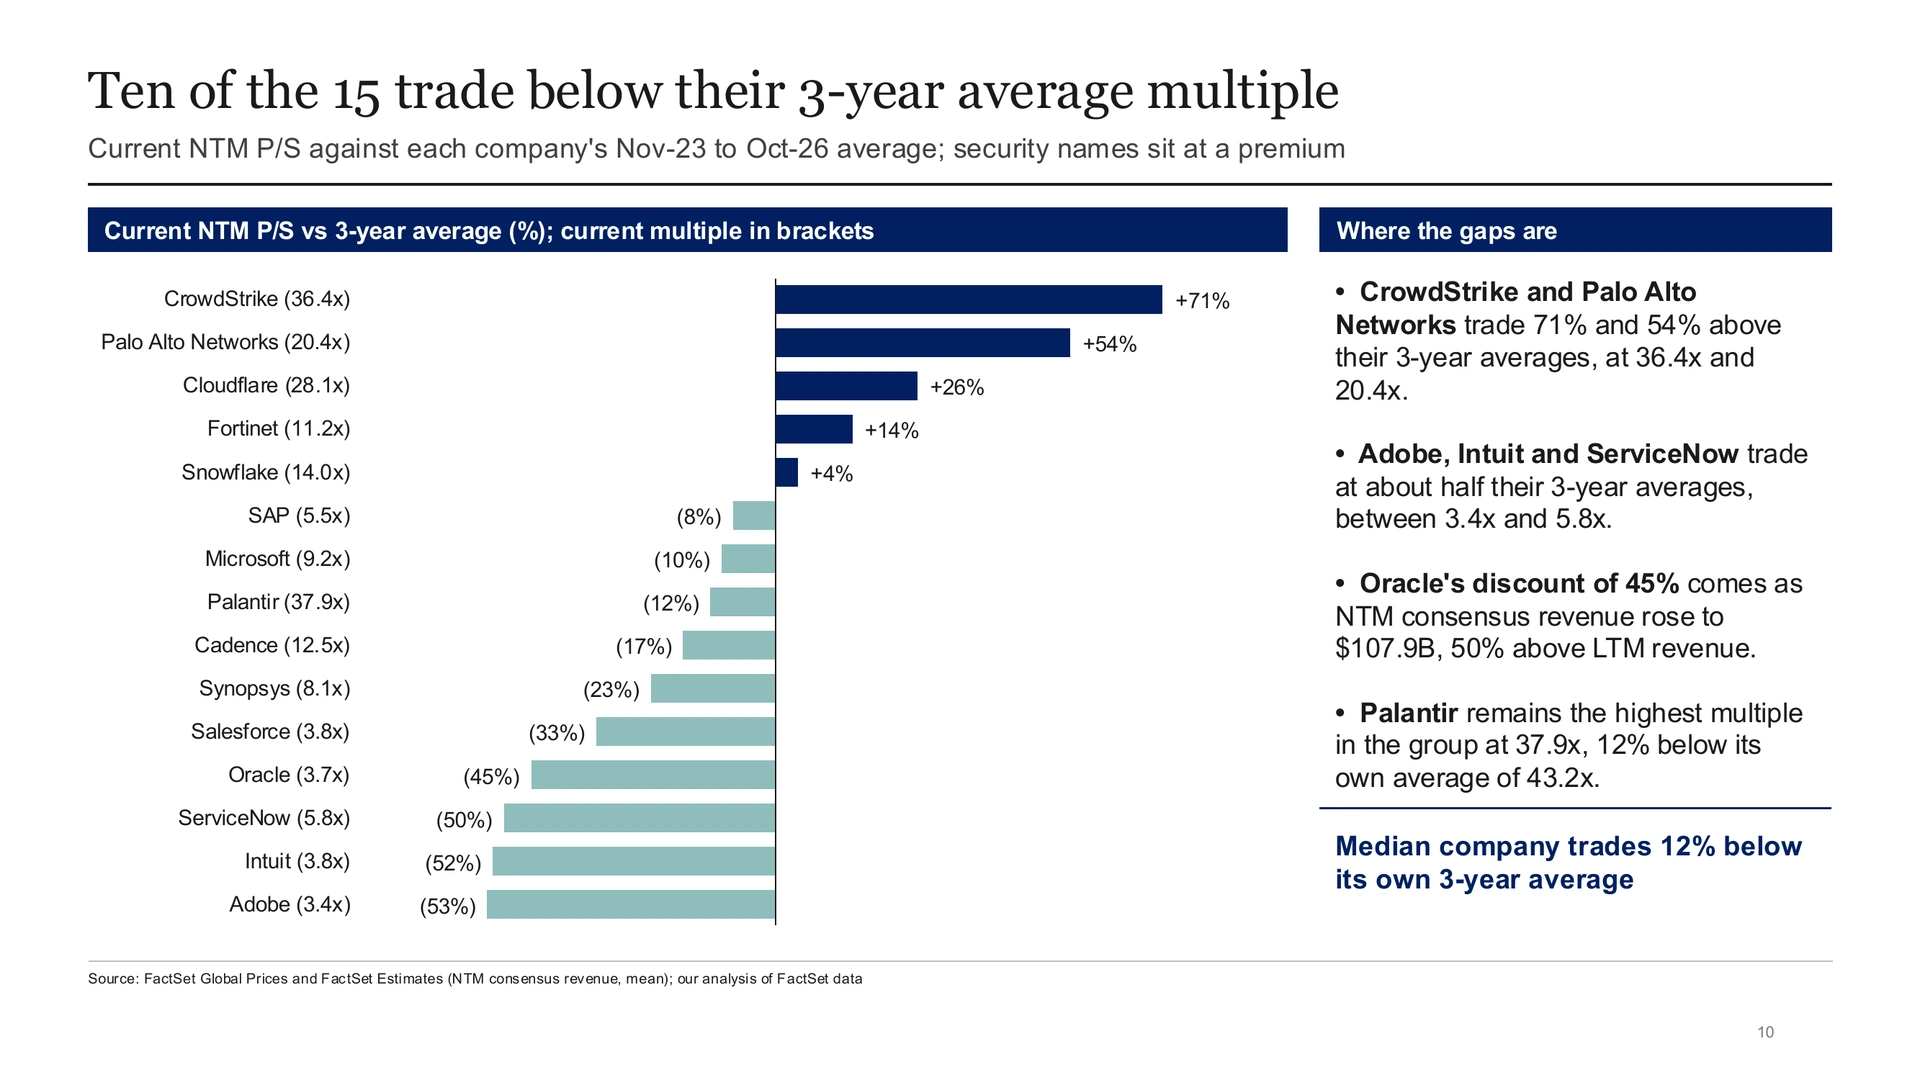
The median company trades 12% below its own 3-year average multiple. CrowdStrike and Palo Alto Networks trade 71% and 54% above theirs, at 36.4x and 20.4x. Adobe, Intuit and ServiceNow trade at about half of theirs, between 3.4x and 5.8x. Palantir is still the most expensive name in the group at 37.9x, 12% below its own average of 43.2x.
Growth
Median revenue growth has doubled from its 2024 trough
Median year-over-year quarterly revenue growth across the 15 names peaked at 31.3% in the third quarter of 2021. It fell to 11.9% in the first quarter of 2024 and recovered to 24.2% by the second quarter of 2026, the latest quarter all 15 have reported. Part of the recovery is acquired revenue at Synopsys and Palo Alto Networks.
Consensus expects the recovery to hold. Median NTM revenue growth, consensus against reported LTM revenue, is back to 21.5% from a low of 14.6% in February 2024.
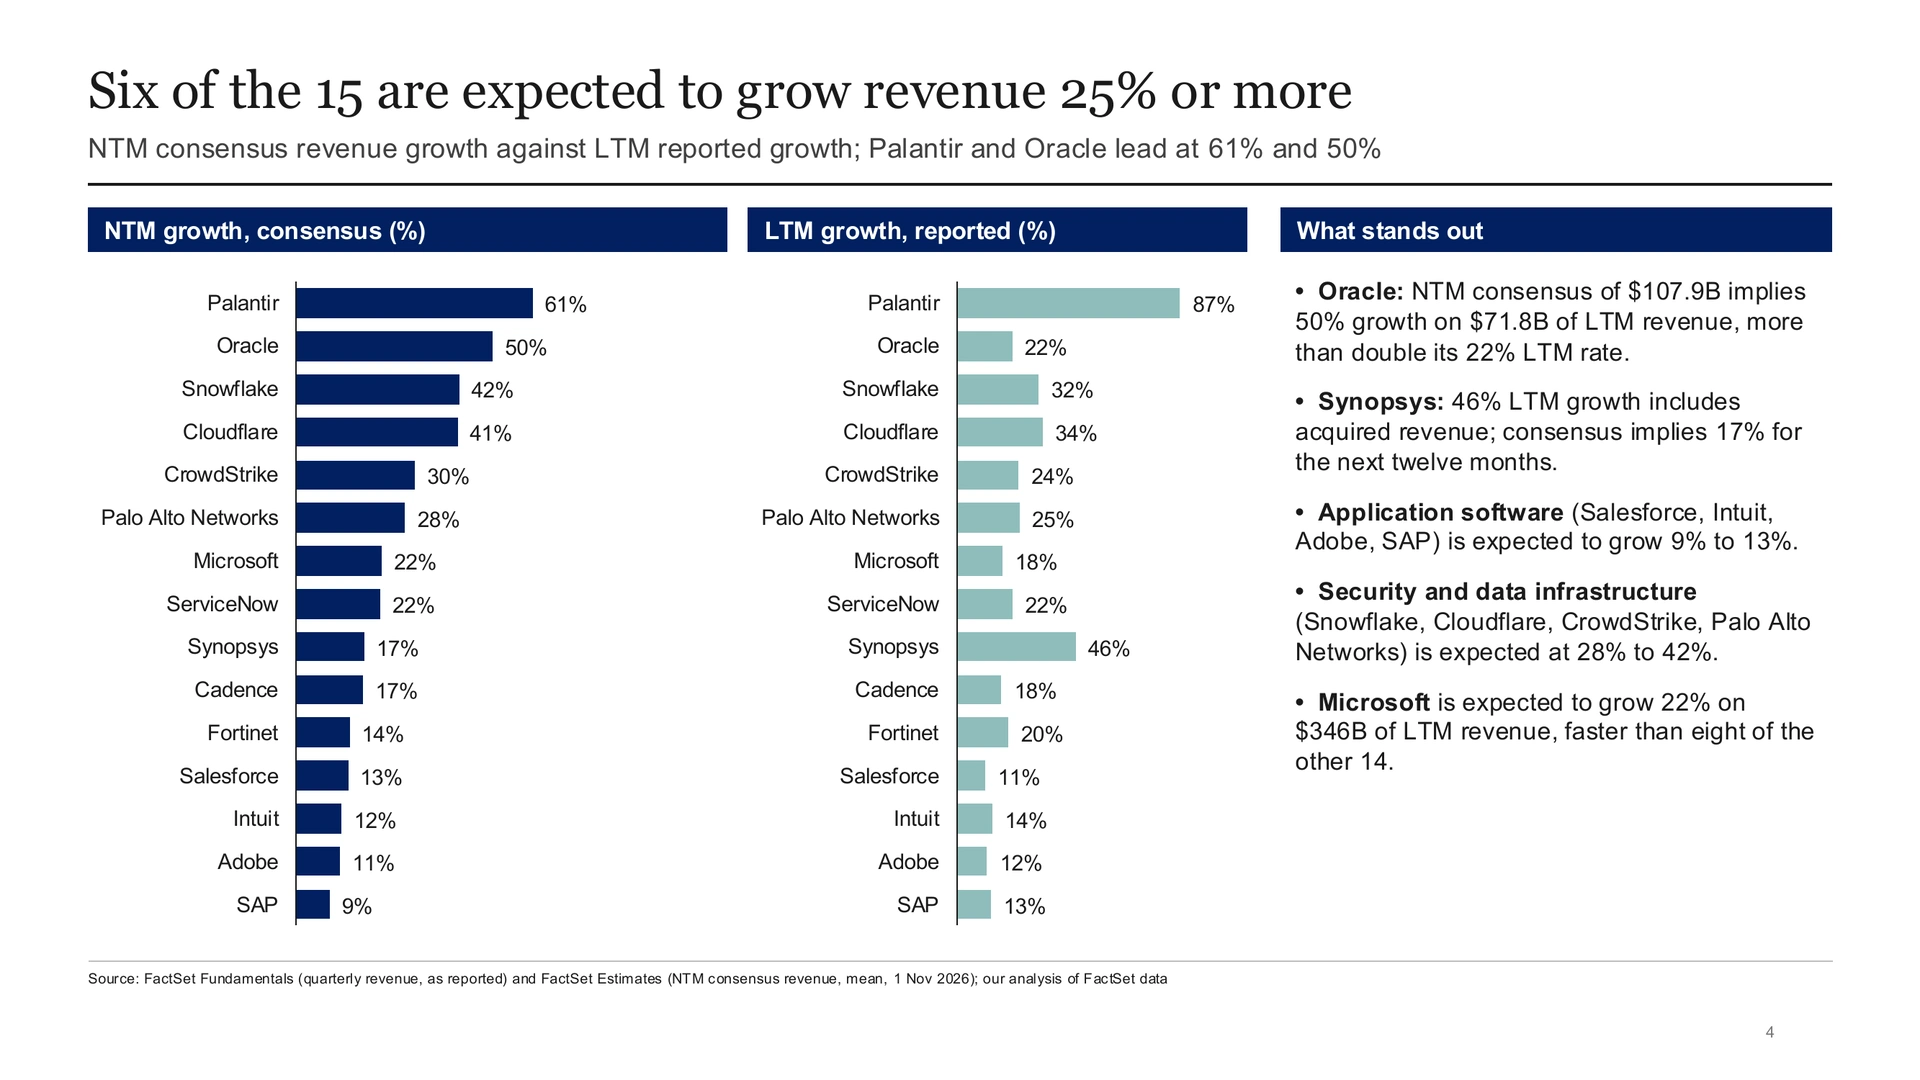
Six of the 15 are expected to grow 25% or more
Palantir and Oracle lead on consensus, at 61% and 50% growth over the next twelve months. Oracle’s consensus of $107.9B implies more than double its 22% LTM growth rate. Security and data infrastructure names (Snowflake, Cloudflare, CrowdStrike, Palo Alto Networks) are expected to grow 28% to 42%. Application software (Salesforce, Intuit, Adobe, SAP) is expected to grow 9% to 13%.
Microsoft is expected to grow 22% on $346B of LTM revenue, faster than eight of the other 14.
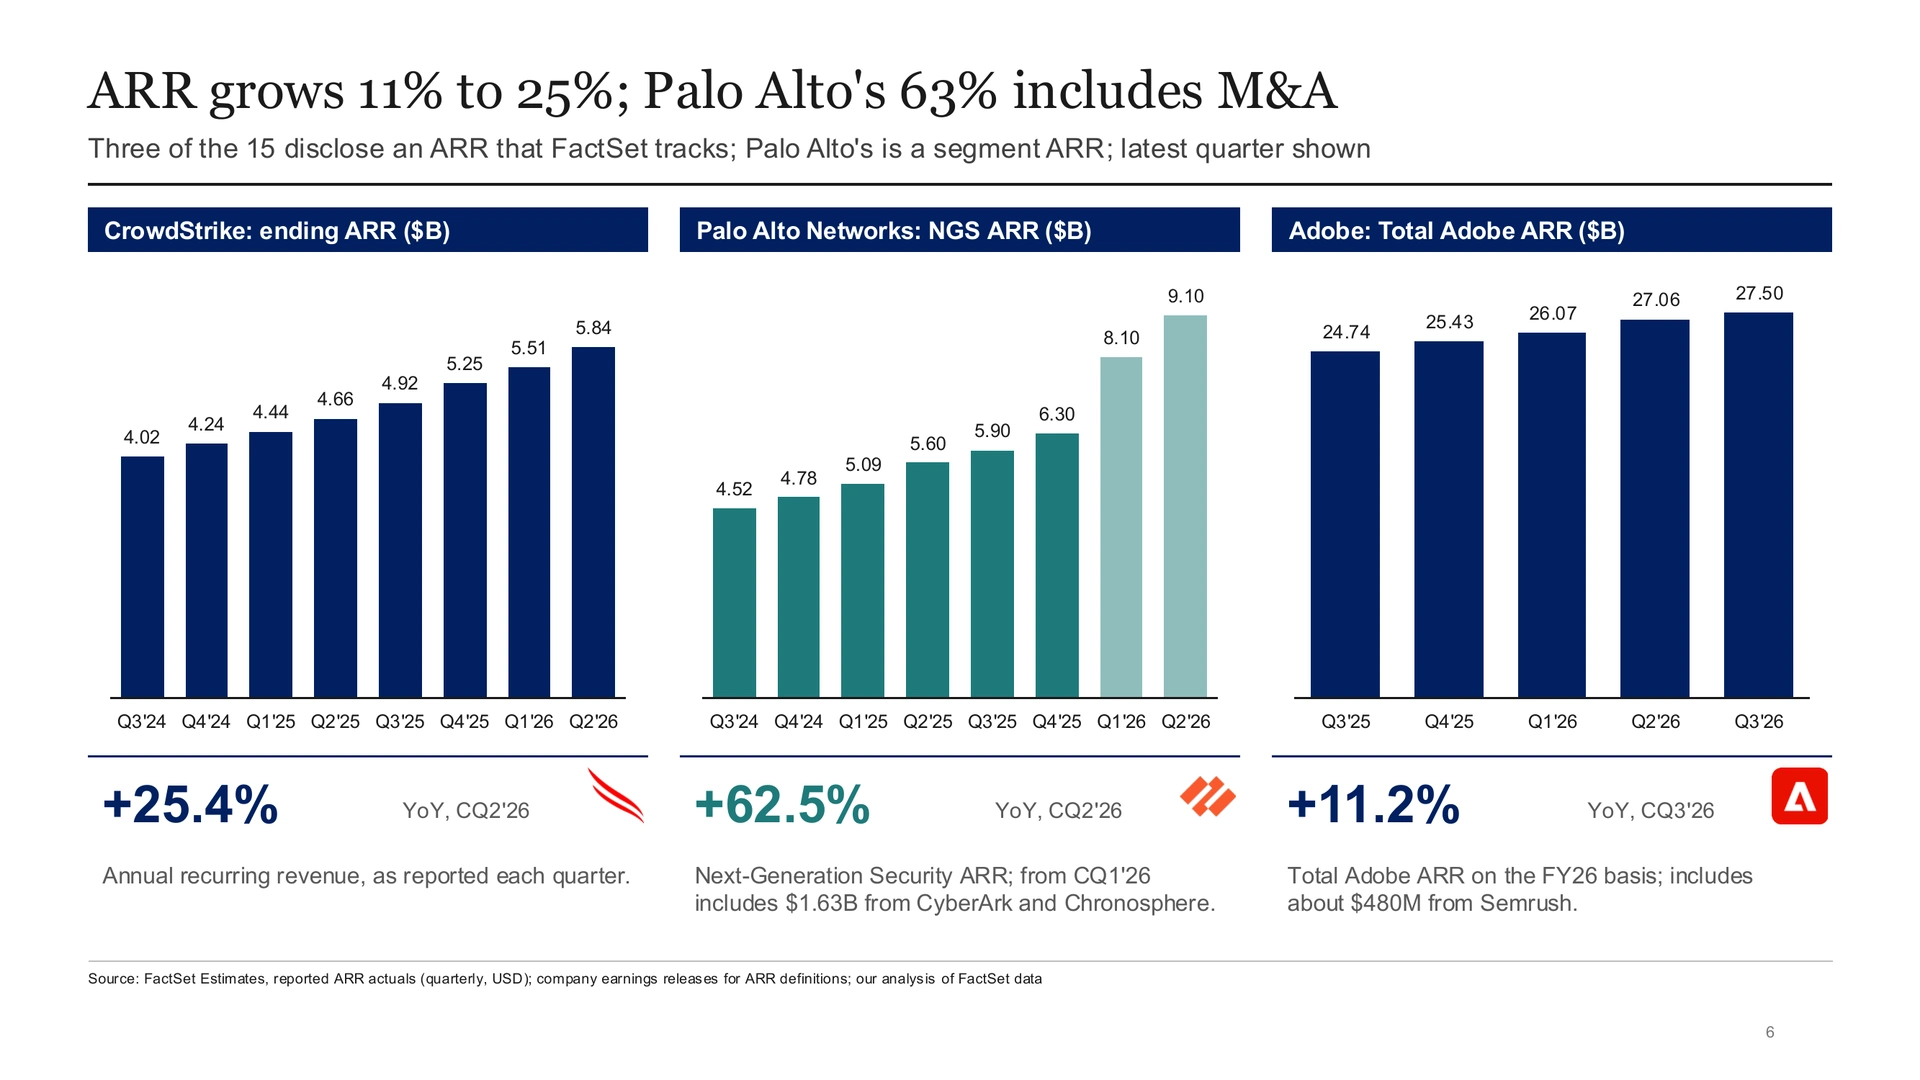
ARR grows 11% to 25%, or 63% at Palo Alto with acquisitions
Three of the 15 report an ARR figure that FactSet tracks: company-level ARR at CrowdStrike and Adobe, and Next-Generation Security ARR, a segment metric, at Palo Alto Networks. CrowdStrike’s ending ARR grew 25.4% year over year in the second quarter of 2026. Palo Alto Networks’ Next-Generation Security ARR grew 62.5%, but that includes $1.63B from the CyberArk and Chronosphere acquisitions. Adobe’s total ARR grew 11.2% in the third quarter.
Growth vs multiples
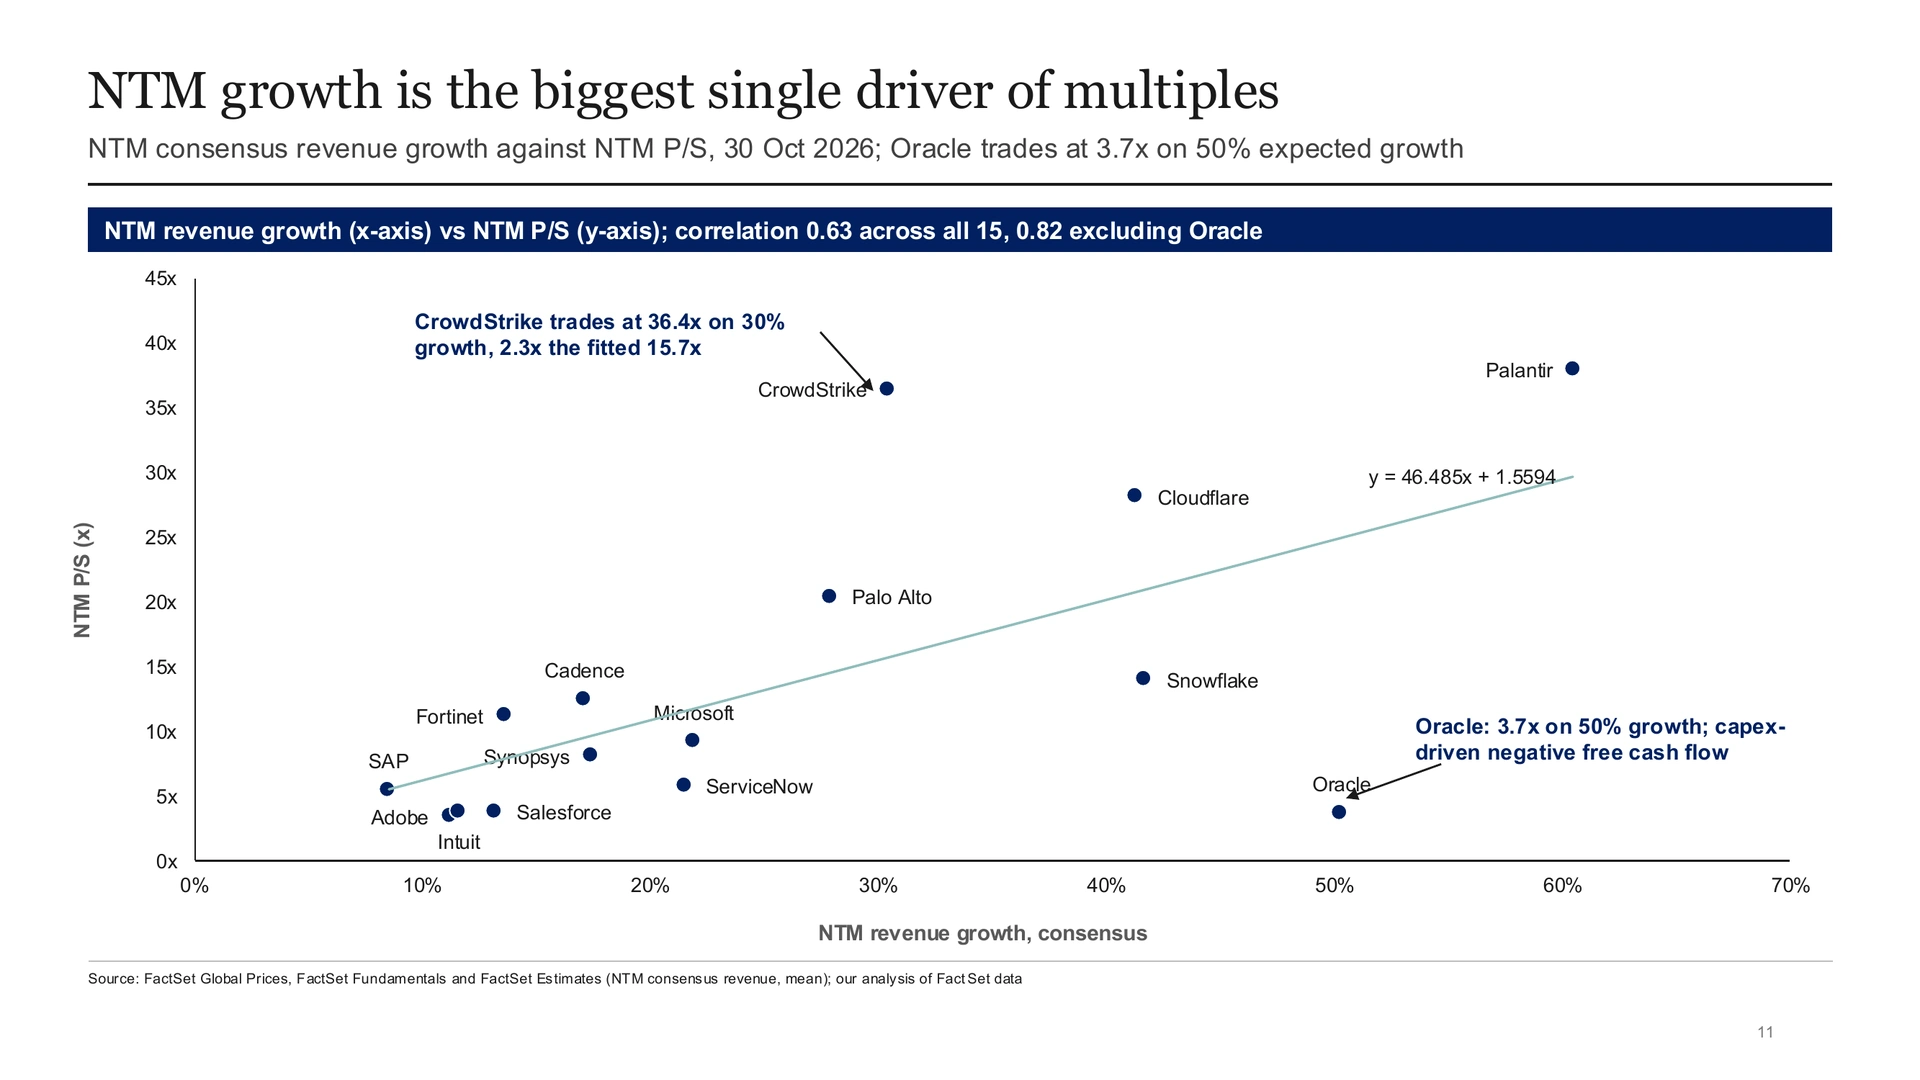
NTM growth is the biggest single driver of multiples
Across the 15 names, NTM revenue growth and NTM P/S correlate at 0.63, so growth accounts for about 40% of the variance in multiples. Without Oracle, the correlation is 0.82, or about two-thirds of the variance. CrowdStrike is the clear outlier on the expensive side: 36.4x on 30% expected growth, about 2.3x the 15.7x the fitted line implies.
Oracle is the outlier on the other side, at 3.7x on 50% expected growth.
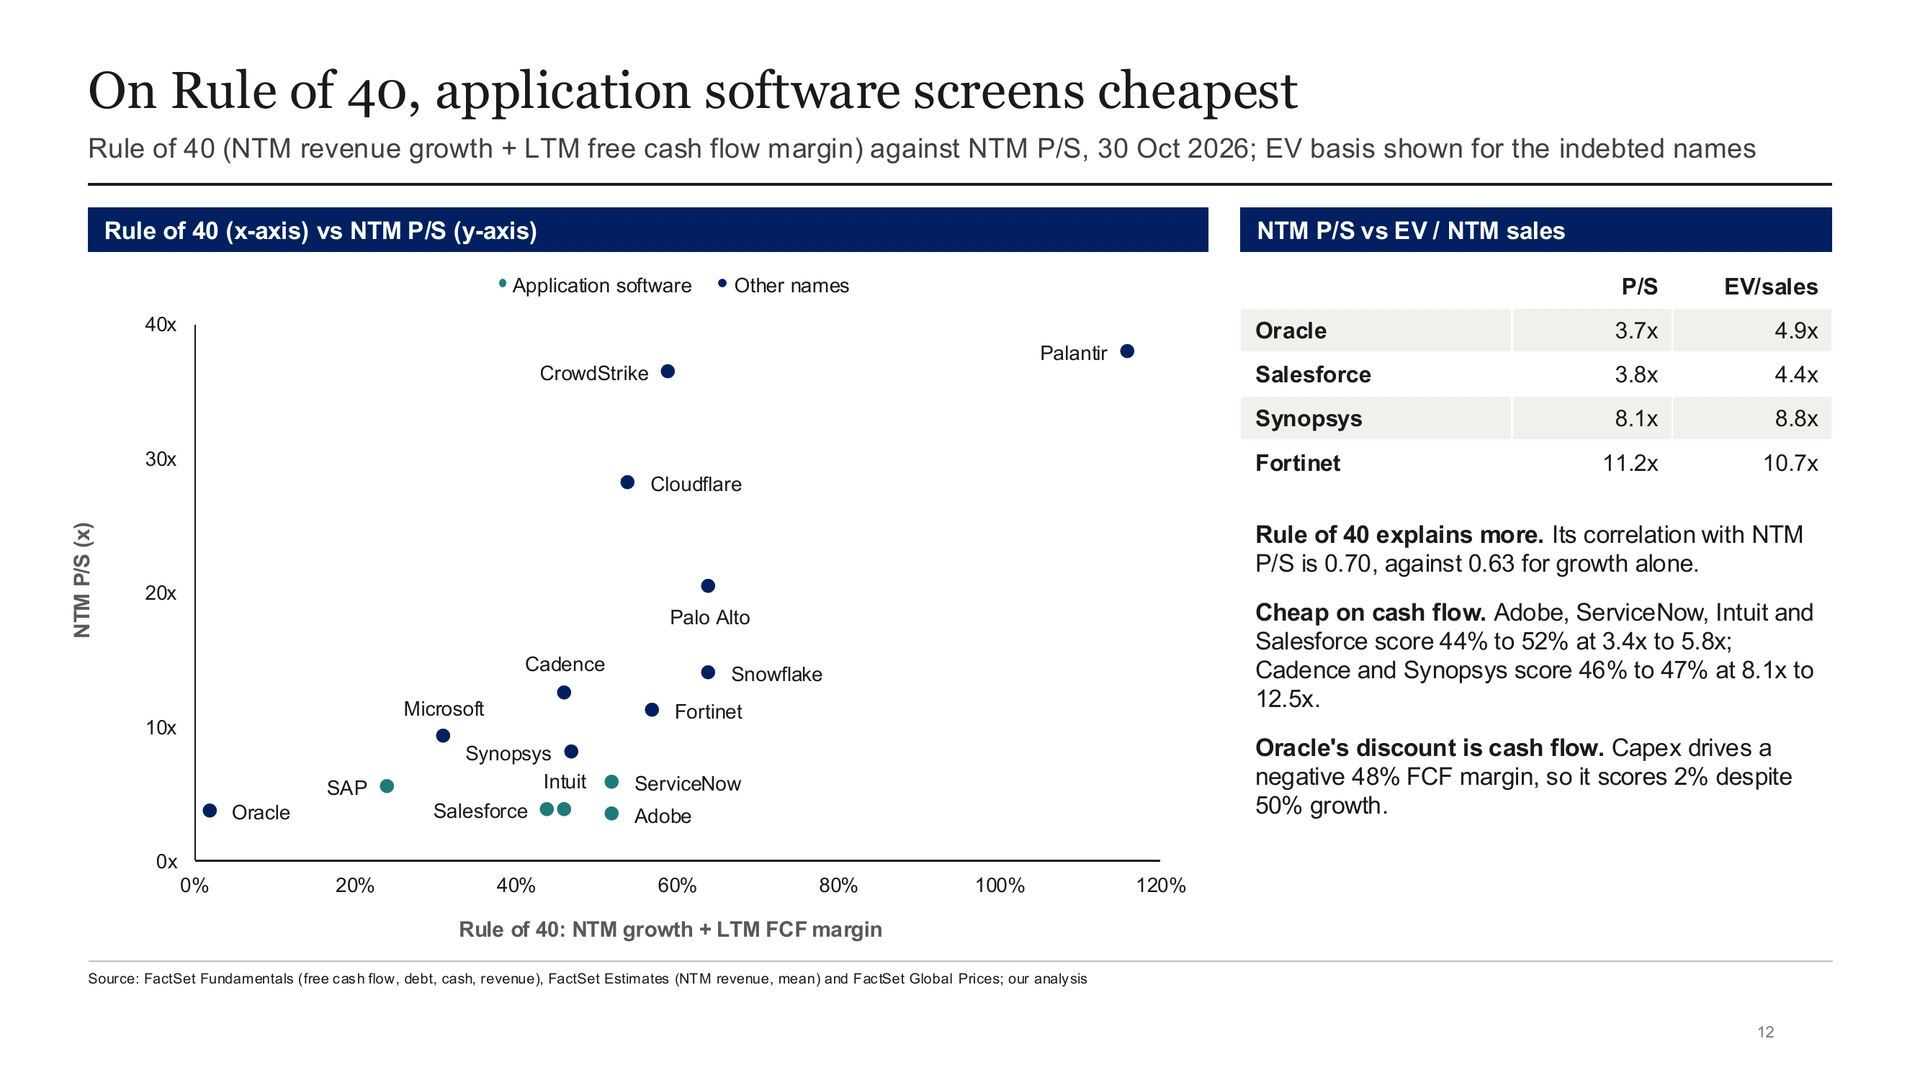
On Rule of 40, application software screens cheapest
Adding free cash flow explains more. The Rule of 40 (NTM revenue growth plus LTM free cash flow margin) correlates with NTM P/S at 0.70, against 0.63 for growth alone.
On that basis, application software looks cheapest. Adobe, ServiceNow, Intuit and Salesforce score 44% to 52% and trade at 3.4x to 5.8x sales. Cadence and Synopsys score about the same, 46% to 47%, and trade at 8.1x to 12.5x.
Oracle’s discount is cash flow. Capex for its cloud build-out drives a free cash flow margin of -48%, so it scores 2% on the Rule of 40 despite 50% expected growth.
What investors pay for in AI
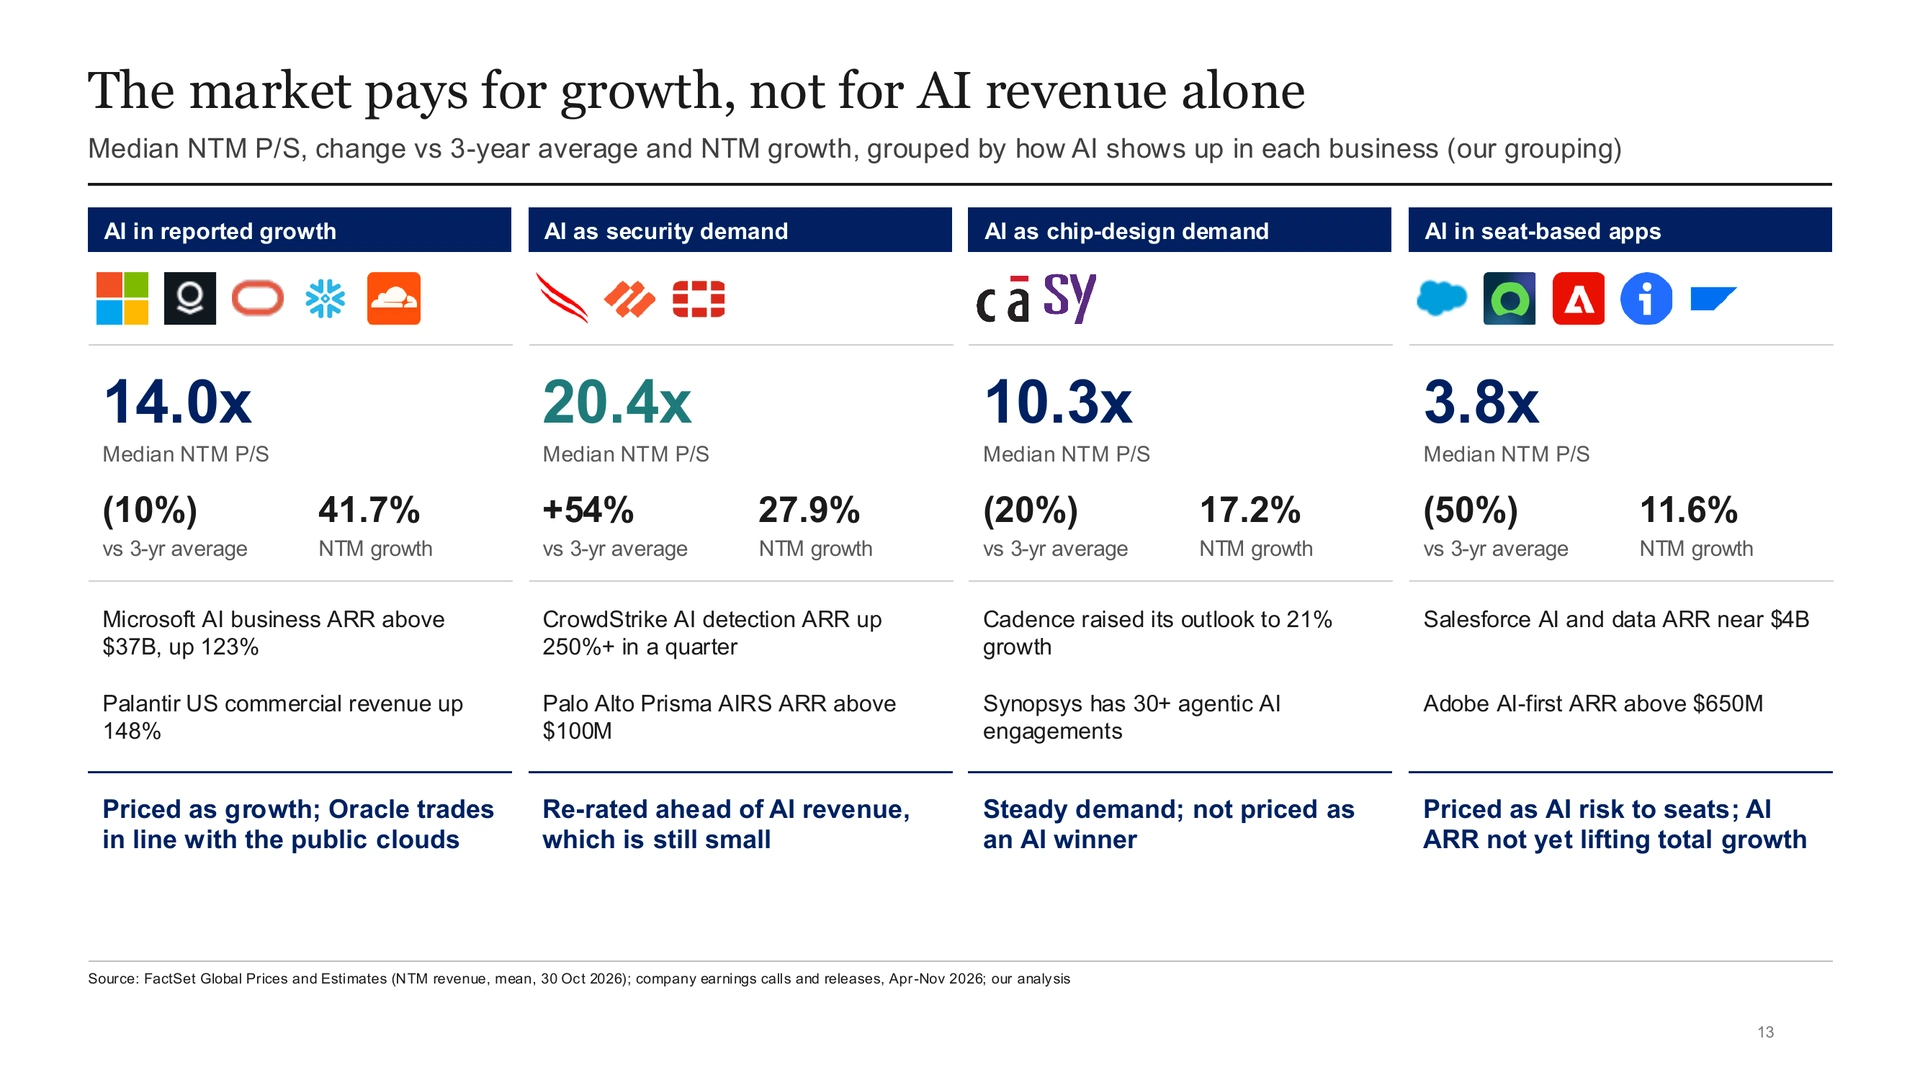
The market pays for growth, not for AI revenue alone
We grouped the 15 names by how AI shows up in each business.
| Group | Companies | Median NTM P/S | vs 3-year average | NTM growth | Evidence |
|---|---|---|---|---|---|
| AI in reported growth | Microsoft, Palantir, Oracle, Snowflake, Cloudflare | 14.0x | -10% | 41.7% | Microsoft’s AI business ARR above $37B, up 123%; Palantir US commercial revenue up 148% |
| AI as security demand | CrowdStrike, Palo Alto Networks, Fortinet | 20.4x | +54% | 27.9% | CrowdStrike AI detection ARR up 250%+ in a quarter; Palo Alto Prisma AIRS ARR above $100M |
| AI as chip-design demand | Cadence, Synopsys | 10.3x | -20% | 17.2% | Cadence raised its outlook to 21% growth; Synopsys has 30+ agentic AI engagements |
| AI in seat-based apps | Salesforce, ServiceNow, Adobe, Intuit, SAP | 3.8x | -50% | 11.6% | Salesforce AI and data ARR near $4B; Adobe AI-first ARR above $650M |
Source: FactSet, October 30, 2026; company earnings calls and releases, April to November 2026. The groupings and medians are our computation.
The market pays for growth, not for AI revenue alone. The group with AI already in reported growth trades at 14.0x, but 10% below its 3-year average, while security re-rated 54% above its average on AI revenue that is still small. Seat-based applications are priced for AI risk to their seats, because their AI ARR is not yet lifting total growth.
Salesforce looks under-rated on AI; Oracle is priced like a cloud
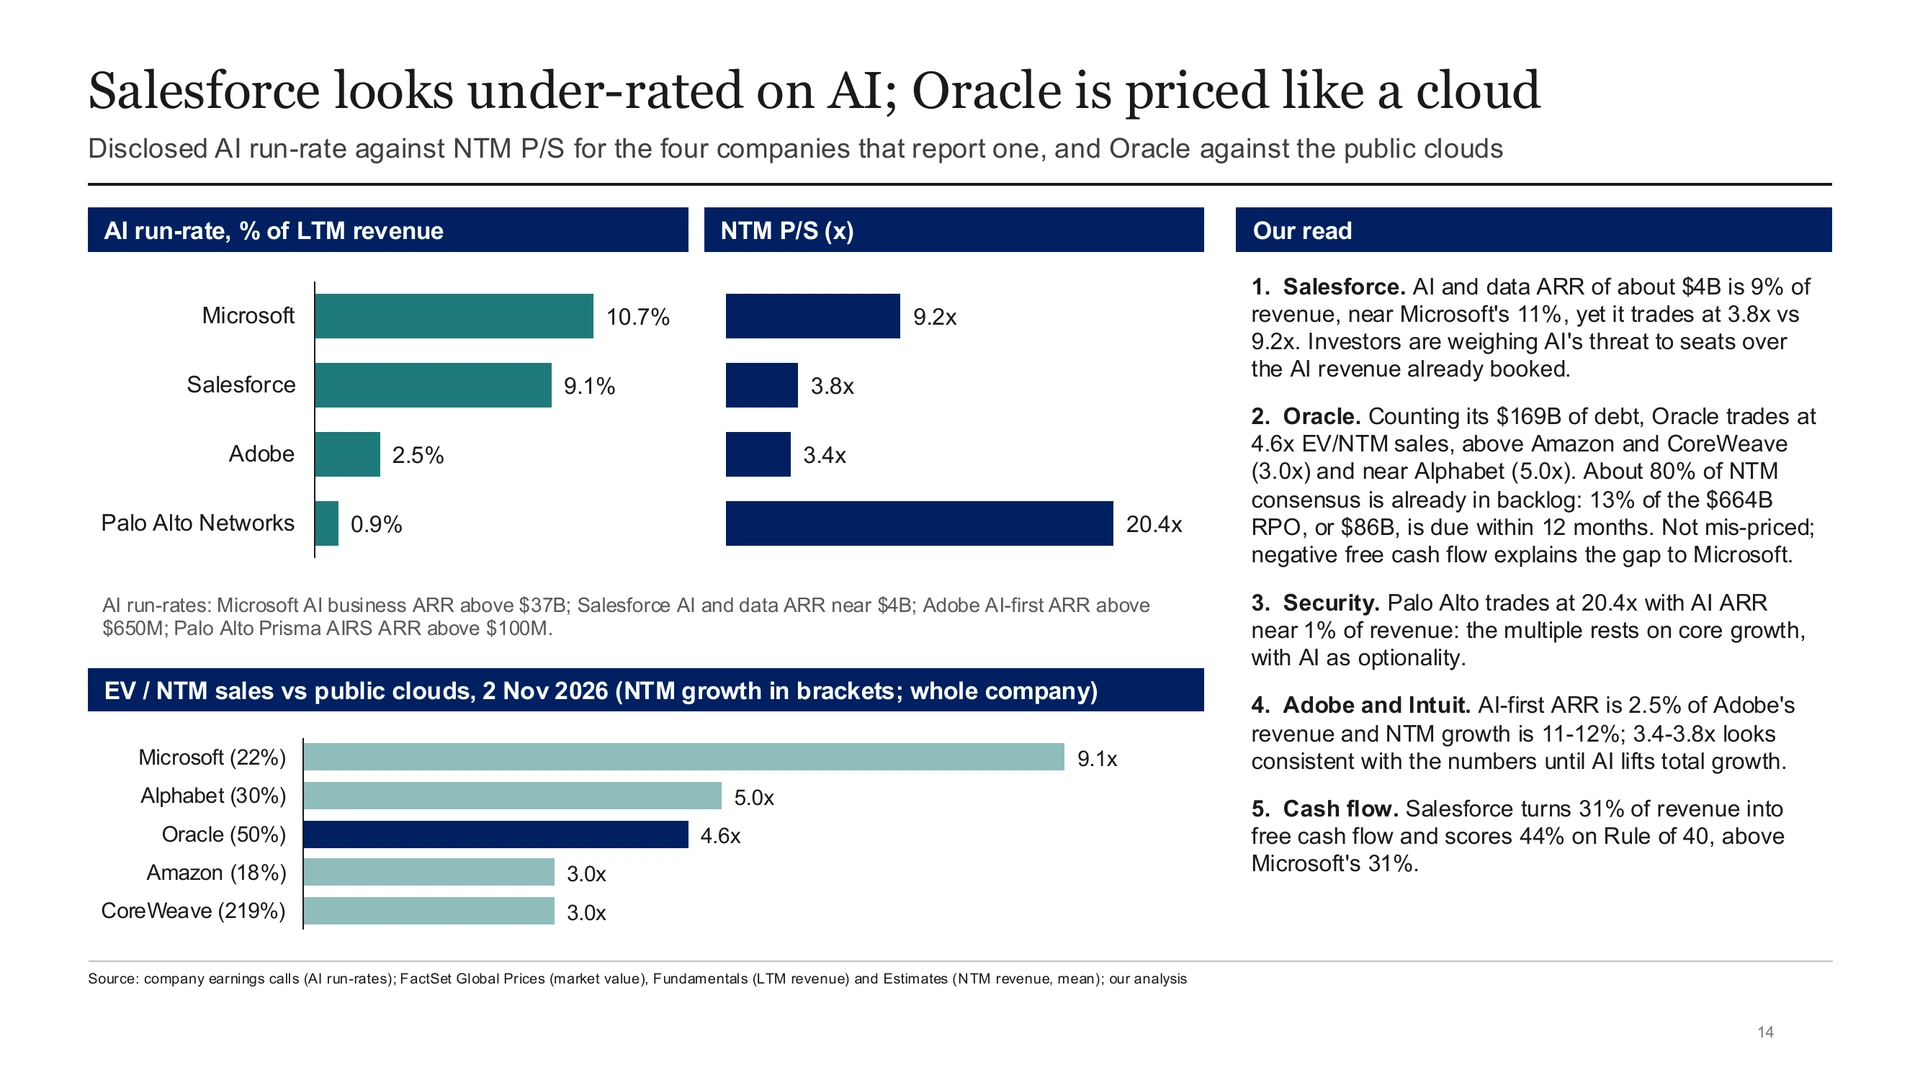
Salesforce. Its AI and data ARR of about $4B is 9% of revenue, close to Microsoft’s 11% ($37B+ on $346B). Yet Salesforce trades at 3.8x NTM sales and Microsoft at 9.2x. Investors are weighing AI’s threat to seats over the AI revenue already booked. Salesforce also turns 31% of revenue into free cash flow and scores 44% on the Rule of 40, above Microsoft’s 31%.
Oracle. At 3.7x NTM sales on 50% expected growth, Oracle looks like the obvious mispricing. We don’t think it is. Counting its $169B of debt and at November 2 market values, Oracle trades at 4.6x EV/NTM sales (4.9x at the October 30 close in the company table), above Amazon and CoreWeave at 3.0x and near Alphabet at 5.0x. About 80% of NTM consensus is already in backlog: 13% of its $664B of remaining performance obligations, or $86B, is due within 12 months. The street isn’t missing the growth. It is pricing the capex.
Palo Alto Networks trades at 20.4x with AI ARR near 1% of revenue: the multiple rests on core growth, with AI as an option. Adobe and Intuit trade at 3.4x to 3.8x on 11% to 12% expected growth, which looks consistent with the numbers until AI lifts total growth.
What comes next
Security is priced as if nothing breaks, and seat-based software is priced as if it is already broken. CrowdStrike trades at more than twice the multiple its growth implies. Adobe, Intuit and ServiceNow trade at about half their 3-year averages, and Salesforce a third below, while all four clear the Rule of 40.
Both can’t be right forever. The test for application software is whether AI ARR starts to lift total growth. The test for security is whether growth keeps up with the multiple.
How we built it
Compound built the analysis as a 16-slide deck with a backing workbook, from FactSet.
- Universe. The 15 largest listed enterprise software companies by FactSet market value on November 2, 2026. Shopify and AppLovin are excluded as commerce and ad-tech platforms. Together the 15 are worth $6.52T, and Microsoft is 59% of that.
- NTM P/S. Month-end market capitalization divided by FactSet consensus mean revenue for the next twelve months. This is equity value, not enterprise value; we show EV/sales separately for the indebted names.
- Growth. Reported quarterly revenue in USD, with fiscal quarters mapped to calendar quarters. NTM growth is NTM consensus against LTM revenue. Acquired revenue is included as reported.
- Averages. The 3-year average covers the 36 month-ends from November 2023 to October 2026; peaks run from January 2020.
- ARR and AI run-rates. ARR is shown only where a company reports an ARR figure that FactSet records as an actual: company-level ARR for CrowdStrike and Adobe, and Next-Generation Security ARR for Palo Alto Networks. AI run-rates come from company earnings calls.
Every number in the deck traces back through the workbook to its source and date: FactSet for prices, financials and estimates, company earnings calls for AI run-rates, and Oracle’s 10-Q for its backlog. That is full auditability of financial models. Put the same work on a schedule and Compound refreshes the comparable company analysis or sector deck each quarter. See industry research with Compound.
Download the deck
Public software growth and valuation deck (PDF): November 2026The 16-slide deck behind this post: findings, market cap composition, reported and consensus revenue growth, ARR, NTM P/S since January 2020 with quartiles, cohort multiples, each company against its 3-year average, growth and Rule of 40 against multiples, the AI groupings, Salesforce and Oracle on an EV basis, and the company appendix and method, every figure sourced to FactSet, company earnings calls or filings.
Download · FreeFrequently asked questions
What is the median SaaS valuation multiple in 2026?
Broad indices put it near 4x revenue: Software Equity Group’s index of 107 public SaaS companies at 4.1x EV/TTM revenue in the third quarter of 2026, and Aventis Advisors’ 54 pure-play SaaS names at 4.6x EV/LTM revenue at the end of August. On the same trailing basis, the 15 largest listed software companies trade at a median 11.4x EV/LTM revenue; on forward revenue they trade at 9.2x NTM sales and 9.3x EV/NTM sales.
Why do the largest software companies trade above the SaaS median?
They grow faster. Median year-over-year revenue growth across our 15 names was 24.2% in the second quarter of 2026, against 11.8% for Aventis Advisors’ pure-play SaaS sample. Growth is the biggest single driver of multiples: NTM growth and NTM P/S correlate at 0.63 across the 15, and at 0.82 without Oracle. The group also holds security and data infrastructure names that sit at the top of the broad indices, such as Cloudflare and CrowdStrike.
Why has application software de-rated?
The application cohort (Salesforce, ServiceNow, Adobe, Intuit, SAP) trades at 3.8x NTM sales, 47% below its 3-year average. It is expected to grow 9% to 22%, and investors are pricing the risk that AI agents reduce software seats. AI ARR at Salesforce and Adobe is growing but is not yet lifting total growth.
What is a good price-to-sales ratio for a public software company?
Expected growth sets it. The middle half of the 15 largest software names trades between 4.6x and 17.2x NTM sales, around a 9.2x median. Names expected to grow 25% or more trade at a 24.3x median; slower growers at 5.8x. Application software, expected to grow 9% to 22%, trades at 3.4x to 5.8x.
Which public software companies pass the Rule of 40?
12 of the 15, on NTM revenue growth plus LTM free cash flow margin. Palantir scores highest at 116%, followed by Palo Alto Networks, Snowflake, CrowdStrike, Fortinet and Cloudflare at 54% to 64%. Microsoft (31%), SAP (24%) and Oracle (2%) fall short; Oracle’s capex drives a free cash flow margin of -48%. The median score is 52%.
Is Oracle undervalued at 3.7x sales?
Not on our numbers. Counting its $169B of debt, Oracle traded at 4.6x EV/NTM sales at November 2 market values, above Amazon and CoreWeave. About 80% of its NTM consensus revenue is already in backlog, and capex drives a free cash flow margin of -48%. The market is pricing the capex, not missing the growth.
How do you keep a public software comps set current?
Put it on a schedule. Compound reruns the comps each quarter, or when a company in the set reports, from its built-in filings, financial statements and prices, plus consensus estimates from FactSet. Every number in the workbook and deck traces back to its source and date, so each refresh can be audited number by number.
Sources: FactSet Global Prices (month-end close and shares outstanding), FactSet Fundamentals (quarterly revenue, free cash flow, debt and cash) and FactSet Estimates (NTM consensus revenue, mean; reported ARR), pulled November 3, 2026; company earnings calls and releases, April to November 2026, for AI run-rates and ARR definitions; Oracle 10-Q for the quarter ended August 31, 2026, for remaining performance obligations. Prices are as of October 30, 2026, and EV comparisons with the public clouds as of November 2, 2026. Broad SaaS index medians: Software Equity Group, SaaS M&A and Public Market Report, 3Q26; Aventis Advisors, SaaS Valuation Multiples: 2015-2026, August 31, 2026. Cohorts, AI groupings, correlations, fitted values and the 11.4x median EV/LTM revenue are our own analysis of FactSet data.