| B | C | D | E | |
|---|---|---|---|---|
| 21 | UNLEVERED RETURNS AT THE INPUT PRICE | Underwriting | ||
| 22 | Unlevered IRR | 7.52% | ||
| 23 | Unlevered multiple (cash returned / total acquisition cost) | 1.81x | ||
| 26 | Price for an 8.0% unlevered IRR ($) | $46,393,6281 | ||
| 27 | Price for an 8.0% unlevered IRR ($/SF) | $186.77 | ||
| 30 | NOI, CAP RATES AND VALUE | Underwriting | OM | Difference |
| 31 | In-place NOI ($) | 2,552,106 | 2,879,326 | (327,220) |
| 32 | In-place cap rate | 5.32% | 6.00% | (0.68%) |
| 33 | Year 1 (2027) NOI ($) | 2,664,417 | 3,139,561 | (475,144) |
| 34 | Going-in cap rate (Year 1 NOI / price) | 5.55%2 | 6.54% | (0.99%) |
| 37 | Stabilized yield on cost | 5.84% | 6.85% | (1.01%) |
- 1$46,393,628, or $186.77/SF: 3.3% below the ask
- 299 bps below the OM on the same price
You are the associate on the buy side of Cedar Fork Commerce Park, a 248,400 square foot multi-tenant industrial and flex park in Lewisville, Texas, 92% leased to 17 tenants. The broker’s offering memorandum (OM) asks $48.0M, $193 a square foot, a 6.00% cap rate on the seller’s in-place NOI of $2.88M. Your fund wants an 8.0% unlevered return over a ten-year hold, and you owe the investment committee a bid.
This page builds the buyer’s pro forma first and then works through it one line at a time, each step run in Compound. The answer at the end: the ask returns 7.52%, and 8.0% needs $46.4M. Figures in the text are rounded, in $M for the park and $k for single lines and suites. The tables show Compound’s exact figures.
Each suite ID is a building letter and a suite number, so B-200 is Building B, suite 200. The park has six buildings, A to F, holding 19 suites, two of them vacant. These suites come up on this page.
| Suite | Tenant | What the model does with it |
|---|---|---|
| A-100 | Lone Star Cabinetry | Weights its 2028 exit right at 50% |
| B-100 | Trinity Medical Logistics | Renews at its fixed $11.25 rate |
| B-200 | Pecan Street Brewing Supply | Free rent through January 2027 |
| B-300, E-200 | Vacant | Leased from July 2027 |
| C-100 | Brazos Fire Protection | Rent step shown early, timing only |
| C-200 | Redbird HVAC Services | $38.5k of unpaid TI, credited at closing |
| C-300 | Caddo Solar Installers | Rent on the remeasured 9,200 square feet |
| F-300 | Prairie Dental Lab | No signed lease, rolls to market |
We gave Compound the data room (OM, 17 leases and amendments, rent roll, monthly T12, general ledger detail, appraisal, property condition assessment, tax notice) and the lease abstract from the rent roll analysis, and asked for the buyer’s model. It ran once.
Cedar Fork Commerce Park, its tenants and its data room are illustrative: a made-up property built to read like a real deal. The underwriting model and the one-page summary on this page come from one real Compound run on that room, quoted unedited.
The real estate pro forma: Cedar Fork’s annual cash flow
The first step builds the model, so every later step has a line to point at.
Compound returned a 12-sheet model. A monthly cash flow through 2037 rolls each lease forward, and the Annual CF sheet sums it by calendar year. This is that sheet, the pro forma itself.
| B | D | E | I | M | O | |
|---|---|---|---|---|---|---|
| 5 | Year ending | 2027E | 2028E | 2032E | 2036E | Hold total |
| 8 | REVENUE | |||||
| 9 | Base rent, in-place leases | 2,706,107 | 2,090,809 | 267,338 | 0 | 8,260,050 |
| 10 | Base rent, rollover and lease-up leases (potential) | 655,471 | 1,359,134 | 3,623,624 | 4,538,951 | 30,797,947 |
| 11 | Downtime vacancy | -229,721 | -182,929 | -295,115 | -84,875 | -1,283,315 |
| 12 | Free rent | -130,362 | -18,808 | -229,516 | -117,897 | -1,047,378 |
| 13 | Base rental revenue | 3,001,495 | 3,248,206 | 3,366,332 | 4,336,179 | 36,727,304 |
| 14 | Expense recoveries | 1,431,823 | 1,484,897 | 1,591,793 | 1,845,218 | 16,464,183 |
| 15 | Rental revenue | 4,433,318 | 4,733,103 | 4,958,124 | 6,181,397 | 53,191,487 |
| 16 | General vacancy and credit loss | -44,333 | -47,331 | -49,581 | -61,814 | -531,915 |
| 17 | Late fees | 6,180 | 6,365 | 7,164 | 8,063 | 70,847 |
| 18 | Effective gross revenue ($) | 4,395,165 | 4,692,137 | 4,915,707 | 6,127,646 | 52,730,419 |
| 20 | OPERATING EXPENSES | |||||
| 21 | Real estate taxes | -1,080,0001 | -1,101,600 | -1,192,407 | -1,290,700 | -11,825,699 |
| 22 | Insurance | -107,458 | -110,682 | -124,573 | -140,208 | -1,231,884 |
| 23 | CAM / common area | -345,400 | -355,762 | -400,413 | -450,669 | -3,959,626 |
| 24 | Management fee | -133,000 | -141,993 | -148,744 | -185,442 | -1,595,745 |
| 25 | Admin / non-recoverable | -25,750 | -26,522 | -29,851 | -33,598 | -295,194 |
| 26 | Roof repairs | -39,140 | -40,314 | 0 | 0 | -79,454 |
| 27 | Total operating expenses ($) | -1,730,748 | -1,776,874 | -1,895,989 | -2,100,617 | -18,987,602 |
| 29 | Net operating income ($) | 2,664,417 | 2,915,264 | 3,019,7192 | 4,027,030 | 33,742,817 |
| 33 | CAPITAL AND LEASING | |||||
| 34 | PCA capital plan | -341,1363 | -351,370 | 0 | 0 | -979,774 |
| 35 | General capital reserve | -37,260 | -38,378 | -43,195 | -48,616 | -427,144 |
| 36 | Tenant improvements | -126,998 | -20,610 | -232,430 | -92,528 | -973,118 |
| 37 | Leasing commissions | -200,789 | -93,385 | -381,789 | -130,966 | -1,602,447 |
| 38 | Capital and leasing costs ($) | -706,184 | -503,743 | -657,413 | -272,110 | -3,982,483 |
| 39 | A-100 termination fee (probability-weighted) | 0 | 47,463 | 0 | 0 | 47,463 |
| 41 | Cash flow before debt service ($) | 1,958,234 | 2,458,984 | 2,362,305 | 3,754,920 | 29,807,797 |
- 1Taxes reset to the $48.0M price on 1/1/2027, $441,000 above the seller's 2026 bill
- 22032: the leases signed on the 2027 rollover expire again, and NOI falls 13.6%
- 3PCA work on the leaking Building C roof. The OM carries $150,000 of roof capital
Read it top down. Rent from signed leases runs off as they expire, and rent from the next leases replaces it, less downtime and free rent. Tenants repay most operating expenses, so NOI is what the landlord keeps. Capital and leasing costs come after NOI, and cash flow before debt service is what the IRR runs on.
Takeaway: NOI grows from $2.66M in 2027 to $4.03M in 2036, but rollover makes the path uneven, and capital and leasing costs take $3.98M out of cash flow over the hold.
What each line of the pro forma means, and how it is projected
The second step sets out what each line is and where its numbers come from, so the changes that follow are easy to place.
Net operating income (NOI) is rent and other income, less vacancy, minus operating expenses. It sits before debt service, capital spending and depreciation. The cap rate is NOI divided by price, so value is NOI divided by the cap rate. On the OM’s numbers, $2.88M / $48.0M = 6.00%.
| Line | What it is | How Cedar Fork’s model projects it |
|---|---|---|
| Base rent, in-place leases | Rent under the signed leases | Each lease’s rent schedule, step by step, to its expiry, or to June 2028 for half of A-100 |
| Base rent, rollover and lease-up | Rent from the next lease on each suite, and on the vacant suites | Appraisal market rent ($14.50 small bay, $12.75 large bay in 2027), grown 3.0% a year. 70% of tenants renew, at 95% of market under an FMV option, and 30% are replaced |
| Downtime vacancy | Rent lost while a suite sits empty | Six months before a new tenant, weighted by the 30% chance a tenant leaves |
| Free rent | Months of abated rent on a new lease | Lease comps: 3.0 months small bay, 5.5 months large bay. Option renewals get none |
| Expense recoveries | Tenants’ NNN share of taxes, insurance and CAM | Each suite’s pro rata share, with the 5% controllable CAM caps in three leases. Vacant suites and F-300 pay none |
| General vacancy and credit loss | Allowance for tenants who stop paying | 1.0% of base rent and recoveries, on top of modeled downtime |
| Late fees | Other income | T12’s $6,000, grown 3.0% a year |
| Real estate taxes | County property tax | Reset to the purchase price from January 2027 at the 2.25% rate. Assessed value then grows 2.0% a year |
| Insurance, CAM, admin | Operating costs | T12 amounts grown 3.0% a year, the OM’s own growth rate |
| Management fee | Property manager’s fee | 3.0% of base rent and recoveries, the T12’s ratio |
| Roof repairs | Patching the Building C roof | T12’s $38,000, grown 3.0%, through 2028 when the roof is replaced |
| PCA capital plan | Capital work the property condition assessment calls for | PCA’s schedule placed in hold years, escalated 3.0% a year |
| General capital reserve | Allowance for capital outside the PCA | The OM’s $0.15 a square foot, grown 3.0% a year |
| Tenant improvements (TI) | Landlord’s build-out money for a tenant | Comps’ $3.83 small bay and $3.75 large bay a foot on new leases, half that on renewals without an option |
| Leasing commissions (LC) | Brokers’ fees on a signed lease | 6% of aggregate base rent on a new lease, 3% on a renewal |
Every input sits on the Assumptions sheet with its source. Where the room had none, the cell is yellow and labeled “Buyer assumption”.
Takeaway: each line traces to a lease, the T12, a county notice, the PCA or a labeled judgment, so each change below starts from a known line.
How to calculate NOI from the T12: base rent, other income and roof repairs
The third step rebuilds the seller’s in-place NOI, which changes three lines the OM starts from.
To calculate NOI the way a buyer does, start from the T12, the trailing twelve months operating statement, and not from the OM. Cedar Fork’s T12 shows NOI of $2.65M for October 2025 to September 2026. The OM’s $2.88M is $227.1k higher. It replaces T12 base rent of $2.83M with the rent roll’s annualized $3.02M, and it adds back $38k of roof repairs as non-recurring.
Then Compound opened the general ledger. Of the T12’s $148k of other income, $142k sits in account 4810, Lease Termination Income. That is a one-time fee Gulf Coast Vending paid to leave suite B-200 in January 2026. At the OM’s 6.00% cap, the fee carries $2.37M of the asking price (our arithmetic).
From the OM's in-place NOI to the buyer's
Annualized at September 30, 2026, each step sourced on the NOI Bridge sheet
Source: Cedar Fork OM, T12, GL detail, leases, PCA and Denton CAD notice (illustrative). Calculation by Compound, NOI Bridge B5:D23.
The three rent roll fixes come from the rent roll analysis. C-300 is still billed on 9,800 square feet after a remeasurement to 9,200 ($8.6k). C-100 is shown at a rent step that starts in November ($5.5k, timing only, so the 2027 cash flow carries the step). F-300 is carried at $100.7k on an extension nobody signed. The NOI Bridge sheet puts the source document next to every line, down to a $0.21 rounding difference between the OM’s expense total and the T12’s.
Takeaway: in-place NOI is $2.55M, not $2.88M, a 5.32% cap rate on the ask. The documents alone remove $294.7k, and the tax reset in the next step removes the rest.
Property taxes in a pro forma: the reset the OM leaves out
The fourth step changes the real estate tax line and the recoveries that follow it.
Denton CAD appraises property at market value each January 1, and a $48.0M sale is strong evidence of that value. Texas does not require sale prices to be disclosed, so the model treats full reassessment as the conservative case. The OM holds the seller’s 2026 bill of $639k, the county’s $28.4M appraised value at the 2.25% combined rate, and grows it 2% a year. Compound reassessed at the purchase price from January 1, 2027: $48.0M x 2.25% = $1.08M, or $441k more than the seller pays.
Most of it comes back. Cedar Fork’s leases are NNN (triple net), so tenants pay their pro rata share of taxes, insurance and common area costs on top of base rent. NNN tenants repay $394.0k of the increase. The other $47.0k stays with the landlord as the share of the 26,500 square feet with no executed lease: vacant B-300 and E-200, and F-300. The due diligence page’s $35.3k counts only the two vacant suites. This model also counts F-300, because without an executed lease nothing obliges Prairie Dental to pay recoveries.
| B | C | D | E | F | |
|---|---|---|---|---|---|
| 41 | YEAR 1 (2027): OM CASH FLOW AGAINST UNDERWRITING | OM ($) | Underwriting ($) | Difference ($) | Main reason |
| 42 | Base rental revenue, net of downtime and free rent | 3,386,848 | 3,001,495 | (385,353) | Rent roll errors and F-300; OM leases every suite from month 1 |
| 43 | Expense recoveries | 1,082,447 | 1,431,823 | 349,376 | Higher taxes passed through to NNN tenants |
| 44 | General vacancy and credit loss | (89,386) | (44,333) | 45,053 | OM 2.0%; ours 1.0% plus modeled downtime |
| 45 | Other income (late fees) | 6,180 | 6,180 | 0 | |
| 46 | Effective gross revenue | 4,386,090 | 4,395,165 | 9,075 | |
| 47 | Real estate taxes | (651,780) | (1,080,000)1 | (428,220) | OM holds the $28.4M CAD value |
| 48 | Insurance | (107,458) | (107,458) | 0 | |
| 49 | CAM / common area | (345,400) | (345,400) | 0 | |
| 50 | Management fee | (116,141) | (133,000) | (16,859) | 3.0% of a larger revenue base |
| 51 | Admin / non-recoverable | (25,750) | (25,750) | 0 | |
| 52 | Roof repairs | 0 | (39,140)2 | (39,140) | OM drops them; the roof leaks until replaced |
| 53 | Total operating expenses | (1,246,529) | (1,730,748) | (484,219) | |
| 54 | Net operating income | 3,139,561 | 2,664,417 | (475,144)3 |
- 1Purchase price x 2.25%, reassessed at 100% of price: a buyer assumption you can change
- 2Repairs carried through 2028, when the PCA has the Building C roof replaced
- 315.1% below the OM's first year
Effective gross revenue barely moves, because higher recoveries offset lower rent, so the gap sits in the expense lines. The reset also raises every tenant’s occupancy cost before it renews. Taxes go from $2.57 to $4.35 a square foot (our arithmetic), so a tenant weighing a renewal at $14.50 net pays about $1.78 more all in. Reassessing at 100% of the price is a judgment call. The tax cell is a yellow input marked “Buyer assumption”, so if your tax consultant expects 85%, you change one cell.
Takeaway: 2027 NOI is $2.66M against the OM’s $3.14M, 15.1% lower, and the tax line explains most of the gap.
Lease rollover assumptions: renewal, downtime, free rent, TI and commissions
The fifth step sets the assumptions behind the rollover lines, which the OM leaves at zero.
The OM leases the two vacant suites from January 2027 and renews every expiring tenant at market with no downtime, free rent, TI or commissions. Eight leases covering 103,600 square feet expire in 2027 and 2028. A-100’s termination right (31,200 square feet, June 30, 2028) brings the exposure to 54% of the park.
For each suite the run set renewal probability, downtime, free rent, TI, commissions and market rent, blended by probability. Where the room had no answer, Compound made a call and labeled it. The run’s notes list them as “my judgment calls, because the data room has no source for them”.
| B | C | D | |
|---|---|---|---|
| 20 | MARKET LEASING | ||
| 33 | Renewal probability | 70%1 | Buyer assumption; the OM assumes 100% with no downtime, TI or commissions |
| 34 | Downtime before a new tenant (months) | 62 | Buyer assumption; B-200 sat about six months between tenants |
| 28 | Free rent on a new lease, small bay (months) | 3.0 | Small-bay comps average (Lease Comps) |
| 29 | Free rent on a new lease, large bay (months) | 5.5 | Large-bay comps average (Lease Comps) |
| 30 | TI on a new lease, small bay ($/SF, 2027) | $3.83 | Small-bay comps average (Lease Comps); B-200 got $10.00/SF |
| 31 | TI on a new lease, large bay ($/SF, 2027) | $3.75 | Large-bay comps average (Lease Comps) |
| 24 | Market rent growth (per year) | 3.0%3 | Buyer assumption; the OM uses 3.5% |
| 35 | Renewal rent under an FMV option (% of market) | 95% | Leases, Sec. 13.4: 95% of Fair Market Rent |
| 44 | B-100 fixed renewal rate ($/SF/yr, flat for five years) | $11.25 | B-100 lease, Sec. 13.4 |
| 45 | B-100 renewal probability | 100% | Buyer assumption: the fixed option sits below 2028 market, so exercise is assumed |
| 39 | Leasing commission, new lease (% of aggregate base rent) | 6.0%4 | Buyer assumption; no commission agreement in the room |
| 40 | Leasing commission, renewal (% of aggregate base rent) | 3.0% | Buyer assumption; no commission agreement in the room |
| 41 | General vacancy and credit loss (% of base rent and recoveries) | 1.0% | Buyer assumption, on top of modeled downtime; the OM uses 2.0% |
- 1Judgment call: change it and the whole rollover reprices
- 2Judgment call, anchored on the park's own re-leasing of B-200
- 3Judgment call, 50 bps under the OM
- 4Judgment call: the room has no listing agreement
The weighting is explicit. 30% of a six-month gap rounds to two months of expected downtime on each expiring lease. The two option tenants cut in opposite directions. B-100’s fixed renewal locks 24,000 square feet at $11.25 flat for five years against $13.13 market in 2028, so the run assumes B-100 exercises it. A-100 can leave in June 2028 for a fee of three months’ rent ($94.9k) plus unamortized TI and commissions, which the model sets at zero because the lease has no TI allowance and the room has no commission records. A-100 pays below market, so its exit costs the landlord less than it looks. The IRR is 7.46% if A-100 leaves and 7.57% if it stays, and the run weights the exit at 50%.
Takeaway: an investment committee can argue with 70% renewal and six months of downtime, because each sits in a yellow cell with its reason.
What lease rollover costs, year by year
The sixth step reads what those assumptions do to the downtime and free rent lines over the hold.
Rent lost to rollover each year
Downtime vacancy plus free rent. The OM carries zero in every year
Source: Cedar Fork leases and lease comps (illustrative). Calculation by Compound, Annual CF rows 11-12.
Over the ten-year hold, downtime costs $1.28M of rent and free rent $1.05M, before $973.1k of TI and $1.60M of commissions. The timing matters more than the total. Five-year leases signed on the 2027 rollover expire again in 2032, and NOI falls 13.6% that year before it recovers. 2037 is another heavy rollover year, so the forward NOI the next buyer pays for is 6.3% below 2036’s.
Takeaway: rollover costs $2.33M of rent over the hold, and it bunches in 2027, 2032 and the exit year.
Capex from the property condition assessment
The seventh step fills the capital lines below NOI from the property condition assessment (PCA) instead of the OM’s roof line.
The OM budgets $150k for the Building C roof and a $0.15 a square foot reserve, and treats the T12’s $38k of roof repairs as non-recurring. The PCA, dated August 22, 2026, says the Building C roof is the original 2001 built-up roof, leaks now and needs replacing for $612k over years 1 and 2. It adds $185k of parking and truck court overlay in year 3 and nine rooftop HVAC units at $126k over five years. That is $923k in 2026 dollars, $773k more than the OM’s roof line (our arithmetic).
| B | E | F | G | H | I | P | |
|---|---|---|---|---|---|---|---|
| 5 | PCA year | 1 | 2 | 3 | 4 | 5 | Total, hold |
| 6 | Model year | 2027E | 2028E | 2029E | 2030E | 2031E | |
| 9 | Building C roof replacement (original 2001 BUR, active leaks) | 306,000 | 306,000 | 0 | 0 | 0 | 612,0001 |
| 10 | Parking and truck court mill and overlay, Buildings D-F | 0 | 0 | 185,000 | 0 | 0 | 185,000 |
| 11 | RTU replacements (9 units) | 25,200 | 25,200 | 25,200 | 25,200 | 25,200 | 126,000 |
| 12 | PCA total (2026 dollars) | 331,200 | 331,200 | 210,200 | 25,200 | 25,200 | 923,000 |
| 18 | PCA capital, escalated | 341,136 | 351,370 | 229,691 | 28,363 | 29,214 | 979,774 |
- 1PCA: original 2001 BUR with active leaks. The OM's whole roof capital is $150,000
The leaking roof changes NOI as well. The run keeps the repairs in operating expenses through 2028 ($39.1k and $40.3k) instead of adding them back, then drops them once the roof is replaced. The lease form lists roof repairs and a property management fee among recoverable Operating Expenses (Section 3.1). The seller’s T12 bills tenants for neither, so the run leaves that upside out and says so.
PCA capital, escalated
$979,774
Tenant improvements
$973,118
Leasing commissions
$1,602,447
General capital reserve
$427,144
Takeaway: capital and leasing costs total $3.98M over the hold. With them in, cash flow before debt for 2027 to 2036 is $29.81M against the OM’s $37.73M.
What is a good cap rate for this park? Going-in, exit and yield on cost
The eighth step reads the cap rates off the finished NOI line and sets the exit.
A good cap rate for a property is the one buyers have recently paid for similar income, read from sale comps. Cedar Fork’s room has five sales of multi-tenant flex parks from July 2025 to June 2026 at 5.50% to 6.35%, averaging 5.90% and $198 a square foot, and an appraisal at $46.2M on a 5.75% cap. Compound used three cap rates and a yield on cost, each on a different NOI.
| Measure | NOI it uses | Basis | Underwriting | OM |
|---|---|---|---|---|
| In-place cap rate | In-place, $2,552,106 | $48.0M price | 5.32% | 6.00% |
| Going-in cap rate | 2027, $2,664,417 | $48.0M price | 5.55% | 6.54% |
| Stabilized yield on cost | 2028 (first full year after lease-up), $2,915,264 | $49.9M all-in cost | 5.84% | 6.85% |
| Exit cap rate | 2037, $3,772,835 | Sale at end of 2036 | 6.40% | none |
Yield on cost is stabilized NOI over everything spent to get there: price, closing costs, the PCA work and leasing costs through 2028, $49.9M in all. The OM’s 6.85% divides its 2028 NOI by the price alone.
The exit cap rate is 6.40%, the comps’ 5.90% average plus a 50 basis point spread for selling a park ten years older. On 2037 NOI of $3.77M that gives a gross exit value of $58.95M, or $237.32 a square foot, and $58.07M after 1.5% sale costs. That price implies value growth of 1.81% a year from today’s comps at $198.31 a square foot.
The two property valuation methods give different answers on the same room. Direct capitalization, the appraisal’s method, divides one year’s NOI by a market cap rate: $2.55M / 5.75% = $44.4M (our arithmetic). The discounted cash flow, this model’s method, discounts every year’s cash flow and the sale at the return you need: $46.4M at 8.0%. The DCF is higher because it leases up the vacant suites and F-300 over the hold, which a cap rate on in-place NOI cannot see. The due diligence memo’s $43.1M is the same kind of direct-cap check, its diligence-adjusted NOI of $2.62M at the OM’s 6.00% cap less the $612k roof. The DCF model page shows the corporate version.
Takeaway: on each measure the park yields 0.68 to 1.01 points less than the OM says, and the exit cap sits 50 basis points above today’s comps.
IRR at the ask, and the price that earns 8.0%
The ninth step runs the cash flow through the purchase price and solves for the bid.
At $48.0M, plus $480k of closing costs and a $25k Phase II the environmental report recommends, the all-equity cost is $48.49M after a $17.3k seller credit for B-200’s free rent. That credit covers January 2027 plus the December stub, which needs a negotiated credit because the abated rent means a proration gives $0. Over ten years that returns a 7.52% unlevered IRR, a 1.81x equity multiple and $39.4M of profit. Unlevered cash-on-cash, cash flow before debt over total cost, starts at 4.04% in 2027 and reaches 6.78% in 2030 (our arithmetic from the Annual CF sheet).
To find the price for 8.0%, the run noted that NPV is linear in price here, because taxes, fees and the exit all scale with it. It solved at two trial prices and checked the answer: $46.4M, or $186.77 a square foot, 3.3% below the ask, which recomputes to exactly 8.00%.
| B | C | D | E | F | G | H | I | J | |
|---|---|---|---|---|---|---|---|---|---|
| 54 | Price per SF | 7.52% | 5.65% | 5.90% | 6.15% | 6.40% | 6.65% | 6.90% | 7.15% |
| 55 | $169.08 | $42,000,000 | 10.44% | 10.08% | 9.75% | 9.43% | 9.13% | 8.84% | 8.57% |
| 56 | $177.13 | $44,000,000 | 9.76% | 9.41% | 9.08% | 8.76% | 8.46% | 8.17% | 7.89% |
| 57 | $185.19 | $46,000,000 | 9.12% | 8.77% | 8.44% | 8.12%2 | 7.82% | 7.53% | 7.26% |
| 58 | $193.24 | $48,000,000 | 8.52% | 8.17%3 | 7.84% | 7.52%1 | 7.22% | 6.93% | 6.66% |
| 59 | $201.29 | $50,000,000 | 7.95% | 7.60% | 7.26% | 6.95% | 6.65% | 6.36% | 6.08% |
| 60 | $209.34 | $52,000,000 | 7.40% | 7.05% | 6.72% | 6.40% | 6.10% | 5.81% | 5.54% |
| 61 | $217.39 | $54,000,000 | 6.88% | 6.53% | 6.20% | 5.88% | 5.58% | 5.30% | 5.02% |
- 1Base case: the ask at a 6.40% exit cap
- 2$46.0M clears the 8.0% target at the base exit cap
- 3At the ask, 8.0% needs an exit cap of about 6.0%, near the comps' 5.90% average today
Each 25 basis points on the exit cap moves the IRR about 0.3 points. The ask clears 8.0% only at an exit cap of about 6.0% or lower (our interpolation), close to today’s 5.90% comp average. Timing matters as much. The run found that a sale at the end of 2034, before the 2037 rollover, returns 8.33%.
The room has no lender quote, so the run stayed unlevered, which tests the asset before debt flatters it. A lender sizes a loan as the smallest of three limits: loan to value (LTV), debt yield (NOI over loan) and the debt service coverage ratio (DSCR, NOI over annual debt service). For illustration only, outside the run: at a 9.0% minimum debt yield, 2027 NOI of $2.66M supports at most $29.6M, about 62% of the ask. On debt-yield sizing, the 15% gap between the OM’s 2027 NOI and ours comes straight off loan proceeds.
Takeaway: the ask returns 7.52% unlevered, and 8.0% needs a price of $46.4M or an exit cap near today’s comps.
The bid: $46.4M against a $48.0M ask
The last step puts the bid and the four line changes behind it on one page for the investment committee.
At the $48.0M ask, Cedar Fork returns 7.52% unlevered, short of your 8.0%. The price that meets the target is $46.4M, about $1.6M below the ask (our arithmetic). On in-place NOI alone, the underwriting takes $327.2k off the OM’s figure, $294.7k from the documents and the rest from resetting taxes to the price. At the OM’s own 6.00% cap that is $5.45M of value. The run ended with one IC page, answer first, shown here unedited.
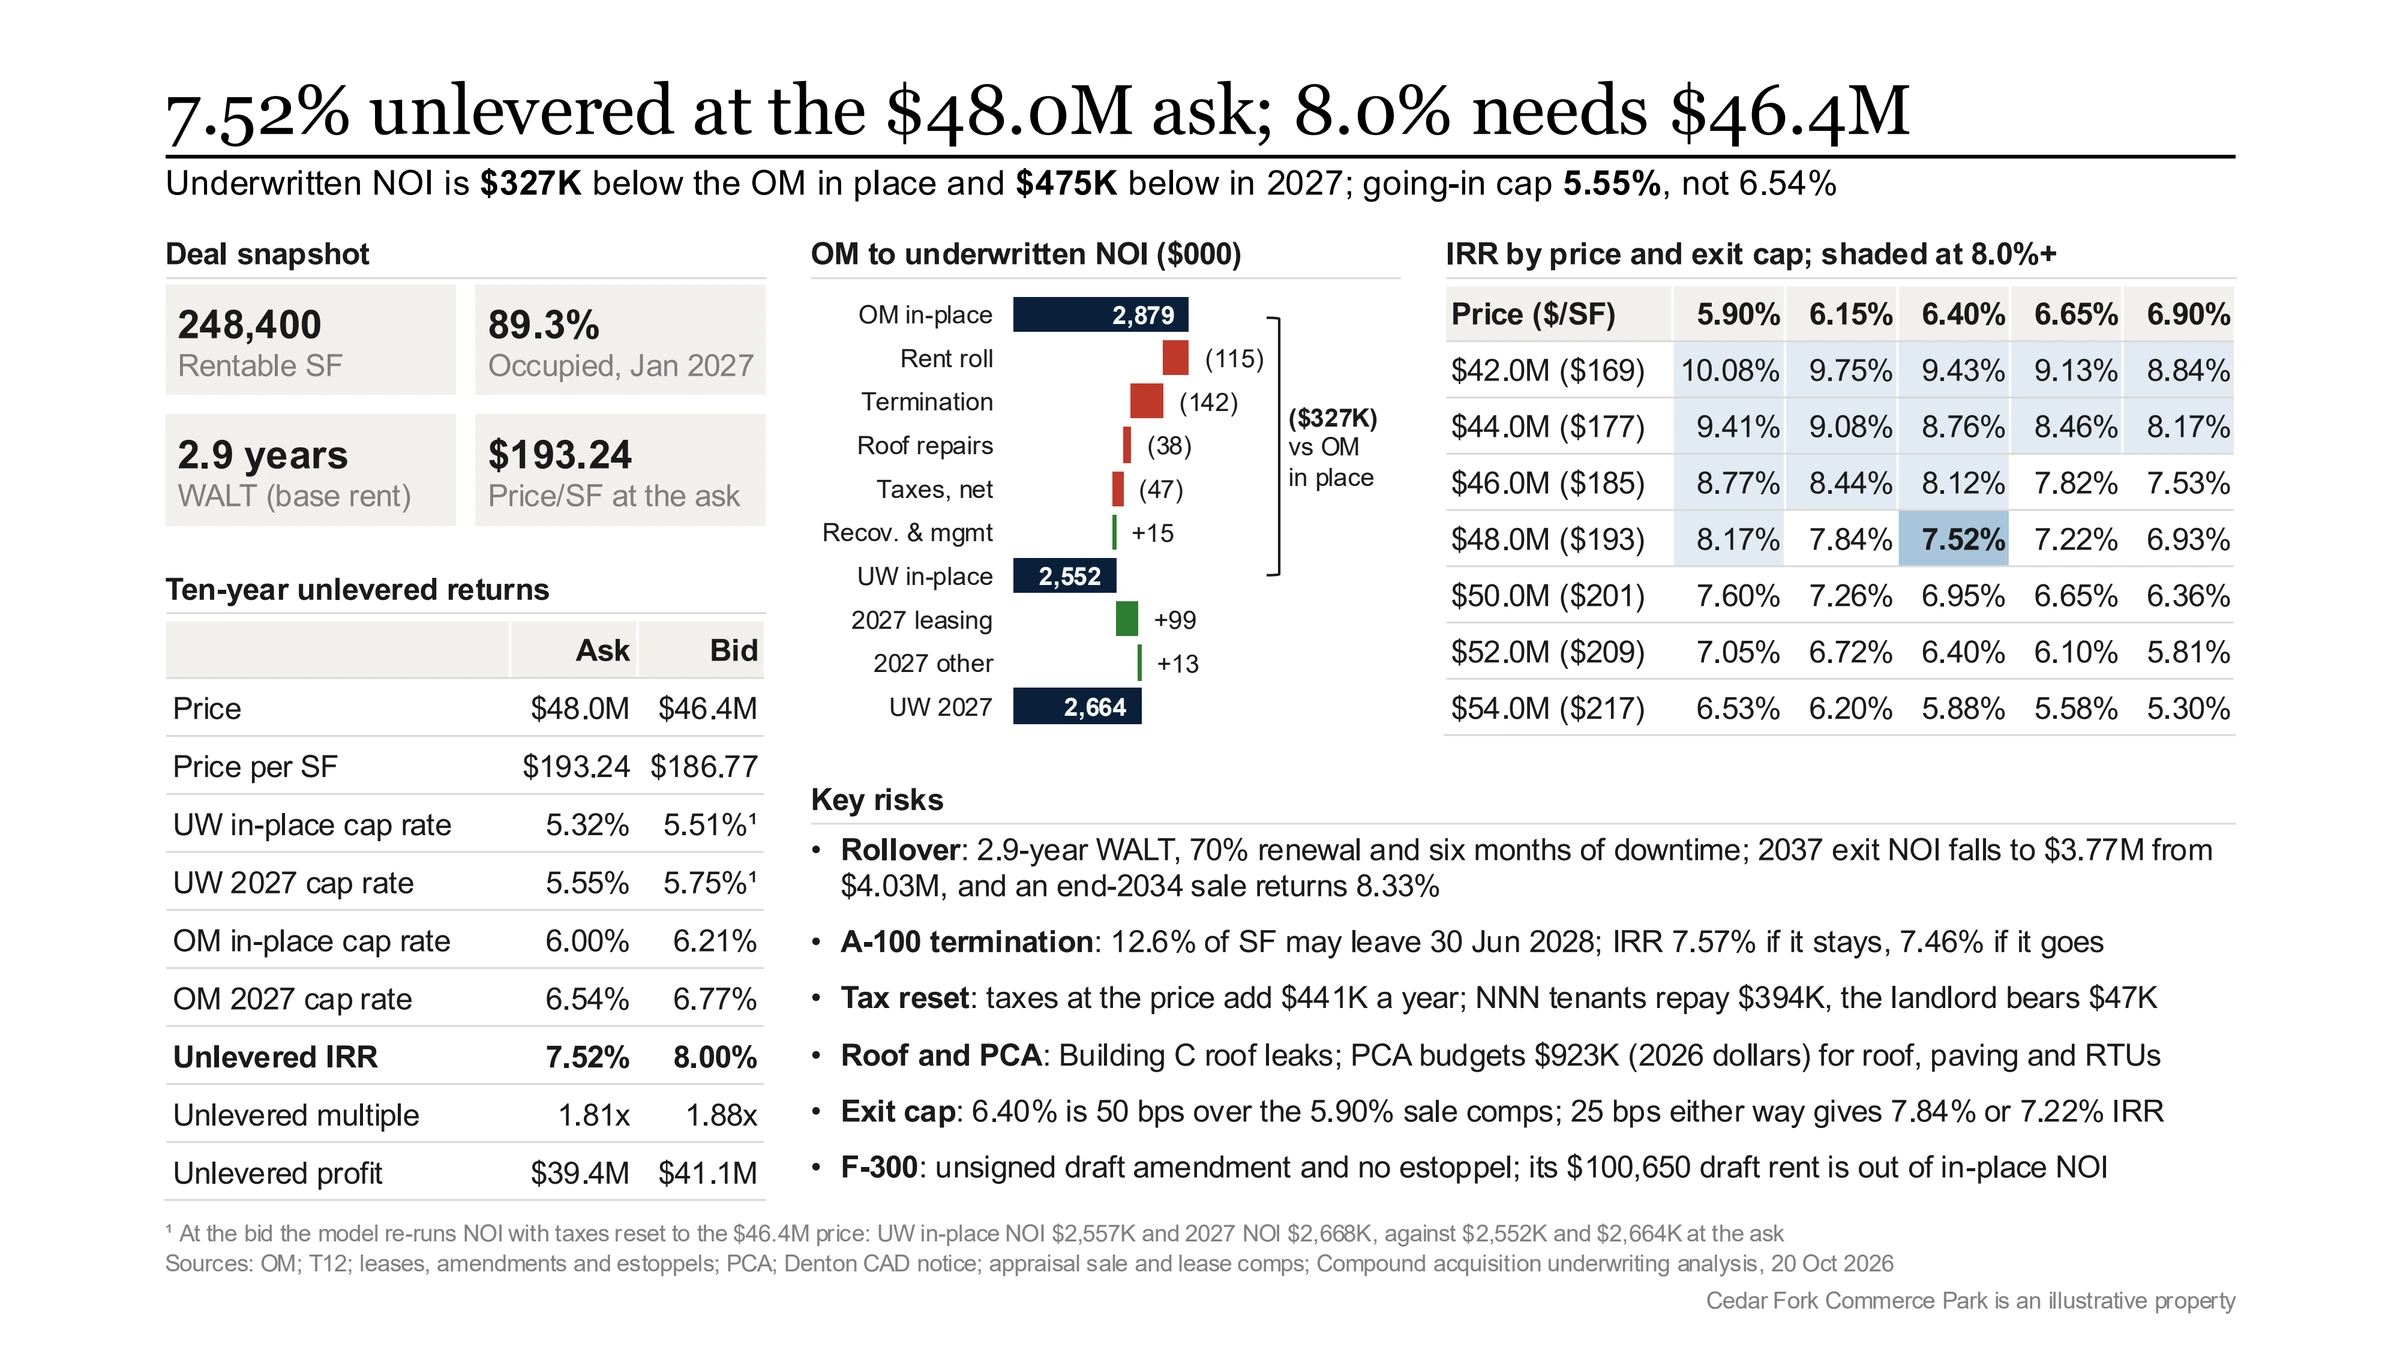
| Line changed | Change | Source |
|---|---|---|
| Base rent | $114,732 a year off in-place NOI | Rent roll, leases, remeasurement letter, unsigned F-300 draft |
| Other income | $142,000 termination fee taken out | GL account 4810 |
| Real estate taxes | $441,000 more expense, $393,953 recovered | Denton CAD notice, leases |
| Rollover and capital | $3,982,483 of capital and leasing costs over the hold | Lease comps, PCA |
Takeaway: bid $46.4M, about $1.6M under the ask, and each line change behind it traces to a document in the room or a labeled assumption.
The model assumes the seller credits C-200’s unfunded $38.5k of TI and $17.3k of B-200’s free rent, the December stub and January 2027, at closing. B-200’s $96k TI allowance needs no credit, because B-200’s estoppel certifies it was paid in full. Still open: F-300’s executed amendment and the C-400 and F-300 estoppels. Those, with the title, survey and environmental findings, are worked in the real estate due diligence checklist.
FAQ
How does NOI differ from EBITDA and net income?
NOI is property-level: revenue less operating expenses, before debt service, capital spending, depreciation, income taxes and owner overhead such as asset management fees. EBITDA is the company-level measure and usually sits after corporate overhead. Net income is after interest, depreciation and taxes. Cap rates are quoted on NOI, which is why a capital-heavy year like Cedar Fork’s 2027 shows NOI of $2.66M but cash flow before debt of only $1.96M.
How does a development pro forma differ from an acquisition model?
A development pro forma starts from a budget instead of a rent roll: land, hard and soft costs, contingency and a construction schedule, funded by monthly draws on a construction loan with interest capitalized until the building leases up. Its key output is the development spread, untrended yield on cost over the cap rate a stabilized buyer would pay. Compound builds development and JV models as well as acquisitions, and the rollover, capital and exit logic on this page carries over once the building stabilizes.
How is multifamily underwriting different?
Multifamily runs on unit mix: unit types, in-place against market rent (loss to lease), concessions, turnover and make-ready cost, with leases rolling every twelve months instead of every five years. Rollover becomes a turnover rate instead of a lease-by-lease schedule. Self storage underwrites like multifamily with shorter tenancy. Hotels underwrite on occupancy, ADR and RevPAR, closer to an operating business.
Can I change the assumptions Compound chose?
Yes. Every buyer judgment (70% renewal, six months of downtime, 3.0% rent growth, commissions, reassessment at 100% of price, A-100’s 50% weight) is a yellow input on the Assumptions sheet or Dashboard with its reason beside it, and the cash flow, returns and sensitivity recalculate. You can also ask Compound in the chat to rerun a case, for example A-100 exercising its termination right, and it reports the change.
What goes from the pro forma into the IC memo?
The bid and how it was reached: the NOI walk from the OM, the going-in and exit cap rates with the comps behind them, the capital plan, the returns at the ask, the price that meets the target and the assumptions an IC should challenge. Compound writes that as a Word memo with each figure cited to the model and the data room. The investment memo page shows the structure.