| B | C | D | E | |
|---|---|---|---|---|
| 5 | IMPLIED VALUE PER SHARE | |||
| 6 | Perpetuity growth | Exit multiple | Headline | |
| 7 | SBC added back (proxy definition) | $24.20 | $44.52 | $24.20 |
| 8 | SBC as cash cost | $19.78 | $41.97 | $19.78 |
| 9 | SBC at $32mm (PJT LBO case) | $22.34 | $43.48 | $22.34 |
| 10 | Compound case (our view) | $14.681 | $34.88 | $14.68 |
| 12 | COMPOUND CASE (OUR VIEW) – RANGE FROM WACC AND GROWTH BANDS | |||
| 13 | Low | Base | High | |
| 14 | Implied value per share ($) | $13.12 | $14.68 | $16.63 |
| 16 | WACC | 11.37% | 10.87% | 10.37% |
| 17 | Perpetuity growth rate | 2.0% | 2.5% | 3.0% |
- 1Compound's stress case, with growth, margin and stock pay cut to the company's record.
Permira and Warburg Pincus agreed on December 20, 2025 to take Clearwater Analytics (NYSE: CWAN) private at $24.55 a share: $8.4 billion of enterprise value, 24.9x management’s 2026 adjusted EBITDA and 47% above the $16.69 unaffected price. The special committee’s bankers, PJT Partners and J.P. Morgan, both ran DCFs on management’s projections, and both supported the price.
We gave Compound the merger proxy, the fairness opinions, the filings and the earnings calls, and asked for its own value. Every spreadsheet and slide below is from that one run, unedited except for excerpts.
How to build a DCF model from a merger proxy
Management’s projections are in the merger proxy. The bankers’ decks fill in the rest.
“Build a DCF of [company] in Excel from its merger proxy and filings, citing every figure. Value it on management's plan, then set your own base case with a reason for each change, give a value per share with a range, and lay it out as a one-page DCF like a fairness opinion.”
Printed pages 68 and 69 of the DEFM14A give revenue from $730 million in 2025 to $1,807 million in 2030, adjusted EBITDA from $248 million to $763 million, and stock-based compensation flat at $127 million a year. Compound found the depreciation, capex and working capital lines in PJT’s deck and tied the model’s free cash flow to the proxy’s own figure, within $1.5 million in every year.
A DCF discounts unlevered free cash flow: EBIT less tax, plus D&A, less capex and the change in working capital. It leaves out interest, because the discount rate already prices the debt.
| B | D | E | F | G | H | M | |
|---|---|---|---|---|---|---|---|
| 5 | 2026E | 2027E | 2028E | 2029E | 2030E | 2035E | |
| 29 | Revenue ($M) | 940 | 1,100 | 1,298 | 1,531 | 1,8071 | 3,009 |
| 36 | UNLEVERED FCF – SBC AS CASH COST | ||||||
| 37 | Adj. EBITDA (pre-SBC) | 338 | 418 | 518 | 634 | 763 | 1,324 |
| 38 | (−) SBC | (127) | (127) | (127) | (127) | (127) | (127) |
| 39 | (−) Depreciation (P&E) | (13) | (11) | (14) | (17) | (21) | (44) |
| 40 | Adj. EBIT (post-SBC) ($M) | 198 | 280 | 377 | 490 | 615 | 1,153 |
| 41 | (−) Cash taxes on EBIT | (50) | (70) | (94) | (123) | (154) | (288) |
| 42 | (−) Other taxes | (2) | (2) | (2) | (2) | (2) | (2) |
| 43 | NOPAT, excl. tax attributes ($M) | 147 | 208 | 281 | 366 | 459 | 863 |
| 44 | (+) Depreciation (P&E) | 13 | 11 | 14 | 17 | 21 | 44 |
| 45 | (+) Amortization of contract acquisition costs | 13 | 16 | 19 | 22 | 27 | 47 |
| 46 | (−) Capex | (21) | (16) | (19) | (23) | (27) | (45) |
| 47 | (−) Change in NWC | (19) | (22) | (26) | (31) | (36) | (60) |
| 48 | Unlevered FCF – SBC as cash cost ($M) | 133 | 197 | 269 | 351 | 444 | 849 |
- 12030 revenue still grows 18%.
Unlevered free cash flow and stock-based compensation
On management’s own plan, the DCF gives $19.78 a share once stock pay counts as a cost.
Clearwater’s $127 million of stock pay is 17.4% of 2025 revenue. Shareholders pay for it through dilution, and a sponsor taking the company private has to replace it with cash or an equity pool. The proxy’s free cash flow treats stock pay as a cash cost, which gives $19.78. Adding it back, as the proxy’s second, pre-SBC version does, gives $24.20. PJT’s LBO case, which cuts stock pay to $32 million, gives $22.34.
Compound’s stress case: $14.68 a share
Compound’s stress case trims management’s plan in three places, each tied to the company’s record.
| B | C | D | |
|---|---|---|---|
| 19 | Value walk, perpetuity growth ($ per share) | Value | Change |
| 20 | Management plan, SBC as cash cost | $19.78 | |
| 21 | (−) Revenue growth cut, 2028E onward | $17.23 | ($2.54) |
| 22 | (−) Adj. EBITDA margin cut | $16.70 | ($0.54) |
| 23 | (−) SBC at 2026 guidance, rising with revenue | $14.681 | ($2.02) |
- 1Compound's case.
- Revenue growth. 2026 and 2027 stay at plan, because Wall Street was at or above it. From 2028, growth is 2 points a year below plan. The plan needs 18% a year. Organic recurring revenue grew 17% in the year to September 2025, core growth slowed from 23% to 17% during 2025, and the Enfusion business was guided to 12%.
- Margins. Adjusted EBITDA margin is half a point below plan in 2026 and a point below after that, about half of the Street’s gap to the plan. Management has kept its margin promises better than its growth promises.
- Stock pay. $137.5 million in 2026, the midpoint of the $135 to $140 million management gave at its September 2025 investor day, against the plan’s $127 million, then rising at half the rate of revenue.
The discount rate and terminal growth stay at 10.87% and 2.5%. Moving each by half a point gives a range of $13.12 to $16.63. Compound laid the result out the way a bank lays out a DCF in a fairness opinion.
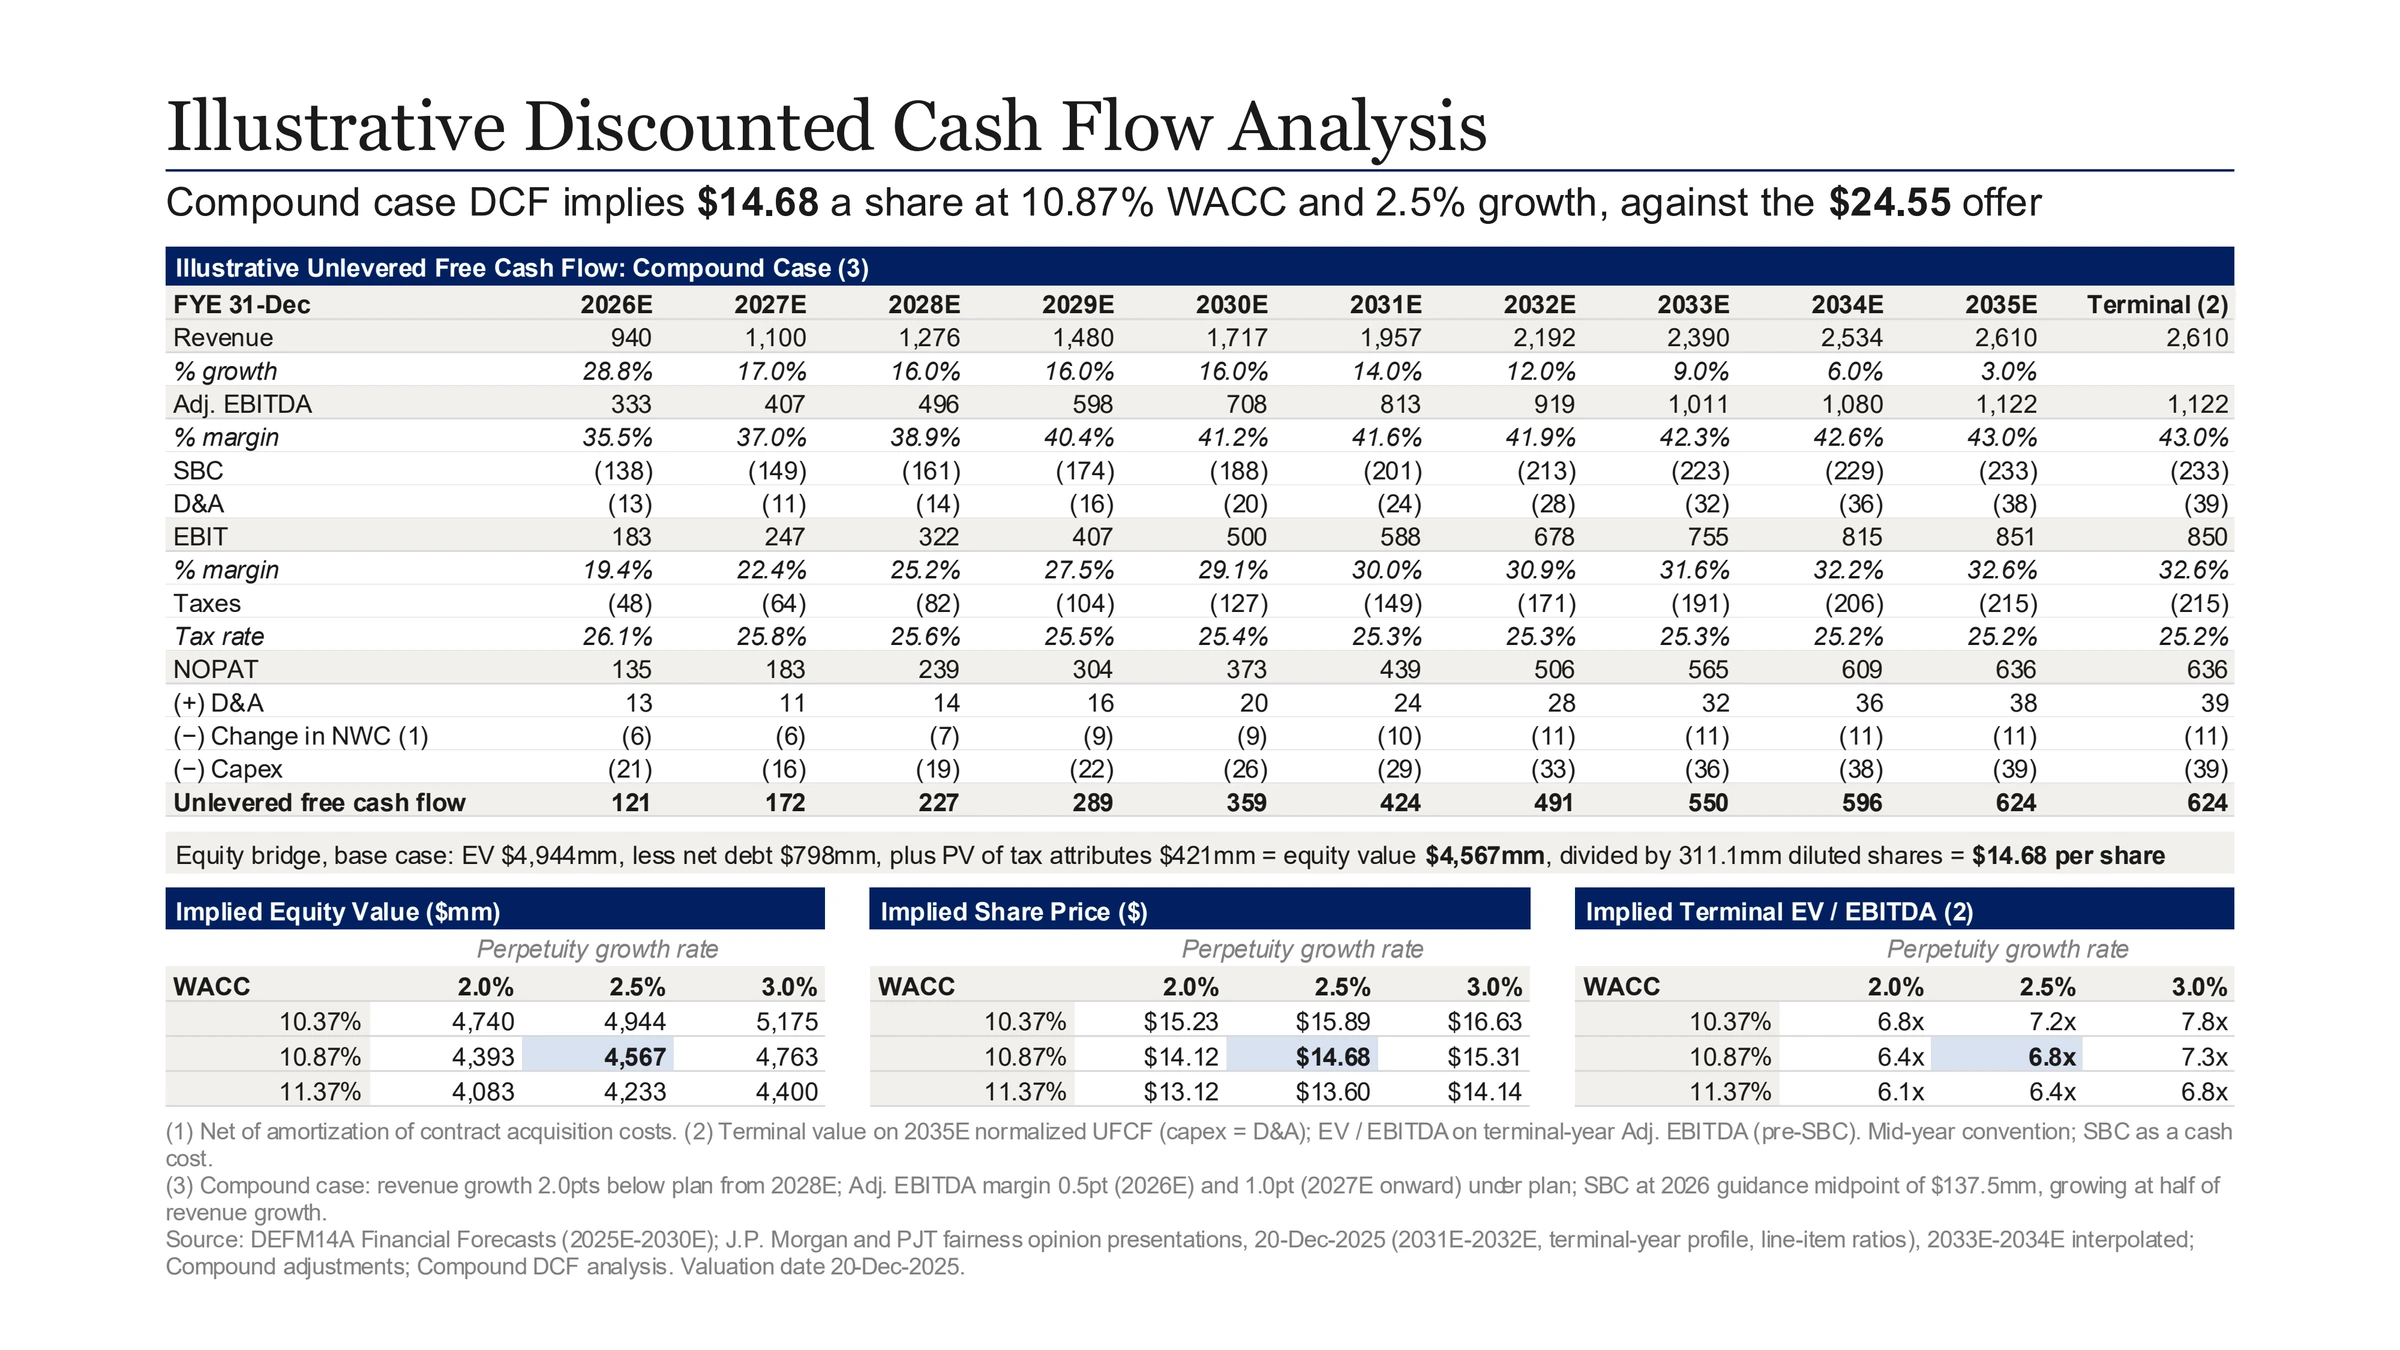
At $14.68, the stress case sits 12% below the $16.69 the stock traded at before any bid, so the market was already pricing in more growth than the case allows.
Rebuilding the bankers’ DCFs from the fairness opinions
Both banks’ DCFs reach the offer only by assuming Clearwater grows 5% to 6% a year, forever.
PJT used a 10.5% discount rate and 6.0% perpetual growth. J.P. Morgan used 9.75% and 5.0%. Compound’s rebuild lands within four cents and one cent of their reported values. The last column runs PJT’s model at a conventional 2.5%.
| B | D | E | G | |
|---|---|---|---|---|
| 6 | PJT (deck p.26) | J.P. Morgan (deck p.6) | PJT basis, this WACC and g | |
| 8 | WACC | 10.50% | 9.75% | 10.87% |
| 9 | Terminal growth | 6.0% | 5.0% | 2.5% |
| 12 | Sum of PV of UFCF, 2026E-30E | 1,036 | 1,056 | 1,026 |
| 14 | PV of terminal value (mid-year) | 6,688 | 6,912 | 3,424 |
| 15 | Enterprise value ($M) | 7,724 | 7,968 | 4,450 |
| 18 | Equity value ($M) | 7,376 | 7,632 | 4,096 |
| 20 | Value per share ($) | $23.71 | $24.53 | $13.171 |
| 21 | Reported value per share ($) | $23.75 | $24.54 |
- 1Below the $16.69 unaffected price.
At 2.5%, the bankers’ own model values Clearwater below where it traded before anyone bid. The high growth rate has a reason: the plan still grows revenue 18% in 2030, and dropping straight from 18% to 2.5% understates value. Compound’s model runs the forecast to 2035 instead, using management’s own extrapolations in J.P. Morgan’s deck, so growth is down to 3% to 5% before the terminal value starts.
WACC formula and CAPM: the discount rate, row by row
The discount rate comes out at 10.87%, using the same peer companies as PJT.
The weighted average cost of capital (WACC) weights the cost of equity and the after-tax cost of debt by their shares of market value: E/(D+E) × cost of equity + D/(D+E) × cost of debt × (1 − tax rate). CAPM gives the cost of equity as risk-free rate + beta × equity risk premium. Compound unlevered the betas of PJT’s 11 peers and relevered the median at Clearwater’s own debt.
| B | C | D | E | F | |
|---|---|---|---|---|---|
| 6 | Company | Group | Debt / equity | Levered beta | Unlevered beta |
| 7 | SS&C Technologies | Financial services vertical | 34.0% | 0.826 | 0.658 |
| 8 | Guidewire | Financial services vertical | 3.9% | 0.887 | 0.862 |
| 9 | CCC Intelligent Solutions | Financial services vertical | 19.4% | 0.958 | 0.836 |
| 10 | Q2 Holdings | Financial services vertical | 9.9% | 1.257 | 1.170 |
| 11 | Intapp | Financial services vertical | 0.0% | 1.469 | 1.469 |
| 12 | nCino | Financial services vertical | 8.3% | 1.249 | 1.176 |
| 13 | Alkami Technology | Financial services vertical | 14.5% | 1.174 | 1.059 |
| 14 | Veeva Systems | Other vertical software | 0.0% | 1.018 | 1.018 |
| 15 | Tyler Technologies | Other vertical software | 3.0% | 0.714 | 0.698 |
| 16 | Vertex | Other vertical software | 10.5% | 1.468 | 1.361 |
| 17 | Procore Technologies | Other vertical software | 0.2% | 1.015 | 1.013 |
| 18 | Peer median | 8.3% | 1.018 | 1.018 | |
| 25 | Clearwater, relevered | 16.6% | 1.1451 |
- 1Twice the peer median's leverage, so a higher beta.
Unlevering strips each peer’s debt out of its beta: unlevered beta = levered beta ÷ (1 + (1 − tax rate) × debt/equity), at a 25% tax rate. The peers’ asset betas run from 0.66 for SS&C to 1.47 for Intapp, and the median is 1.018. Clearwater carried $859 million of debt against $5.2 billion of equity at the unaffected price, a 16.6% debt-to-equity ratio, twice the peer median’s 8.3%. Relevering at that ratio puts more of the business risk on the shareholders, which lifts its beta to 1.145. Picking the mean instead of the median would move the unlevered beta to 1.029 and the discount rate by less than a tenth of a point, so the peer choice is not what drives the value.
| B | C | H | |
|---|---|---|---|
| 22 | Unlevered beta, peer median | 1.018 | |
| 25 | Debt / equity | 16.6% | |
| 27 | Relevered beta | 1.145 | |
| 28 | Risk-free rate, 20-yr UST, 19-Dec-25 | 4.77% | PJT fairness deck p.32 |
| 29 | Equity risk premium, historical supply-side | 6.26% | PJT fairness deck p.32 |
| 30 | Cost of equity | 11.94% | |
| 36 | Pre-tax cost of debt (SOFR + margin) | 5.95% | |
| 37 | After-tax cost of debt | 4.46% | |
| 41 | Equity / total capital | 85.8% | |
| 42 | Debt / total capital | 14.2% | |
| 43 | WACC | 10.87%1 |
- 1No size premium. Adding PJT's 0.74% gives 11.51%, which matches PJT's peer WACC.
The weights use Clearwater’s debt before the deal. The $3.5 billion of private credit that financed the buyout belongs in the LBO, where it earns the sponsor’s return.
Terminal value: Gordon growth against the exit multiple
The two methods give very different answers, and only one of them holds up.
The Gordon growth method values the years after 2035 as next year’s free cash flow ÷ (WACC − growth). On the Compound case at 2.5%, that is 6.8x 2035 EBITDA. The exit multiple method uses what peers trade at today, 21.8x, which gives $34.88 a share. But a business growing 3% in its final forecast year will not trade at today’s growth multiple in 2035, so Compound uses perpetual growth for its value.
The choice matters because the terminal value is most of the answer. On management’s plan with stock pay as a cost, perpetual growth at 2.5% puts 60% of enterprise value in the years after 2035, at an implied 7.9x 2035 EBITDA. Swapping in the 21.8x exit multiple lifts that share to 80% and the value to $41.97 a share. Read backwards, a 21.8x exit is the same as assuming 7.7% growth forever.
That is why the two methods should check each other. An exit multiple that implies growth well above the economy needs a reason, such as a buyer in 2035 paying for growth that is still to come. A perpetuity rate that implies a multiple far below comparable deals needs one too. The bankers’ five-year models lean harder on the end: PJT’s terminal value is 87% of its enterprise value, because its forecast stops in 2030 while revenue still grows 18%.
Reverse DCF: what the $24.55 offer needs
On management’s own plan, the offer needs at least one of these assumptions.
With stock pay as a cost and everything else on management’s plan, $24.55 needs one of:
- 4.69% perpetual growth, above the roughly 4% ceiling of long-run nominal GDP
- a 10.8x exit multiple on 2035 EBITDA, half today’s peer median
- a 51.2% EBITDA margin in 2030, against management’s 42.2%
- 3.2 points more revenue growth a year from 2028
- a 9.56% WACC, against 10.87%
What the DCF says about the $24.55 price
At $24.55, the price rests on the years after 2035.
The deal closed on June 25, 2026 at $24.55. At 2.5% perpetual growth, management’s plan supports $19.78 a share and Compound’s case $14.68. The offer needs 4.69% growth forever or a 10.8x exit multiple on 2035 EBITDA. A DCF at these assumptions does not show the buyers overpaid. It shows what the price needs. The difference is a bet on growth: that Clearwater keeps growing faster than the economy for good, or sells again at a growth multiple. Permira and Warburg Pincus co-owned Clearwater with Welsh Carson before its IPO and know the business. The DCF shows how much of the price rests on that conviction.