| D | E | F | G | |
|---|---|---|---|---|
| 6 | Views | Claim on X | What the S-1 shows | Verdict |
| 7 | 237,327 | Positive free cash flow of $6.7B from 2023 to June 2026 | Free cash flow over the period sums to about ($6.7B): a burn | Sign wrong1 |
| 8 | 734,058 | H1 2026 revenue of $16.3B with a net loss of $80.7B | Both match, but $72.4B of the loss is a non-cash fair-value charge; the operating loss was $693M | Incomplete2 |
| 9 | 90,877 | About $245B of future minimum compute payments | $245B is only what was signed after 30 Jun 2026; minimums at 30 Jun were $265.6B | Understated |
| 13 | 8,859 | 2025 net loss of about $42B on revenue of $4.6B | 2025 net loss was $42.0B and revenue $4.6B | Accurate |
| 14 | 4,837 | $1 of compute now gives $2.08 of revenue | Q2'26 revenue of $11.6B over compute of $5.6B is 2.08x | Accurate |
| 15 | 10,029 | Valuation of $1.5T to $2T | Not in the filing: the price range and share count are blank | Not in the S-1 |
- 1Operating cash flow less capex, FY23 to H1'26: (1,629) + (5,707) + (2,768) + 3,447 = ($6,657M).
- 2The day's most-viewed post. 129 of the 165 posts quoting the loss explained it; this one did not.
Anthropic filed its S-1 for a Nasdaq listing at about 9:00 a.m. Eastern on October 26, 2026. By 9:26 a markets account with 2.7 million followers had posted an eight-point summary that would draw 734,000 views by the afternoon. It led with “a net loss of $80.7 billion.” It did not say that $72.4 billion of that loss was a non-cash charge on convertible notes, or that the operating loss for the half was $693 million.
That gap is the reason to do Twitter research properly. X is where the first read of a filing, an earnings call or a deal forms, and the first read moves prices before anyone has finished the document. Three questions matter: which takes are reaching people, which of them are right, and what the filing says that nobody on X has said yet.
We gave Compound one request at 1:27 p.m. Pacific, with the S-1 workbook an earlier task had built from the filing on the same agent. Twenty-nine minutes later it returned a 13-slide deck and a workbook of 453 posts: every post ranked by views, tagged by theme and sentiment, the most-viewed claims checked line by line against the S-1, and five angles in the filing that X had barely raised.
Every X post on the filing, ranked by views
Compound searched X for every post about the S-1 from 08:08 to 16:26 Eastern and kept the 453 it found.
“Search X for every post about [company]'s [S-1, earnings, deal] since [time]. Rank the posts by views, tag each by theme and sentiment, check the most-viewed claims against [the filing], and build a deck on the conversation, backed by a workbook of every post with its link.”
Compound searches every public post on X, and the posts of a roster of finance and news accounts, by keyword, account and date. Each post comes back with its views, likes, reposts, quotes and replies, the author’s follower count, and any links, which Compound opens when a post points to the story rather than telling it. The Posts tab lists all 453, sorted by views, with a link to each.
| C | E | F | G | H | J | K | |
|---|---|---|---|---|---|---|---|
| 5 | Posted (ET) | Followers | Views | Likes | Reposts | Sentiment | Primary theme |
| 6 | 9:26 | 2,698,937 | 734,0581 | 6,272 | 541 | Neutral / summary | Full filing summaries |
| 7 | 9:08 | 205,432 | 271,032 | 1,840 | 186 | Neutral / summary | Full filing summaries |
| 8 | 12:11 | 488,041 | 237,327 | 2,783 | 75 | Bullish | Profitability and compute efficiency |
| 9 | 10:03 | 268,871 | 90,877 | 759 | 125 | Bearish | Full filing summaries |
| 10 | 10:05 | 34,070 | 79,445 | 913 | 50 | Bullish | Valuation and bubble debate |
| 11 | 9:05 | 31,269 | 51,876 | 40 | 10 | Neutral / summary | Full filing summaries |
| 12 | 12:27 | 566,313 | 50,417 | 393 | 33 | Bearish | Risk factors and AI safety |
| 13 | 10:34 | 1,619,5892 | 33,592 | 237 | 9 | Neutral / summary | Pre-IPO trading and odds |
- 138% of the day's views on one post.
- 2The second-largest following in the top eight drew 34K views: followers do not predict reach.
Reach was concentrated. The three most-viewed posts took 1.24 million of the 1.93 million views, 64%. Two of them were full summaries of the filing posted within half an hour of it, and the third, three hours later, was a bullish read on cash flow. Below the top ten, no post passed 25,000 views. Follower counts did not predict reach: an account with 1.6 million followers drew 34,000 views, and one with 34,000 followers drew 79,000.
Most posts said nothing new. 78% of the 453 were neutral recaps of the headline numbers, and 418 were original posts rather than replies. For a reader trying to learn what the market thinks, that is the first finding: a day of X on a major filing is a handful of summaries, retold.
By hand
In Compound
X sentiment analysis: bulls out-drew bears two to one
Compound tagged every post bullish, bearish, mixed or neutral, and gave each a primary theme and as many theme tags as it carried.
A sentiment score for a whole day of X is a number nobody can check. Compound’s tagging is in the workbook, post by post, so an analyst can disagree with one label and see what it changes. The rules were keyword-based across all 453 posts, and Compound read and labeled the roughly 40 most-viewed posts itself, which together carry most of the views.
| B | D | E | F | G | |
|---|---|---|---|---|---|
| 42 | Sentiment | Posts | % of posts | Views | % of views |
| 43 | Bullish | 29 | 6.4% | 372,950 | 19.4% |
| 44 | Bearish | 551 | 12.1% | 191,930 | 10.0% |
| 45 | Mixed | 15 | 3.3% | 58,431 | 3.0% |
| 46 | Neutral / summary | 354 | 78.1% | 1,303,422 | 67.7% |
| 47 | Total | 453 | 100.0% | 1,926,733 | 100.0% |
| 48 | Bullish to bearish, by views (x) | 1.94x |
- 1Bears posted almost twice as often as bulls and drew half the views.
Bears posted more and reached fewer. 55 bearish posts drew 10% of the views; 29 bullish posts drew 19%. The bearish case leaned on the loss, the size of the compute bill and a valuation the filing does not contain. The bullish case leaned on growth and on cash flow, and its most-viewed post had the sign of free cash flow wrong, which the fact check below takes up.
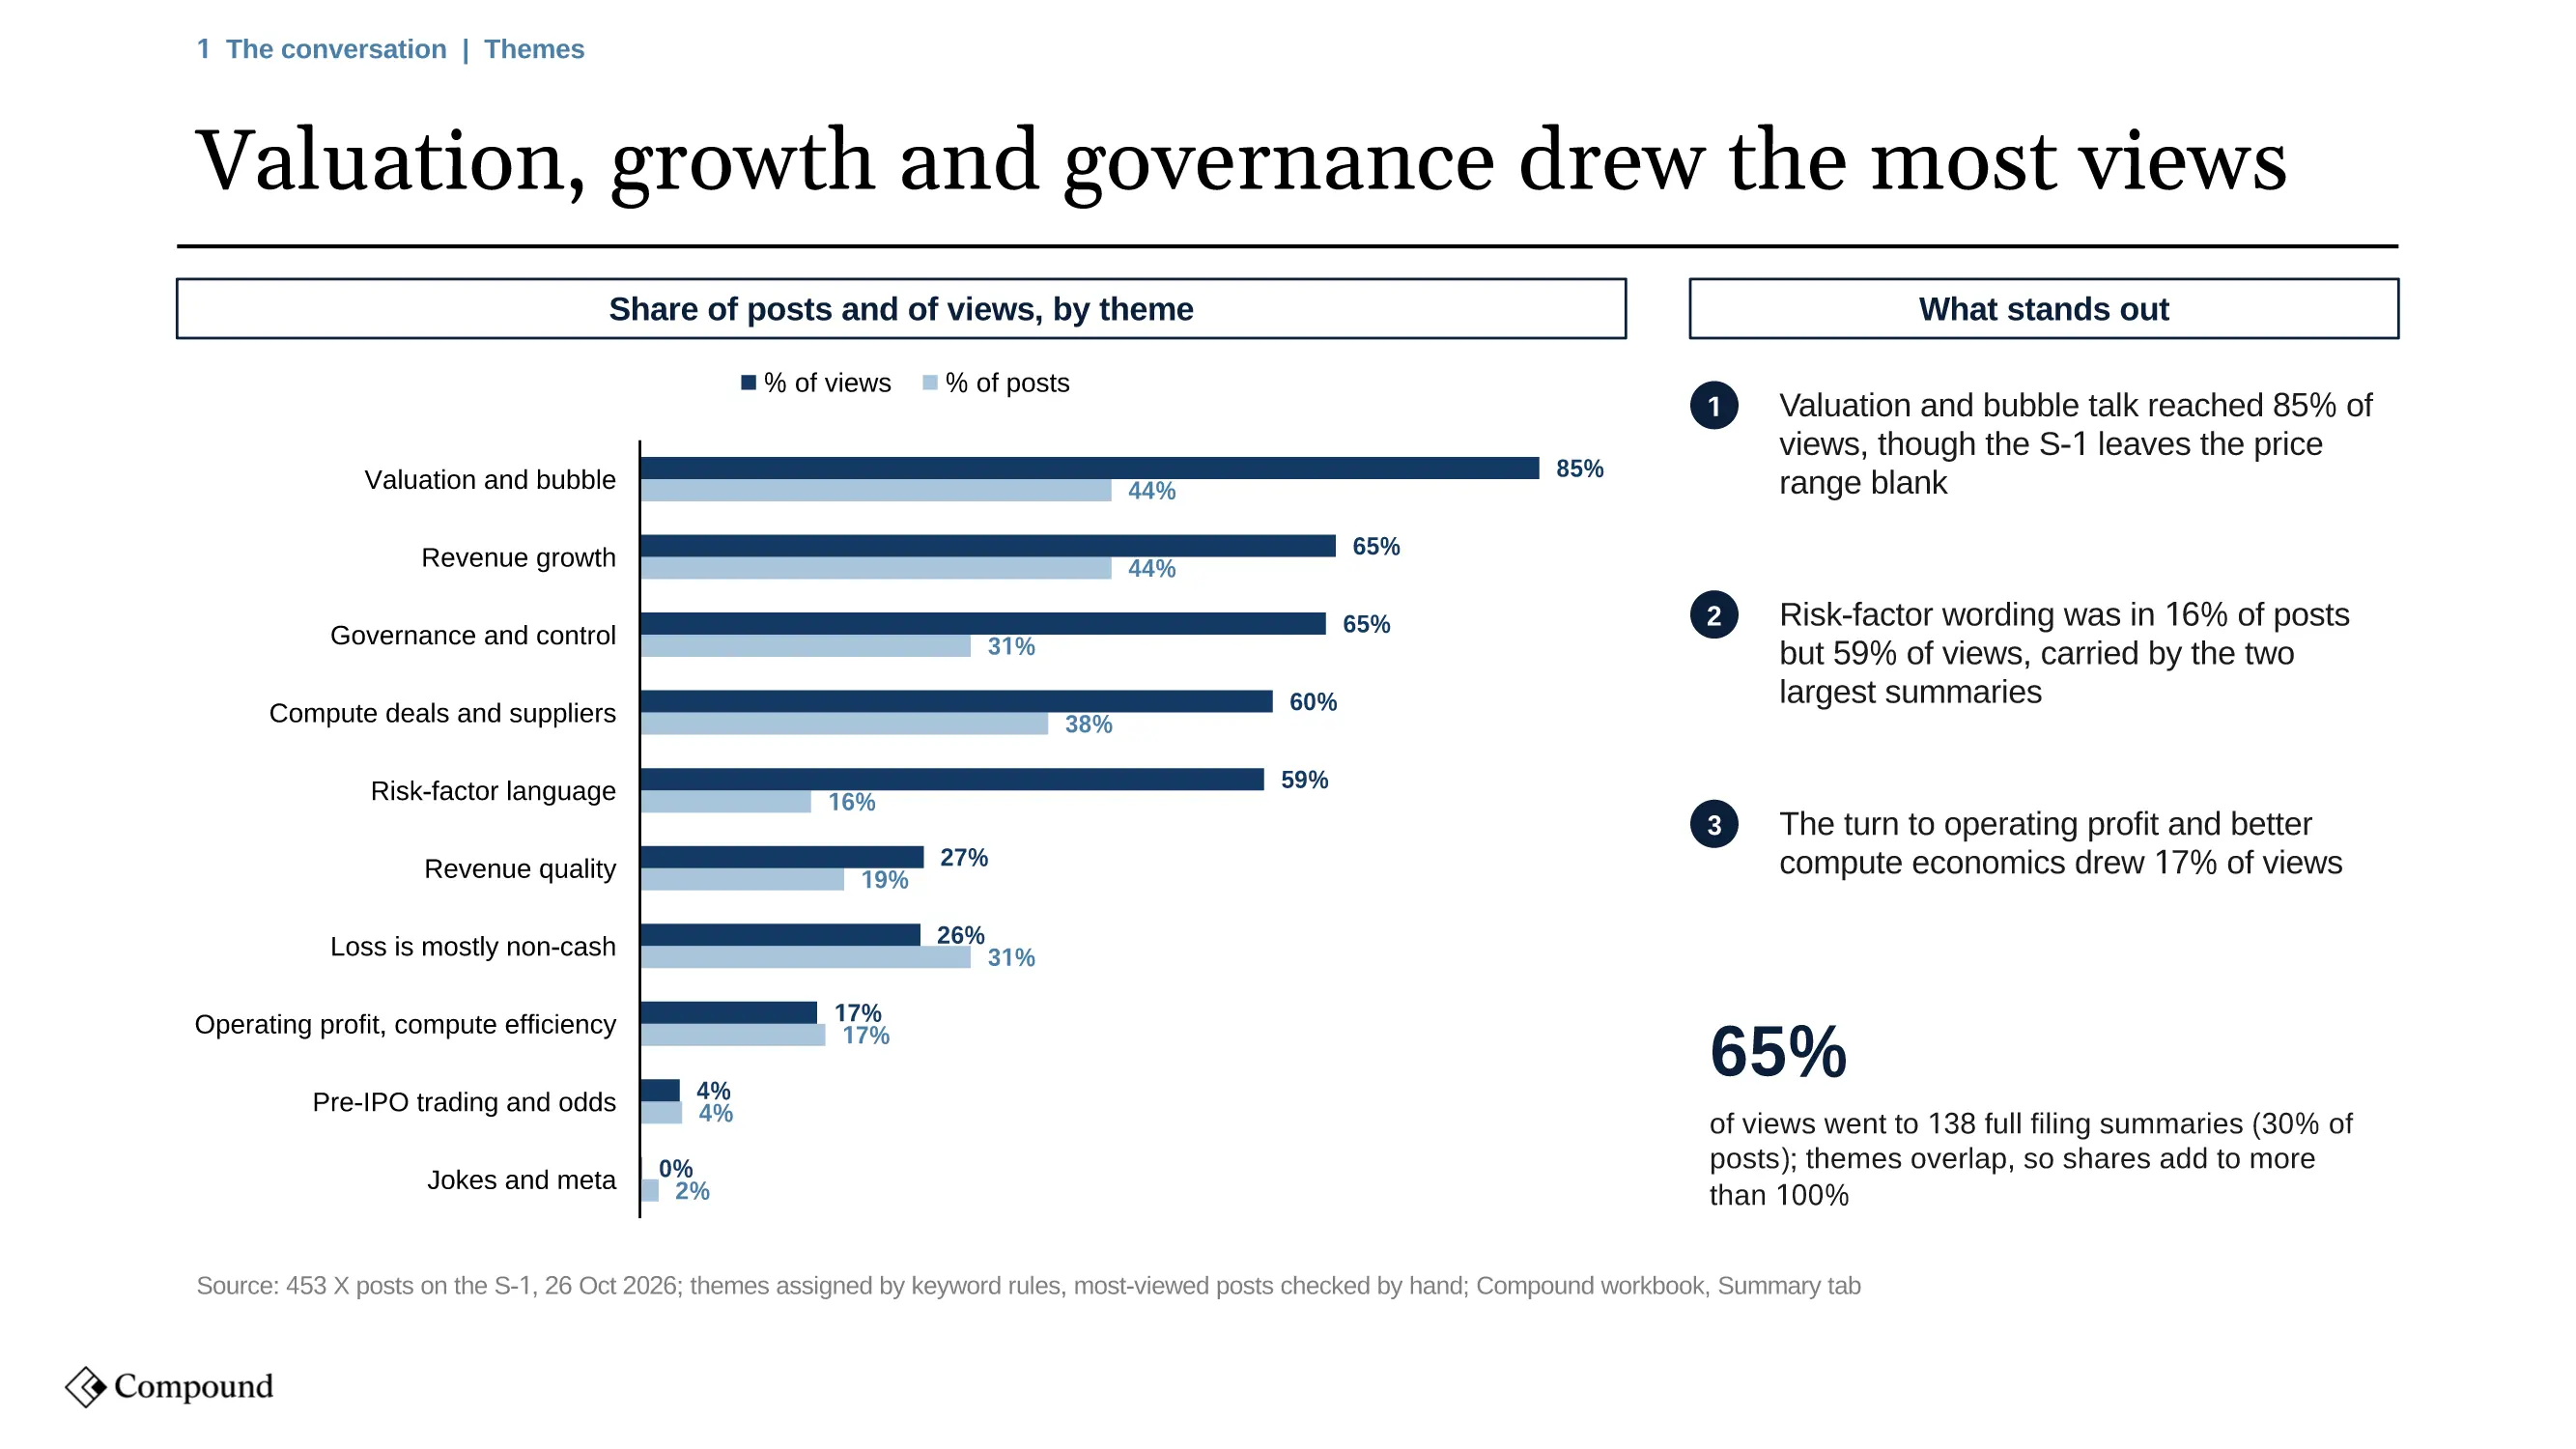
The theme split says what X was pricing. Valuation and bubble talk reached 85% of the day’s views, though the S-1 leaves the price range blank. Risk-factor wording appeared in 16% of posts and 59% of views, because both of the two largest summaries quoted it. The company’s turn to an operating profit drew 17% of views. The question for anyone using X as a read on the stock is whether the headline numbers people saw were the right ones.
Anthropic’s $80.7 billion net loss, explained
Most posts that quoted the loss explained it. Most views landed on a post that did not.
The S-1 reports a first-half net loss of $80.7 billion. Of that, $72.4 billion, 90%, is a change in the fair value of convertible notes, derivatives and SAFEs: a non-cash mark on the company’s own rising valuation. The operating loss was $693 million, and the second quarter was the company’s first with an operating profit, $974 million.
165
posts quoted the $80.7B net loss
78%
of them said it was mostly non-cash
39%
of their views landed on a post that said so
129 of the 165 posts that quoted the loss said most of it was a non-cash charge. They drew 495,000 of the 1.26 million views on loss posts. The day’s largest post, at 734,000 views, quoted the loss without the explanation, and that one post outweighed the 129 that got it right.
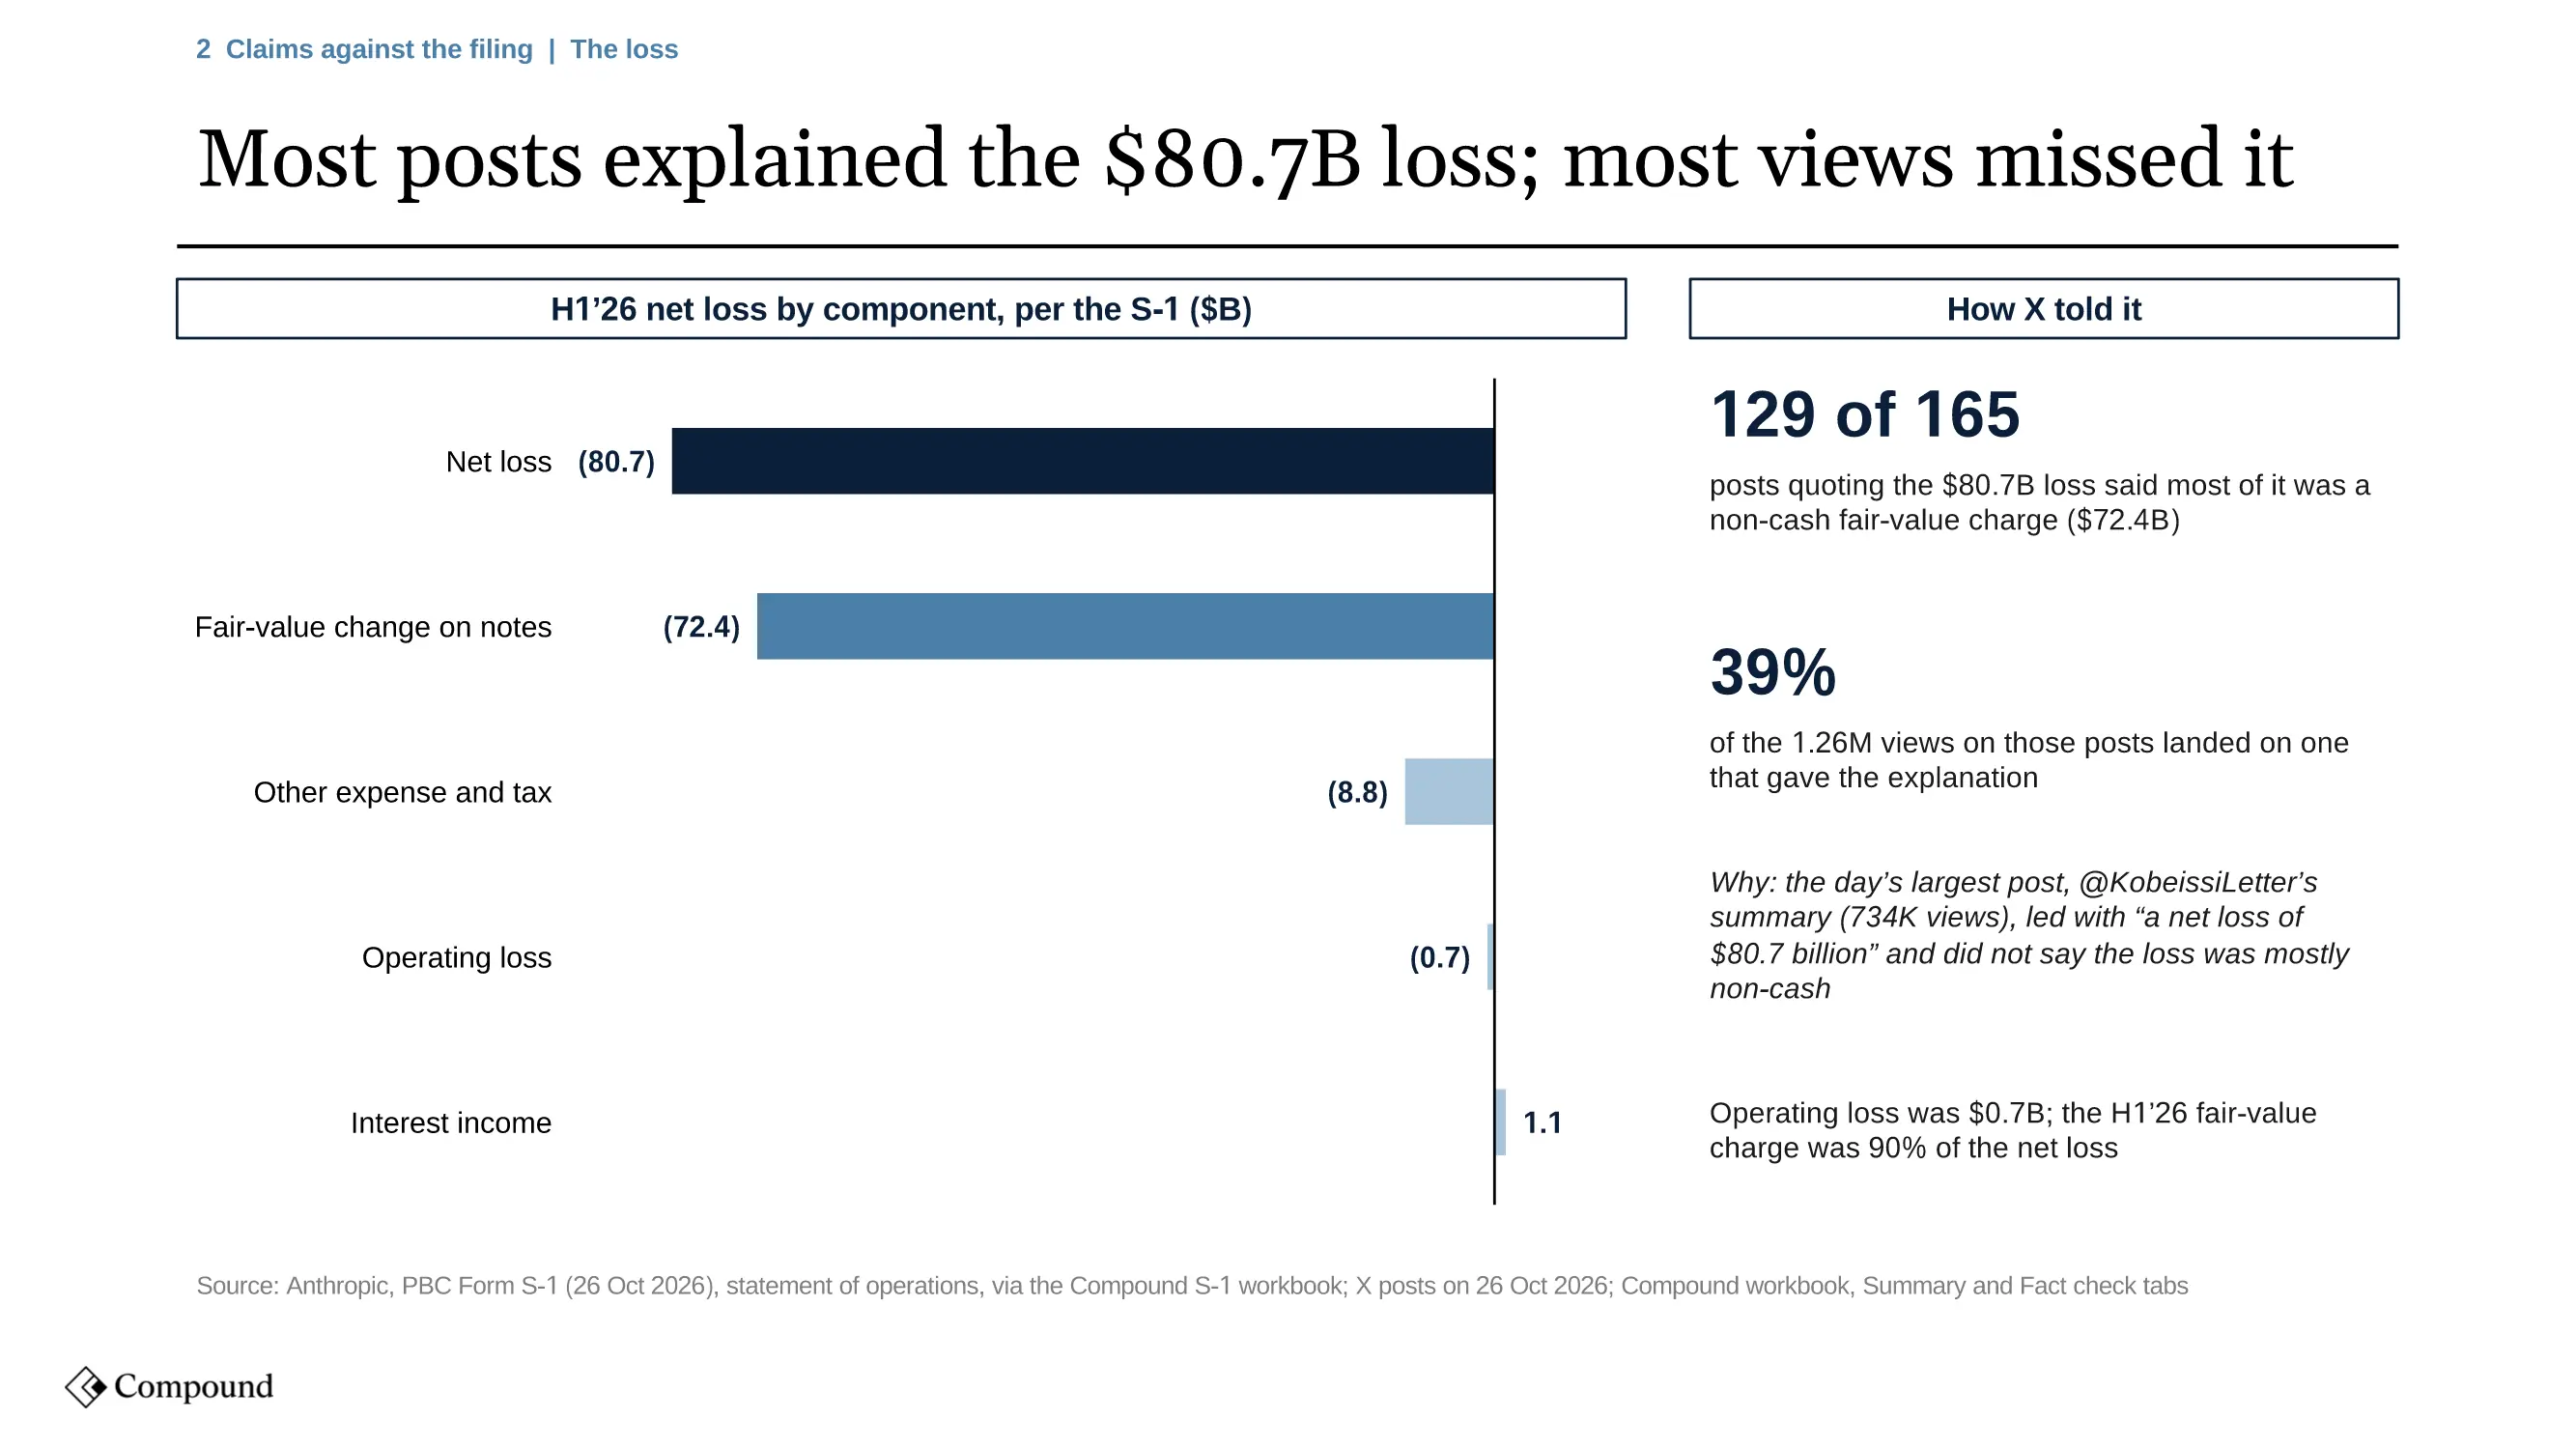
The same pattern ran through the figures people shared. Posts quoting the “catastrophic or existential risks” wording from the risk factors drew 1.12 million views. Posts citing the $974 million operating profit drew 26,000, a ratio of 42 to 1.
Views on posts citing each figure from the S-1
A post can cite several figures; views as read at collection
Source: 453 X posts on the Anthropic S-1, October 26, 2026. Compound's Summary tab.
Anthropic S-1 fact check: nine viral claims on X
Compound checked the most-viewed and most-repeated claims against the filing. Two of nine were fully accurate.
The check is only as good as the numbers it is checked against. Compound used the S-1 workbook an earlier task on the same agent had built from the filing, in which every figure links to the statement it came from. Each verdict on the Fact check tab names the figure and the arithmetic, so the team can redo it in the workbook.
The claim that mattered most was the bullish one. A post with 237,000 views said Anthropic had “positive free cash flow of $6.7B” from 2023 to June 2026. Free cash flow over that period, operating cash flow less purchases of property and equipment, sums to a burn of $6.7 billion.
| B | C | D | E | F | G | |
|---|---|---|---|---|---|---|
| 19 | ($M) | FY23 | FY24 | FY25 | H1'26 | Total |
| 20 | Net cash from operating activities | (1,627) | (5,692) | (2,637) | 3,929 | (6,027) |
| 21 | Purchases of property and equipment | (2) | (15) | (131) | (482) | (630) |
| 22 | Free cash flow | (1,629) | (5,707) | (2,768) | 3,447 | (6,657)1 |
| 23 | H1'26 free cash flow per month | 574.52 |
- 1The post's $6.7B, with the sign reversed.
- 2The post's $575M a month is right: it is the first half of 2026 alone.
The post’s second number, $575 million a month, was right; it is the first half of 2026 on its own. Its total had the sign reversed. The other verdicts follow the same pattern: true figures with the context cut off, and confident figures that were never in the filing.
The compute bill
$245B vs $265.6B
The valuation
Not in the S-1
The multiple
435x vs 327x
The cause of the loss
$0.5B of capex
Numbers also drifted as they were retold. The compute bill appeared in posts at five different figures, from $245 billion to $637 billion. Each is a real number in the S-1 on a different basis. Compound matched each to its basis, and added the one total no post quoted: $657 billion across all eight named deals.
| Figure quoted on X | Posts | What it is in the S-1 |
|---|---|---|
| $245B | 5 | New minimum obligations signed after June 30, 2026 only |
| $265.6B | 13 | Fixed or minimum compute commitments at June 30, 2026 |
| $269.4B | 2 | The Google, Amazon and Microsoft minimums added together |
| $500B+ to $531.6B | 16 | June 30 minimums plus the $245B and $21B of minimums signed since |
| $637B | 6 | The named deals, excluding AMD |
The two accurate claims were the dull ones: a 2025 net loss of $42.0 billion on $4.6 billion of revenue, and $2.08 of revenue for each dollar of compute in the second quarter. Neither passed 9,000 views.
What X missed in the Anthropic S-1
Five findings in the S-1 drew four posts or fewer each.
Searching for what is not being said is the part of Twitter research nobody does by hand, because it needs the filing and the conversation side by side. Compound counted the posts that raised each finding from the S-1 workbook, by the words a post would use, and returned the ones X had left alone.
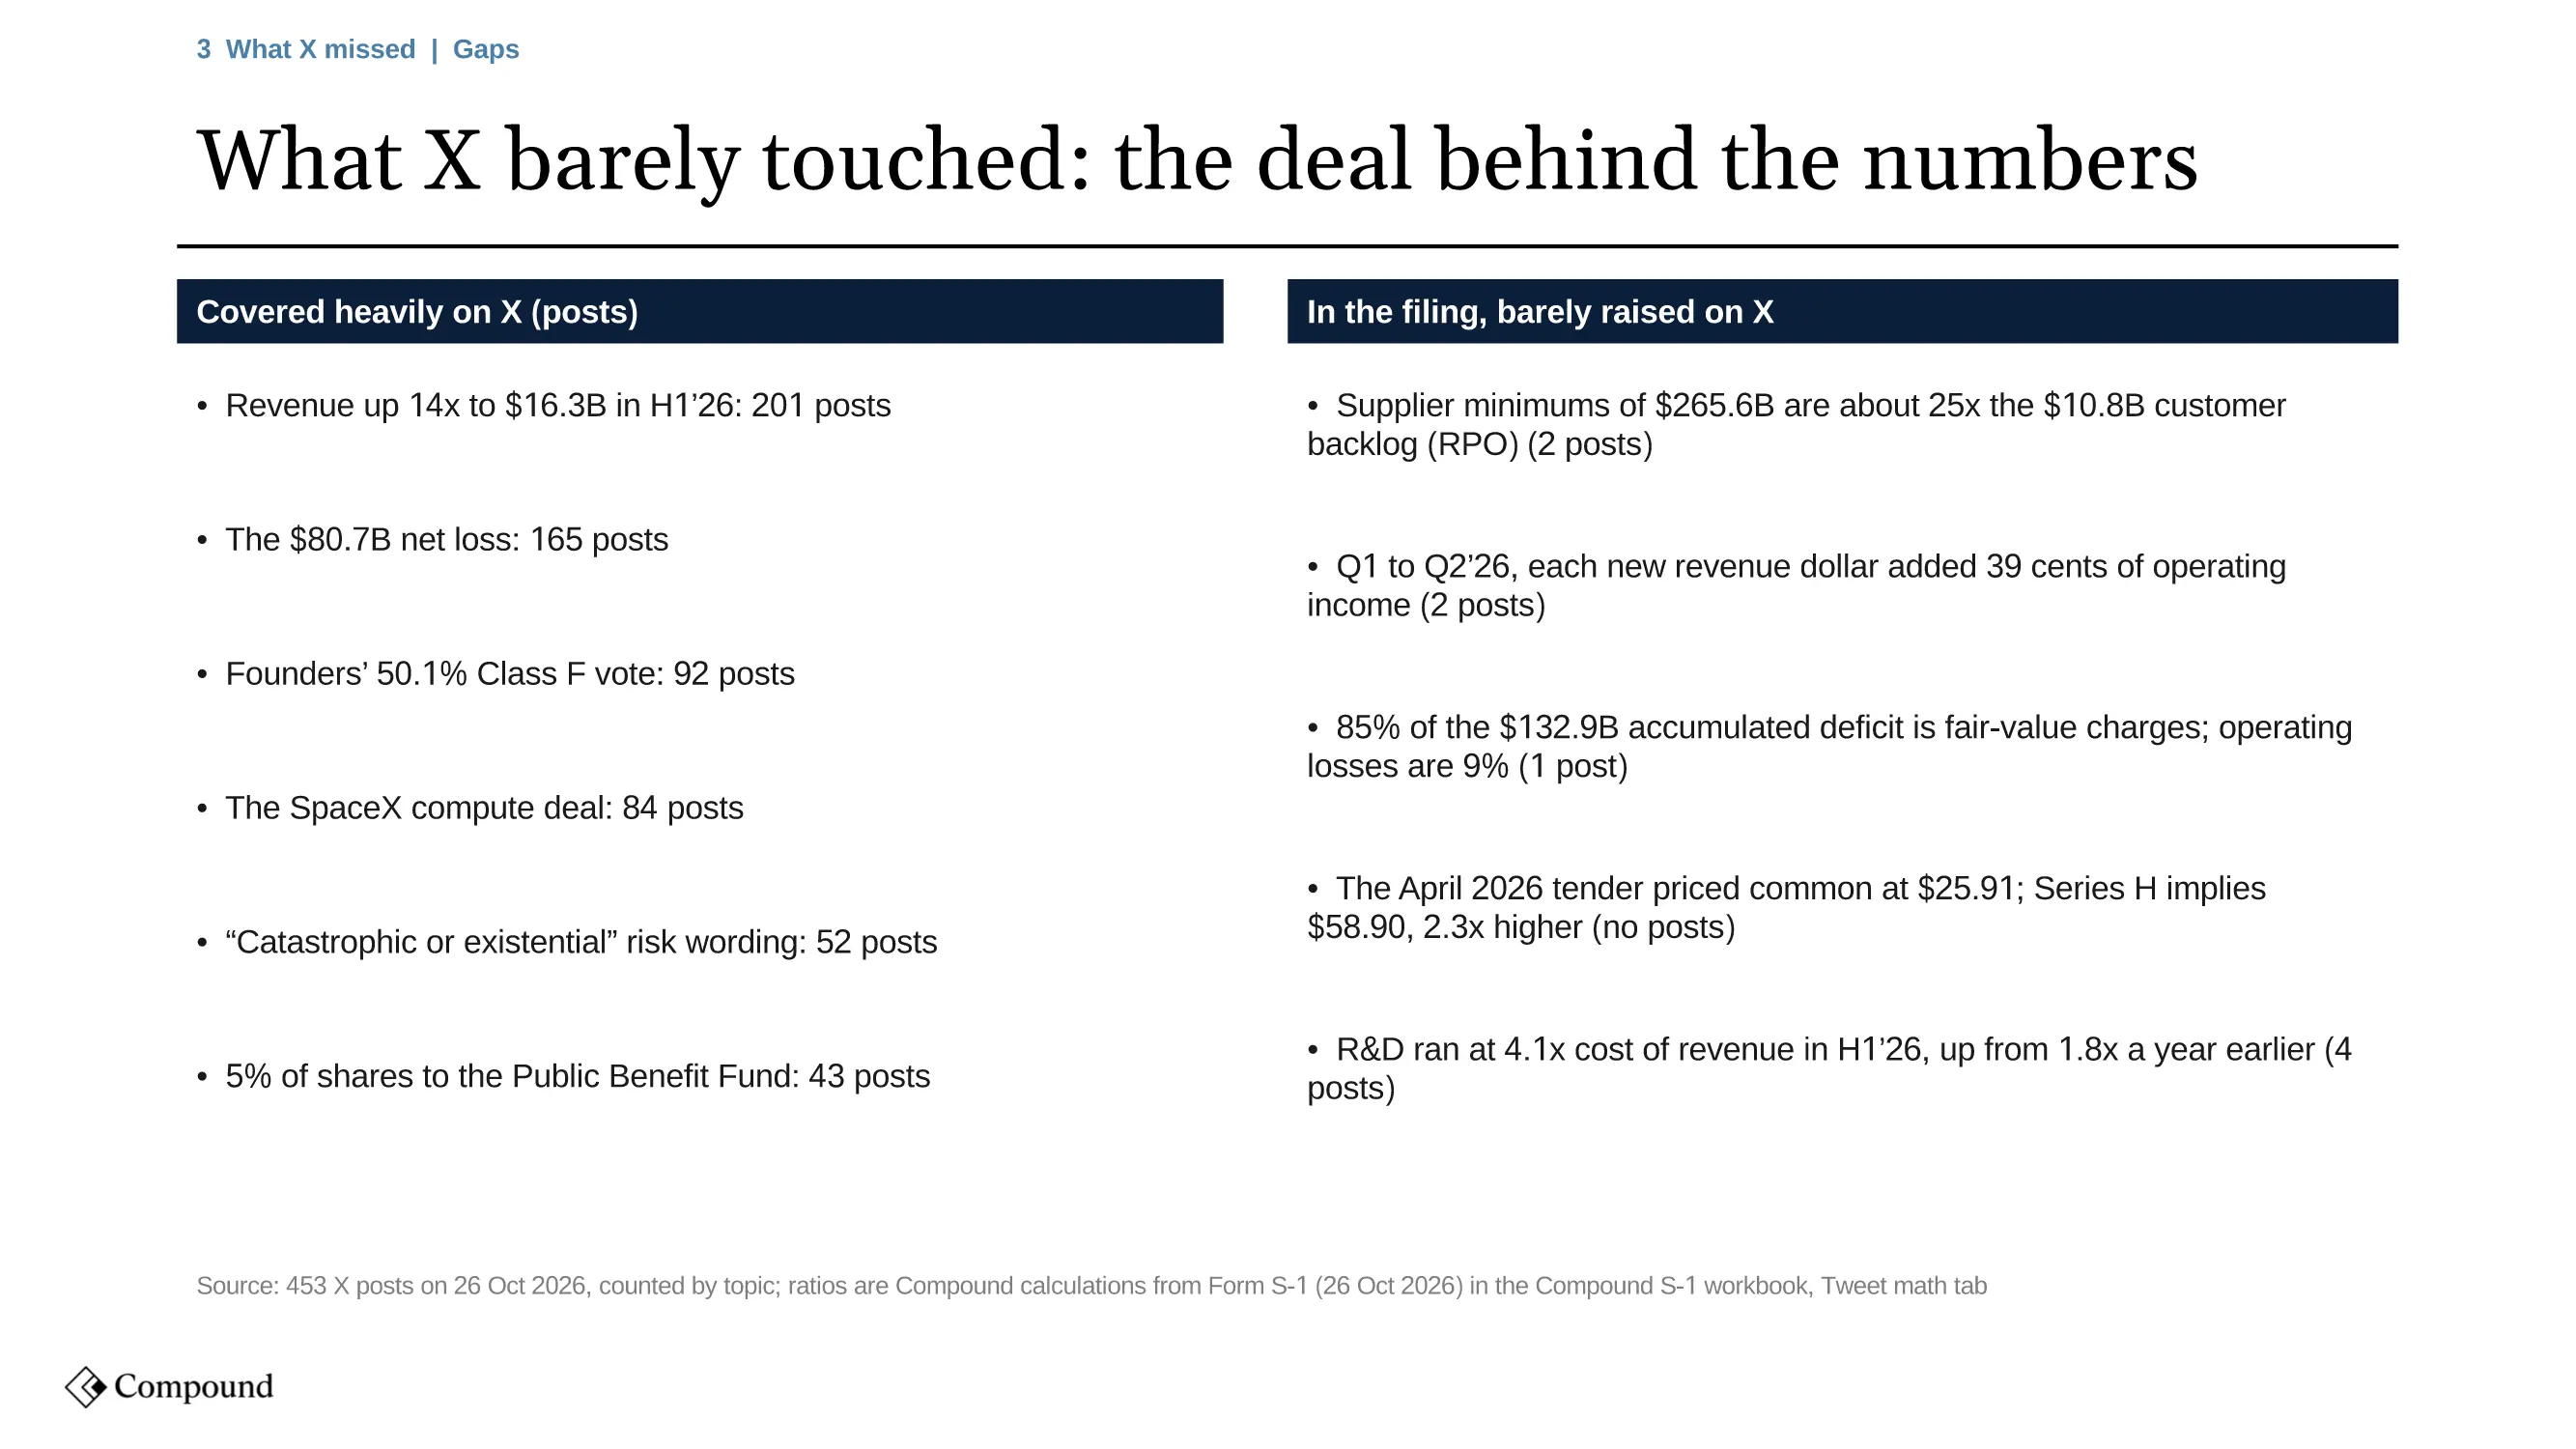
- Supplier commitments against customer backlog. Fixed or minimum compute commitments of $265.6 billion are about 25 times the $10.8 billion of remaining performance obligations, the contracted revenue customers have committed to. Two posts, 61 views.
- Incremental margin. From the first to the second quarter of 2026, each new dollar of revenue added 39 cents of operating income. Two posts.
- What the deficit is made of. 85% of the $132.9 billion accumulated deficit is fair-value charges; operating losses are 9%. One post.
- The tender price. The April 2026 tender priced common stock at $25.91 a share, against $58.90 implied by the Series H, 2.3 times higher. No posts.
- Research spend. R&D ran at 4.1 times cost of revenue in the first half of 2026, up from 1.8 times a year earlier. Four posts.
Each is a calculation from the filing that a reader of the summaries would not see, and each is a post nobody had written yet. An earlier task on the same agent drafted original posts on angles like these for a teammate to publish.
The deck: X on the S-1 in 13 slides
The output is a deck a portfolio manager reads in five minutes and a workbook the team audits in Compound.
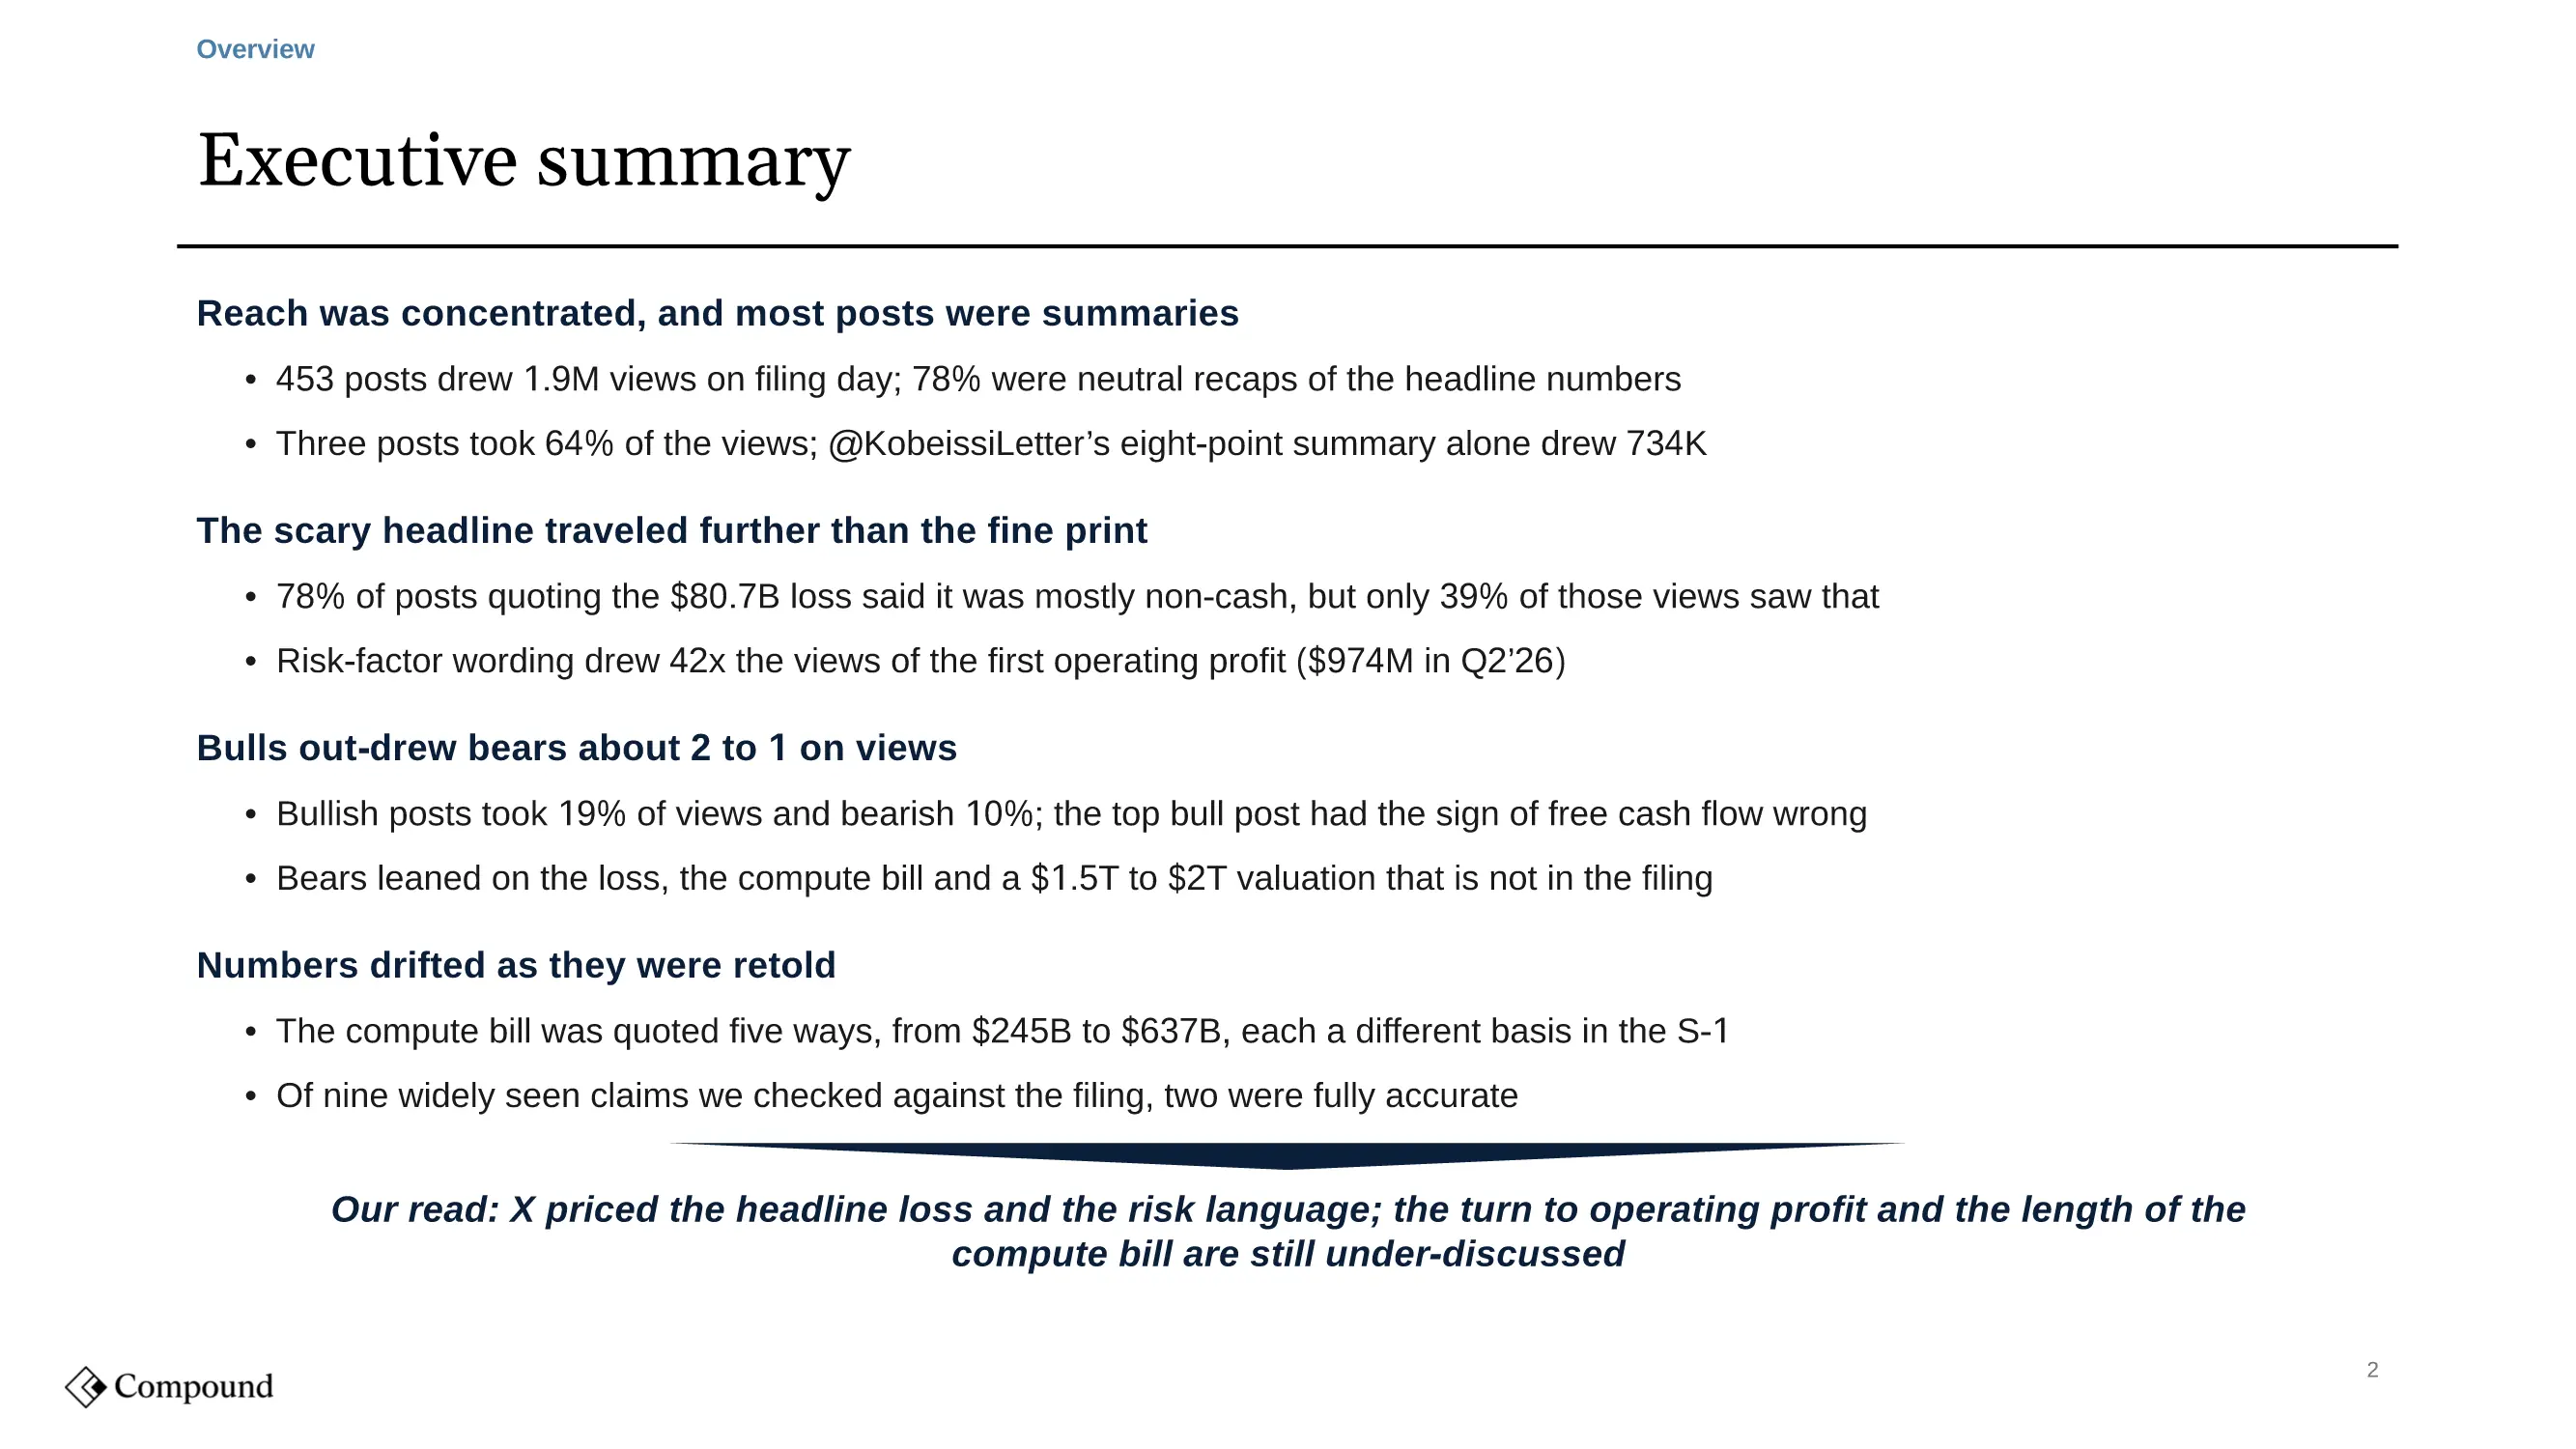
The deck runs from the summary through four slides on the conversation, the market reaction as posted, three slides checking claims against the filing, the gaps, and a method appendix that states the sample, the search window and how the tagging was done. Every chart is a native PowerPoint chart drawn from the workbook, and every post in the workbook links to X, so the team can open any post the deck counts. The fact check and the post tables on this page are excerpts from that workbook.
What a day of X on a filing is worth
X priced the headline loss and the risk language within an hour of the filing. The turn to an operating profit, the length of the compute commitments against the customer backlog, and the gap between the tender price and the last round barely came up. An investor who read the day’s most-viewed posts came away with a number that was true and a story that was not. An investor who read Compound’s deck came away with which takes traveled, which were wrong and by how much, and five questions the market had not asked yet.
The same run works on any event X talks about: an earnings call, a short report, a deal announcement, a management change. Give Compound the event and the source document, and it returns the conversation ranked and checked against the source, with every post linked.