Introducing IC Deck Bench: From Data Room to Investment Committee-Ready PowerPoint
A benchmark of AI agents building the PowerPoint deck a private equity firm takes to investment committee
Research · by Compound Team · November 16, 2026 · 19 min read
- Compound
- Best other agent
- Claude (Claude Code)
- GPT (Codex CLI)
- Gemini (Antigravity)
- Muse (Muse Code)
IC Deck Bench measures how well AI agents perform the PowerPoint work behind a private equity investment committee (IC). Each entry is an agent: one or more models running inside a harness (Compound, Claude Code, Codex CLI, Antigravity or Muse Code), with that harness’s tools, prompts, sandbox and limits. A score belongs to that combination, not to the model alone, and the same model can score differently in a different harness. Some firms write the investment committee memo in Word, but many present it as a deck, and the deck is what we evaluate. Each task asks for a deliverable an analyst would produce: an IC deck built from a data room, a lender presentation, a deck on the firm’s template, an update after the committee meets, a single exhibit, or a routine edit to an existing deck. We grade the PowerPoint file the agent delivers and, where the task also calls for a valuation model, check the deck against that model.
The example below shows the summary page from two agents given the same task: the Voltaic data room, published with PE Bench, and no firm template. One deck is from Compound at auto effort, the other from Claude Code with Claude Opus 5.5 at max effort. Compound’s title states the decision: bid 21.0x, conditional on confirming the anchor lease terms. Claude Code’s title is “Executive summary and recommendation”, and its page gives two different prices.
Voltaic IC deck: the summary page, Compound and Claude Code with Opus 5.5
The benchmark has 61 tasks. Twenty-five are deal tasks, built on four data rooms, two fictional firm templates and a set of decks with realistic formatting problems. The other 36 each ask for a single native PowerPoint chart.
Three representative prompts:
Using the data room, perform an analysis of the company. Do a full deep-dive data room analysis of the company, build the valuation model in Excel, and present an investment committee memo, as a PowerPoint deck, describing your findings and recommendations. Valuation is probably at 21.0x FY25 Adjusted EBITDA on the seller’s definition, so the multiple compares; a cost the accounts do not yet record is a diligence point, not an EBITDA adjustment.
The company is Marrowfield Foods, but Marrowfield lender presentation.pptx misspells it “Marrowfeild” in places. Fix it everywhere, change nothing else, and save the deck under the same name.
Using our template (Templates/Corrowdale Partners IC template (sample pages).pptx) and Fund_IV_returns_simulation.xlsx, build one slide for the IC deck: a native box and whisker chart (PowerPoint’s built-in Box & Whisker chart type) of the simulated gross IRR with one box per scenario (Downside, Base and Upside), each box marking its mean. Save it as a PowerPoint file.
This is the first release of IC Deck Bench. We plan to add more deck types, and more of the PowerPoint work a deal team does, in future releases.
Results
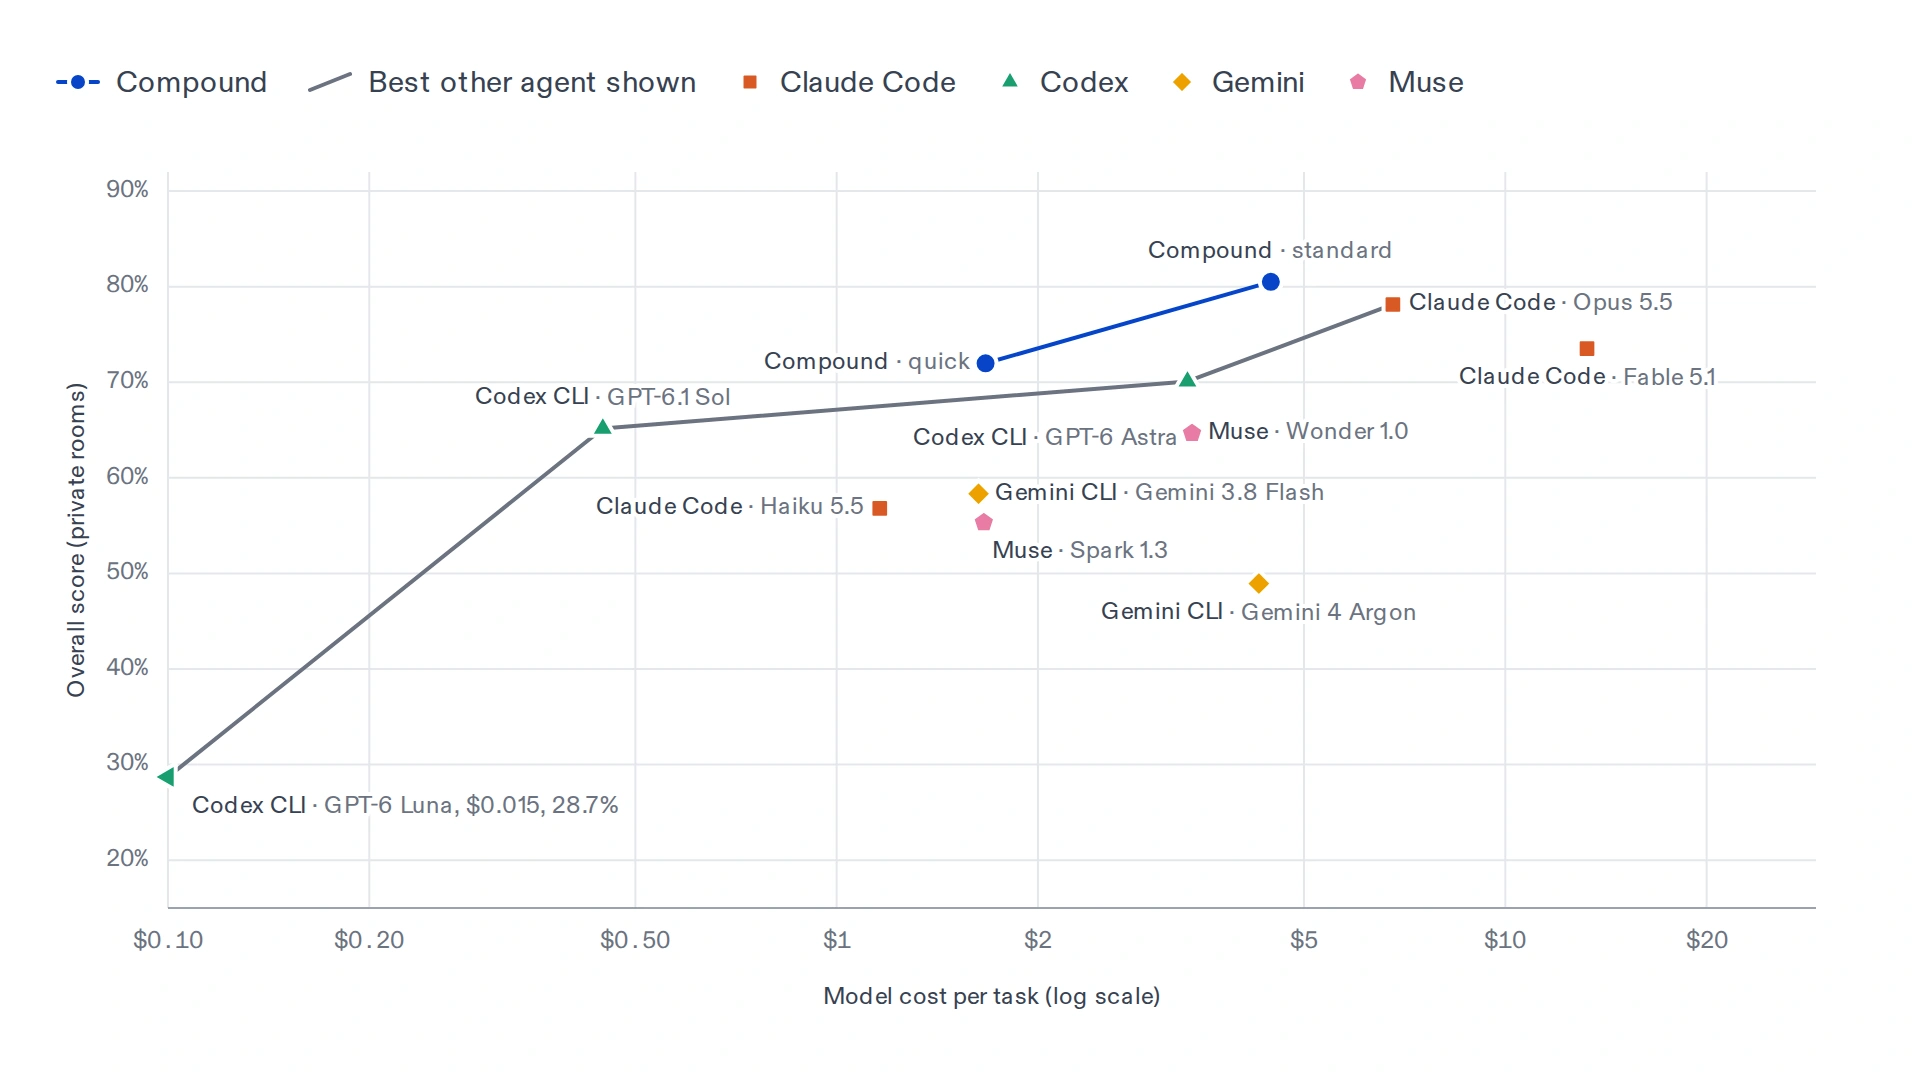
Each row is one agent: a harness running a model at one effort setting. The table shows each harness’s best setting across all 61 tasks, as of November 15, 2026.
| Harness | Model and effort | Score | Model cost per task |
|---|---|---|---|
| Compound | auto effort | 89.2% | $4.38 |
| Claude Code | Claude Opus 5.5, max effort | 86.1% | $14.11 |
| Muse Code | Muse Wonder 1.0, max effort | 74.3% | $4.18 |
| Antigravity | Gemini 4 Hydrogen, high effort | 71.2% | $1.86 |
| Codex CLI | GPT-6.1 Terra, ultra effort | 70.5% | $0.37 |
Each agent ran at the effort shown; where a run set none, the agent used its own default. More settings of each agent, with their time per task, are on the IC Deck Bench leaderboard.
Every deck is graded as Microsoft PowerPoint renders it. The open-source grader also runs on LibreOffice for anyone without Microsoft Office, but its scores can differ from PowerPoint’s, for reasons explained under Grading below. A sample task, with every agent’s graded deck, its PowerPoint renders and its score on each rubric, is on Hugging Face.
Each model runs in its own lab’s agent harness, the environment it is most likely optimized for: the Claude models in Claude Code, the GPT models in Codex CLI, the Gemini models in Antigravity and the Muse models in Muse Code, while Compound runs through the Compound product. Every harness runs headless with auto-approval, with its own shell, file and web tools, at the effort shown on the leaderboard, and every one gets the same task prompt and the same document skills (Anthropic’s open-source docx, xlsx, pptx and pdf skills). How each harness loads the skills is in the PE Bench repository’s docs/running-agents.md.
Every agent other than Compound has 90 minutes (5,400 seconds) per task; a run that reaches the limit is graded on the files it has delivered by then. Compound has no time limit and stops at its own step limits. Most agents ran each task once. Antigravity with Gemini 3.8 Flash ran all 61 tasks twice, and Compound ran them twice at auto effort and three times at quick effort; for these, scores and costs per task are averages across runs.
Why Compound leads
Compound is an AI analyst for finance: it builds Excel models, PowerPoint decks and memos from a firm’s own files. The scores reported here are for the product as it ships, the same agent customers use. Two factors account for most of its lead.
Better tools for Office files. Compound runs on its own rewrite of Excel, PowerPoint and Word: a spreadsheet engine that recalculates workbooks, and a document engine that draws slides the way PowerPoint does. A Compound agent builds native charts with their data embedded, including the newer types such as waterfall and box and whisker; ties the figures on each slide to the live model; and looks at a render of every page before it hands the deck over.
Models from more than one lab. Compound is not tied to a single model. Its harness routes each part of a task to the model that performs it best for the cost, across labs, and combines the results into one deliverable. A single-lab agent can choose only among its own lab’s models; drawing on several lets Compound reach points on the cost chart that no single-lab agent reaches.
What makes a strong IC deck
At most private equity firms, the final deliverable to the investment committee is a long deck, typically 50 to 100 pages. We built realistic data room tasks around the work that produces that deck: the diligence and the valuation model behind it. We grade each deck against the standard a senior partner applies before a deck goes to committee:
It leads with the answer. The price and the recommendation come first, followed by a bridge from the seller’s number to ours.
Every figure ties. A number in the deck matches the model behind it and traces back to a document in the data room.
It makes a call when the documents disagree. The CIM, the monthly accounts and the quality of earnings report often conflict. The analyst reconciles them and states which figure to rely on.
It shows evidence in professional language. No icon cards with one-line blurbs, no conversational headings (“What we pay for it”), no stock AI phrasing (“unlock”, “mission-critical”), and no explanations of EBITDA to a committee. Each source names a document a reader can find.
Halberd IC deck: describing the business
It follows the firm’s template. Layouts, fonts, colors and chart styles match the firm’s own.
Charts are native PowerPoint charts with their data embedded. A reader should be able to open a chart and see the numbers behind it. The example below shows the same Kilnmere EBITDA bridge from three agents. Compound’s is a native waterfall chart. Claude Code’s looks correct but is built from ten rectangles placed by hand. Codex CLI’s is a table, with every figure to four decimal places.
Kilnmere IC deck: the EBITDA bridge
Updates leave no stale figures. A revised price or a new document is reflected on every page it affects.
Every comment is resolved. Each partner comment is either applied or answered with a reason.
The file opens cleanly. PowerPoint opens the deck without a repair prompt.
Task design
The tasks cover three kinds of PowerPoint work: building a deck from a raw data room, building on a firm’s template, and editing an existing deck.
Investment committee deck. This is the core task. The agent receives a data room of more than a hundred documents and builds the investment committee deck, together with the valuation model in four of the six tasks. Judgment matters most here: which earnings to underwrite, which of the seller’s adjustments to accept, what the business is worth, and which findings to raise. The model supplies the numbers; the deck carries the argument.
Bid. The agent recommends what to offer for a business and where to walk away, against a fund mandate the prompt sets out: a return target, a holding period and no reliance on multiple expansion. The bid in the deck has to tie to the return the model shows at that bid.
Lender and first-look decks. The same kind of data room, written for a different reader. In one task the agent writes the presentation to the company’s lenders before signing, setting out what the deal needs from each. In another it writes a first-look deck for a Monday deal meeting: whether to submit a first-round bid, and in what range.
Deck on the firm’s template. The agent builds an investment committee deck from a data room on one of two fictional firms’ templates (described below). In addition to everything we check on any IC deck, the new pages must look like the firm’s own.
Single exhibits. One data-heavy page built from a workbook: a market map, a valuation football field, or a peer margin comparison. PowerPoint has no native chart type for a market map or a football field, so the agent must construct them. Each page is judged on whether it makes its point at a glance: the size and share of each segment, the valuation ranges against the offer price, and the company clearly distinguished from its peers.
Updates. The agent receives an investment committee deck and its model, along with new information: the minutes of the committee meeting, a lender’s term sheet received that morning, or documents added to the data room after the deck was written. It must update the model, carry the change through every page it affects, and leave the other pages unchanged.
Deck review. The agent receives a finished deck and its model before they go to the committee. In one task it reviews both and corrects every error, without changing figures that were already correct. In the other, the deal partner has left comments on the pages and sent a short email; the agent resolves the comments and drafts a reply to the partner.
Edits to existing decks. Real decks are rarely clean. The agent makes one routine edit to a deliberately difficult deck (described below): correcting a misspelled name, rolling figures forward a quarter, rebuilding a table pasted in as a picture, or retitling pages. Each edit contains a trap, such as a near-match that should not be changed. The task passes only if the edit is correct, nothing else changed, and PowerPoint opens the file cleanly.
Native charts. Thirty-six single-slide tasks, each asking for one native PowerPoint chart type or feature: every chart type PowerPoint offers except the region map, and features such as trendlines, error bars, logarithmic scales and secondary axes. A few edit an existing chart, and four leave the choice of chart to the agent.
Methodology
Data rooms
Three of the four rooms, Kilnmere, Ashgrove and Halberd, are synthetic. Each is generated from a single declared set of figures, and every document in the room draws its numbers from that set. A figure quoted in nine documents is identical in all nine, except where we planted a contradiction on purpose. Each contradiction is recorded as data (which documents disagree, and what each one says), so the correct answer is known by construction, and every build verifies that each contradiction is still present.
A planted issue is a fair test only if the room does not give it away. We therefore built the rooms to read like real sell-side data rooms: file names describe the record a document holds, never the issue within it; no document exists solely to carry a planted issue or explains its own conflict; issues are spread across folders; and most documents contain nothing planted. We wrote the reference memo for each room, in an analyst’s own words, before writing its checks, so the checks test the substance of a finding rather than the room’s phrasing.
The fourth room, Voltaic, is the data room published with PE Bench.
| Room | Company | Source material | Distinguishing focus | Tasks |
|---|---|---|---|---|
| Voltaic | Private data center platform (fictional) | Public PE Bench room: 158 documents (118 PDF, 33 Excel, 7 other) | Finding adjustments the seller did not raise | 1 |
| Kilnmere | Specialty manufacturing carve-out (fictional) | Synthetic room: 123 documents (74 Word, 39 Excel, 10 PowerPoint) | Inventory and standard-cost accounting | 6 |
| Ashgrove | Specialty consumer lender (fictional) | Synthetic room: 111 documents (65 Word, 38 Excel, 8 PowerPoint) | Credit quality and losses by loan vintage | 4 |
| Halberd | Insurance brokerage, secondary buyout (fictional) | Synthetic room: 120 documents (86 Word, 28 Excel, 6 PowerPoint) | Earnings of a business built by acquisition | 7 |
The other 43 tasks require no data room. The exhibit and chart tasks work from a small workbook, and the editing tasks start from the deck itself.
Firm templates
We designed two fictional firms for the benchmark. Corrowdale Partners uses a 16:9 template in forest green and ochre, set in Georgia and Calibri, with fifteen layouts. Ostlund Ridge Capital uses a 4:3 template in navy and slate, set in Segoe UI, with thirteen layouts. Each comes with sample pages from an earlier, fictional deal, the way a real template usually arrives: as the last deck someone made. The agent must follow those pages without copying their content.
Decks for the editing tasks
The decks for the editing tasks are also synthetic, made for fictional companies on the Corrowdale template. They contain the problems that break real decks: text boxes off the layout in the wrong font, grouped shapes, a covenant table pasted as a picture, a chart linked to a workbook on a file share, hidden slides, and a page from a bank on its own master.
Prompts
The deal prompts are written the way a deal lead would ask: “do a full deep-dive data room analysis”, with an indicative valuation multiple and no slide count, outline or sourcing rule. We kept only what the answer depends on, such as the earnings basis, a tax rate or the fund’s return target. We then grade the practices a good analyst follows unprompted, listed above, and never grade a format the prompt did not ask for. Where more than one approach is reasonable, any approach the deck states and applies consistently is accepted.
Grading
Each task has its own scorecard: a few dozen checks written for that deck, each worth a fixed number of points. A full investment committee deck is scored out of 800, and its score is the share of those points it earns.
How the 800 points are split
| What we check | IC deck | IC deck and model | IC deck on a firm template |
|---|---|---|---|
| Substance: the judgment calls, the price and the findings | 480 | 400 | 380 |
| Deck ties to the agent’s own model | 80 | ||
| Professional language | 80 | 80 | 80 |
| Layout and design | 240 | 240 | 140 |
| Firm template | 200 |
- The most heavily weighted check on each deck is the judgment call that matters most for that deal.
- Substance carries roughly half of the points or more, so a well-formatted deck built on the wrong analysis still scores poorly.
Who does the checking
| What is checked | How |
|---|---|
| Figures on every slide, ties to the model, native charts, the firm’s layouts, fonts and colors, edits that leave everything else alone, and whether PowerPoint opens the file | Deterministic checks open the PowerPoint and Excel files the agent delivered and read them directly. They return the same result every time. |
| Whether the deck makes a finding, and whether its language is professional | An AI reviewer reads each slide, much as a partner would. We sample it several times and take the majority verdict, and when it deducts points it must quote the exact words on the slide. |
| Layout and design | A second AI reviewer examines each page as rendered, the way a partner flips through a printed deck, for clean layout, legible charts and well-placed titles. Simple measures complement it, such as how much of each page is used and whether long passages of text are broken up. |
Graded as PowerPoint renders it. The pages the design reviewer sees are rendered by Microsoft PowerPoint, and every deck is opened in PowerPoint to confirm it loads. A deck is only as good as it looks in the application the committee opens it in, and open-source renderers differ from PowerPoint in many known ways: they measure text differently, choose different chart axis ranges and drop some shape effects. On the slide below, PowerPoint fits each data label on one line, while LibreOffice wraps all twelve onto a second line. A reviewer looking at the LibreOffice page would penalize a layout problem the committee never sees.
One chart slide, two renderers
The open-source grader also runs on LibreOffice for anyone without Microsoft Office. More examples are in Rewriting Excel, PowerPoint and Word for Agents.
Validating the checks
- The checks test what a correct deck must contain, so a deck whose storyline, layout or rounding differs from our reference deck can still earn full marks.
- We ran each task’s reference deck through its scorecard several times and reviewed every point it lost, correcting the check wherever the check, not the deck, was at fault.
- We ran deliberately broken decks, with scrambled numbers, typos, charts pasted in as pictures and a broken template, and confirmed that each was penalized.
- If a grading tool fails, the task is marked as not yet graded, never as a failure.
Worked example: the Voltaic IC deck
This section applies the standard to the first prompt above, the Voltaic investment committee deck. Voltaic is a fictional US data center platform, and its findings are public through PE Bench.
The seller adds back $4.8m of sale costs to reach its adjusted EBITDA. About $2.9m of that was spent before the sale process began, so it is not a cost of the sale, and a buyer should not pay 21 times it. The most heavily weighted judgment call is whether the deck identifies this, removes that amount from the EBITDA it underwrites, and explains why. Beyond that, we look for a price consistent with the deck’s own earnings at 21.0x; one-off items deducted at face value, once, rather than multiplied by the valuation multiple; and the other findings in the room that affect the price, each either sized and priced or explicitly excluded with a reason.
We then apply the checks any partner would. Is the price in the first five slides? Does the deck bridge from the seller’s number to ours? Does each slide with figures name its source document? Do the price, earnings and bridge match the agent’s own model? Is the deck written in professional language, cleanly laid out, with native charts?
Qualitative comparison
We reviewed, page by page, the decks Compound and Claude Code (Opus 5.5 at max effort) delivered on every task. The pages below come from tasks with no firm template and no styling instructions, so each agent used its own default: Compound starts from its built-in IC deck template, while Claude Code and Codex CLI design each deck from scratch. Both Compound and Claude Code produce fluent decks, and on many tasks their scores are close. The differences below are the ones a partner would notice first. Where Codex CLI’s deck illustrates the same point, we include its page as well, from GPT-6.1 Terra at ultra effort.
Leading with the recommendation
On the Voltaic summary page shown at the top of this post, Compound’s title is the decision: bid 21.0x, $4.7bn of enterprise value, conditional on proving the anchor lease terms. The same page sets out the thesis, what the data room shows, the returns at that price and how the IRR moves with the entry multiple. Claude Code’s page is titled “Executive summary and recommendation” and shows two prices: a $4.70bn headline enterprise value in its tiles and a $4.35bn “IC value” in its recommendation box. A partner reading Compound’s page knows the bid and its conditions from the title alone. On Claude Code’s, the reader has to work out which number is the offer.
The same pattern holds when the answer is not to bid. On the Kilnmere deck, a carve-out from one of our synthetic rooms, Compound’s title gives the decision and the value diligence supports, and a native chart shows what the business is worth on each earnings basis. Claude Code’s title states a finding rather than the decision, and its case is seven numbered paragraphs in small type. Codex CLI’s title is “continue diligence; do not underwrite $415.8m EV”, above three cards of text; the value it would support appears only inside a card, as $276.6915m.
Kilnmere IC deck: the summary page
Returns analysis
A committee expects to see the return at the price it is being asked to approve. Compound’s Voltaic deck has a returns page: IRR and MOIC by case, what reimbursing the seller’s development spend does to them, and an IRR grid by entry and exit multiple. Claude Code’s deck has no returns page. Its only IRR is one row of a cross-check table on its sensitivities page, and the bottom third of that page is empty. Across the deck, 12 of Claude Code’s 18 slides leave much of the page unused, against 2 of Compound’s 15. Codex CLI gives a single IRR, 15.75%, on the seller’s plan, which its own page describes as an illustrative scenario rather than a closing forecast.
Voltaic IC deck: returns
Native charts
A chart in an IC deck will be edited by the next person who works on it, so it must be a native chart with its data embedded, like Compound’s Kilnmere bridge above. Claude Code drew six of that deck’s charts from shapes, and its IC decks failed our native-chart check on four tasks. Compound’s passed on all of them.
Codex CLI delivered no native charts in any of its 12 deal decks, and it presents every price bridge as a table. On Halberd, Compound’s earnings bridge is a native waterfall with one line explaining each step; Codex CLI’s is a table with every figure to four decimal places.
Halberd IC deck: the earnings bridge
Where Codex CLI does draw a chart, it builds it from shapes. Its Ashgrove page on losses by vintage consists of 33 rectangles and text boxes placed by hand: it resembles a bar chart, but its data cannot be opened or updated. Compound’s page is a native chart of cumulative loss by months on book for each vintage, with lifetime loss and share of the book alongside.
Ashgrove IC deck: losses by vintage
Sourcing from the data room
Every deal task gives the agent a data room and asks for an analysis of it. On Ashgrove, Compound walks the seller’s headline value down to its diligence value in a native waterfall, every step drawn from the room. Claude Code’s valuation page leans on a chart of listed lenders’ forward multiples that it took from a public website, outside the documents the deal team supplied. A committee cannot trace that chart to anything in the room.
Ashgrove IC deck: valuation
File integrity
PowerPoint refused to open two of the 61 decks Claude Code delivered, the Halberd deck on the Corrowdale template and the Ashgrove lender presentation, as corrupt, on repeated attempts. Every deck Compound delivered for the 25 deal tasks opened cleanly, including its 21-page Halberd deck for the same task; its one refused file was a chart deck. A committee member opening either of Claude Code’s files would have seen an error message instead of a deck.
Grading the chart tasks
Each of the 36 chart tasks asks for one slide with a specified PowerPoint chart type, built from a workbook: a waterfall, a box and whisker, a bubble chart, a combination chart with a secondary axis, and so on. Some tasks build the chart on the firm’s template, and some edit a chart already on a page. Deterministic checks read the delivered file and verify that:
- the chart is a native PowerPoint chart, not a picture or shapes drawn to look like one;
- it is the chart type the task asked for;
- it plots the workbook’s figures, series by series (the heaviest check);
- it has the features the task asked for, such as a marked mean or a secondary axis;
- its data is embedded, so Edit Data in PowerPoint opens the numbers behind it;
- its labels are drawn where PowerPoint renders them.
An AI reviewer then reads the rendered slide and judges whether the chart makes its point at a glance. Finally, we open every chart deck in PowerPoint for the web. If PowerPoint rejects the file as corrupt, the task scores zero regardless of the other checks.
Each check reflects what happens to a chart after it leaves the analyst. The next person edits it, so a picture or a group of shapes fails even when it looks correct. A reviewer verifies a figure by opening the data behind the chart, so the data must be in the file. And a deck that PowerPoint will not open shows the reader nothing, so no other check can earn it points.
Access
Every task is built on public or synthetic material: the public Voltaic room, three synthetic rooms, two fictional firm templates, and synthetic workbooks and decks. No customer templates or decks are used. To evaluate an agent or model on IC Deck Bench, or to request evaluation or training access, email benchmarks@getcompound.ai.
The Voltaic investment committee deck task, its rubric and the grader are public, on GitHub at GetCompoundAI/ic-deck-bench and on Hugging Face at CompoundAI/ic-deck-bench.