McKinsey slides put the conclusion in the title, written as a full sentence. One chart or table backs it up, with labels written on the data. Numbered notes and a source line run along the bottom. Here are ten examples from real McKinsey client decks, each with an editable PowerPoint copy.
McKinsey-style slides: 10 editable slides (PowerPoint)
The ten slides in one PowerPoint file. Charts, tables and text are all editable.
Download · FreeWhere these slides come from
All ten slides come from McKinsey & Company client decks. The clients posted the decks on their own websites, and the links below go to those PDFs. McKinsey owns the copyright. Our copies drop the McKinsey logo, footer and confidentiality notice. Compound has no affiliation with McKinsey.
| Deck | Published by | Slides |
|---|---|---|
| Transportation and Warehousing Sector Analysis | Federal City Council, Oct 2020 | pp. 3, 5, 9, 10, 14, 37 |
| Digital & Innovation in Engineering and Construction | CalPERS Board, Jul 2018 | p. 4 |
| Regional Airport and Ground Transportation Plan for Southern Ontario | ULI Toronto, May 2015 | p. 4 |
| State Planning Retreat on Public Private Partnerships, Illinois | National Governors Association, Jun 2014 | pp. 2, 8 |
Page numbers are PDF pages.
10 McKinsey slide examples
1. Bubble chart with a text panel
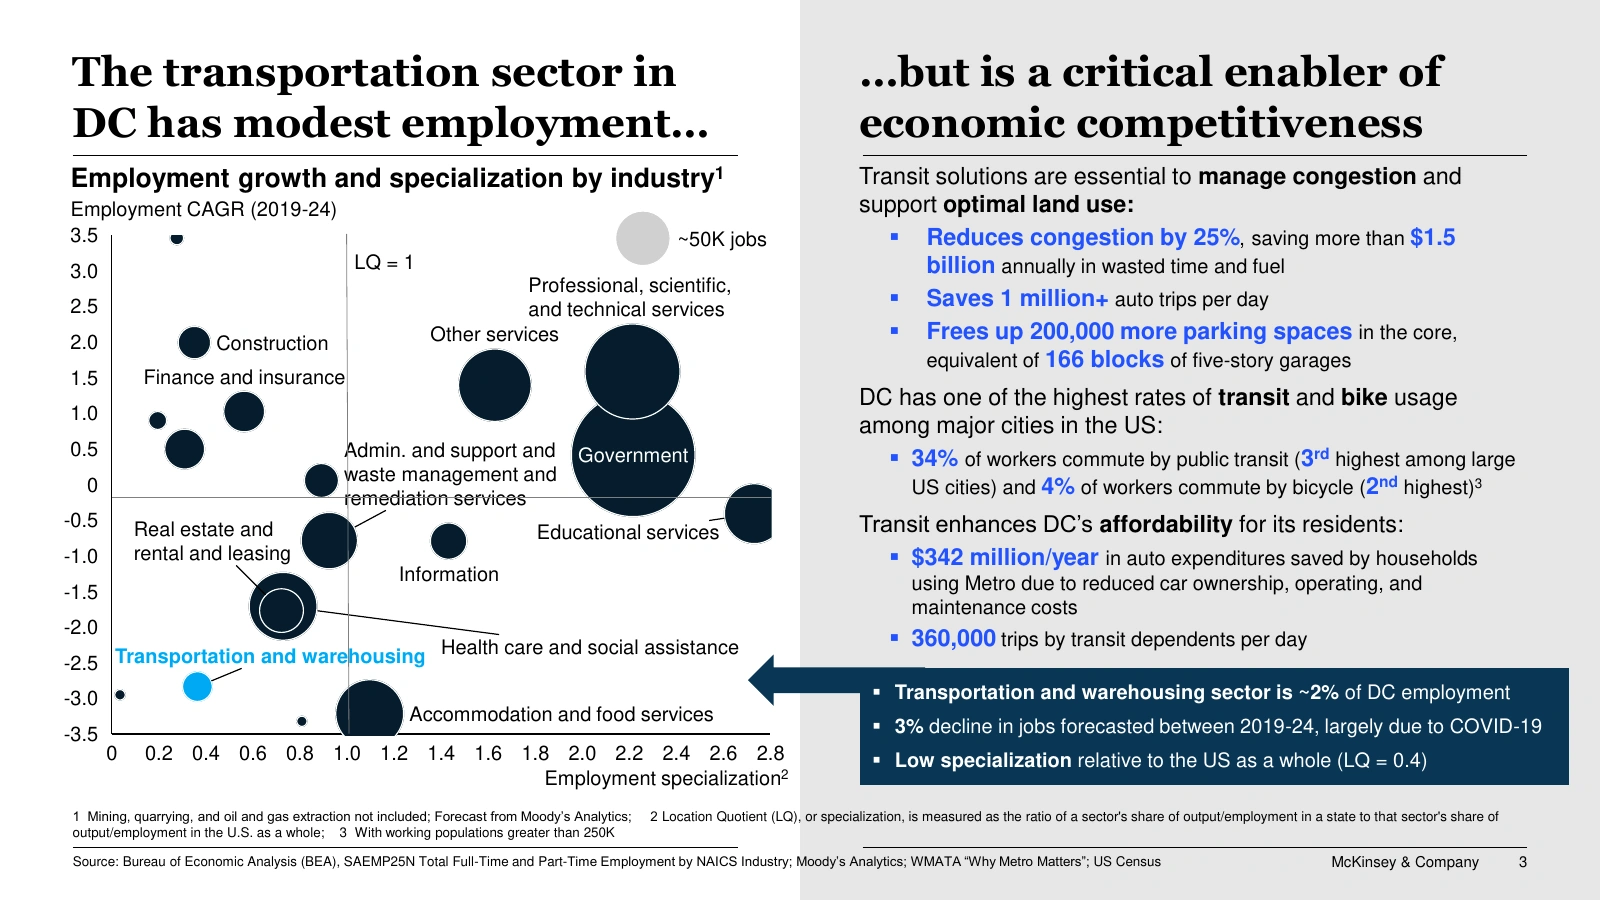
Original, Federal City Council deck, p. 3.
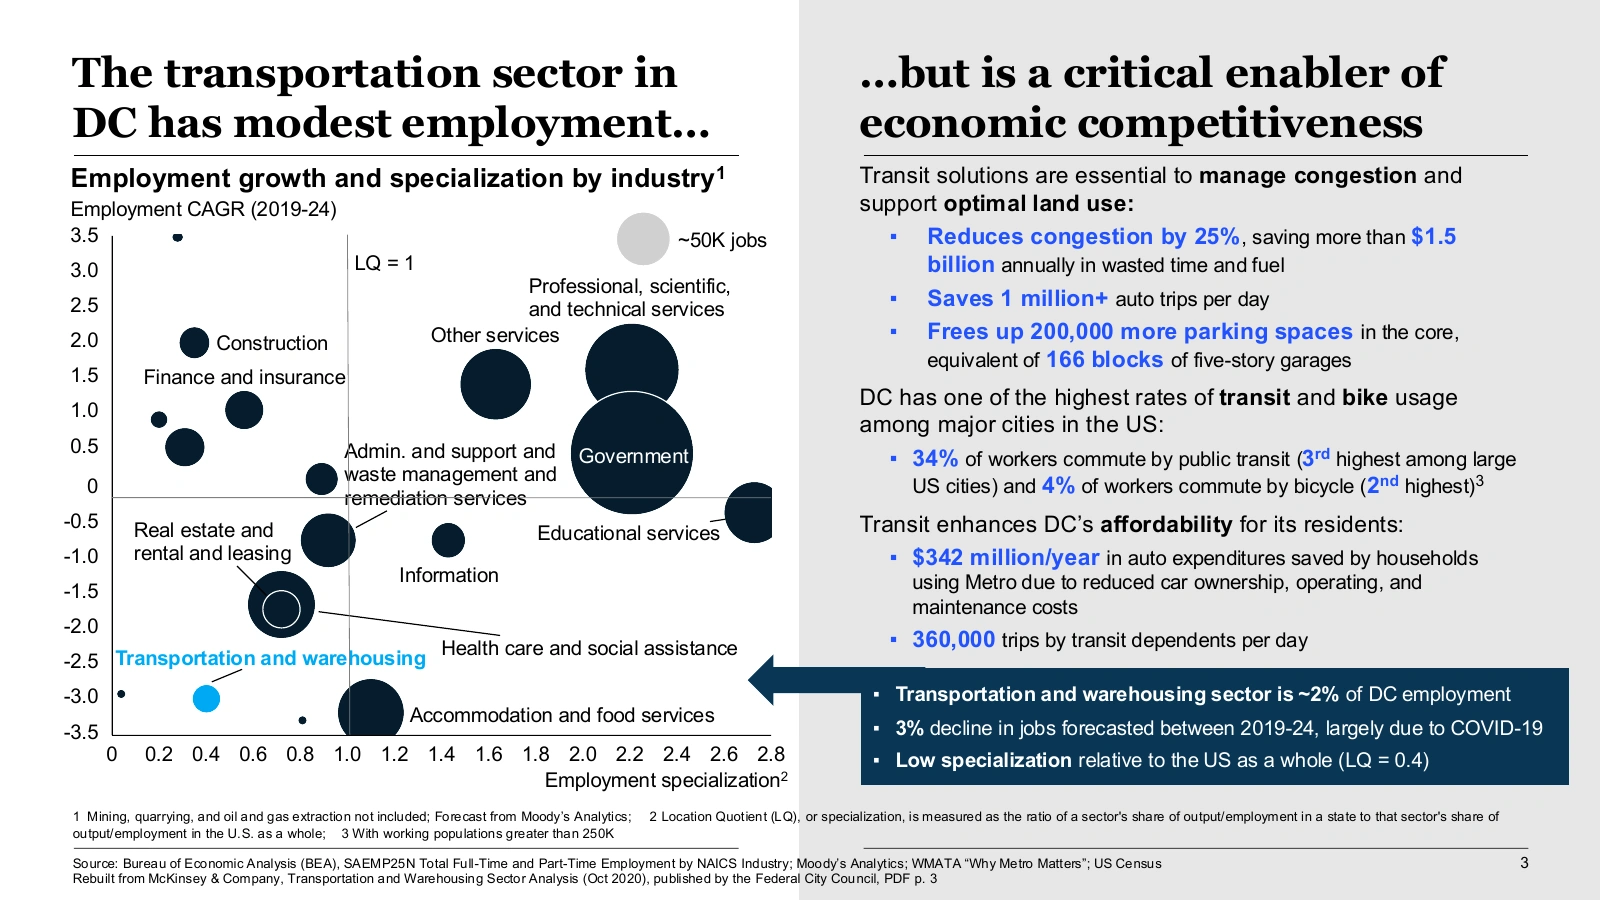
Compound’s copy, opened in PowerPoint.
The title has two halves. The bubble chart on the left backs up the first, “modest employment”. The text panel on the right backs up the second, “a critical enabler”. Of 18 industries, only transportation and warehousing is in light blue. The box at the bottom repeats the point in three numbers: about 2% of DC jobs, a 3% forecast decline, and a location quotient of 0.4.
2. Heat-shaded table
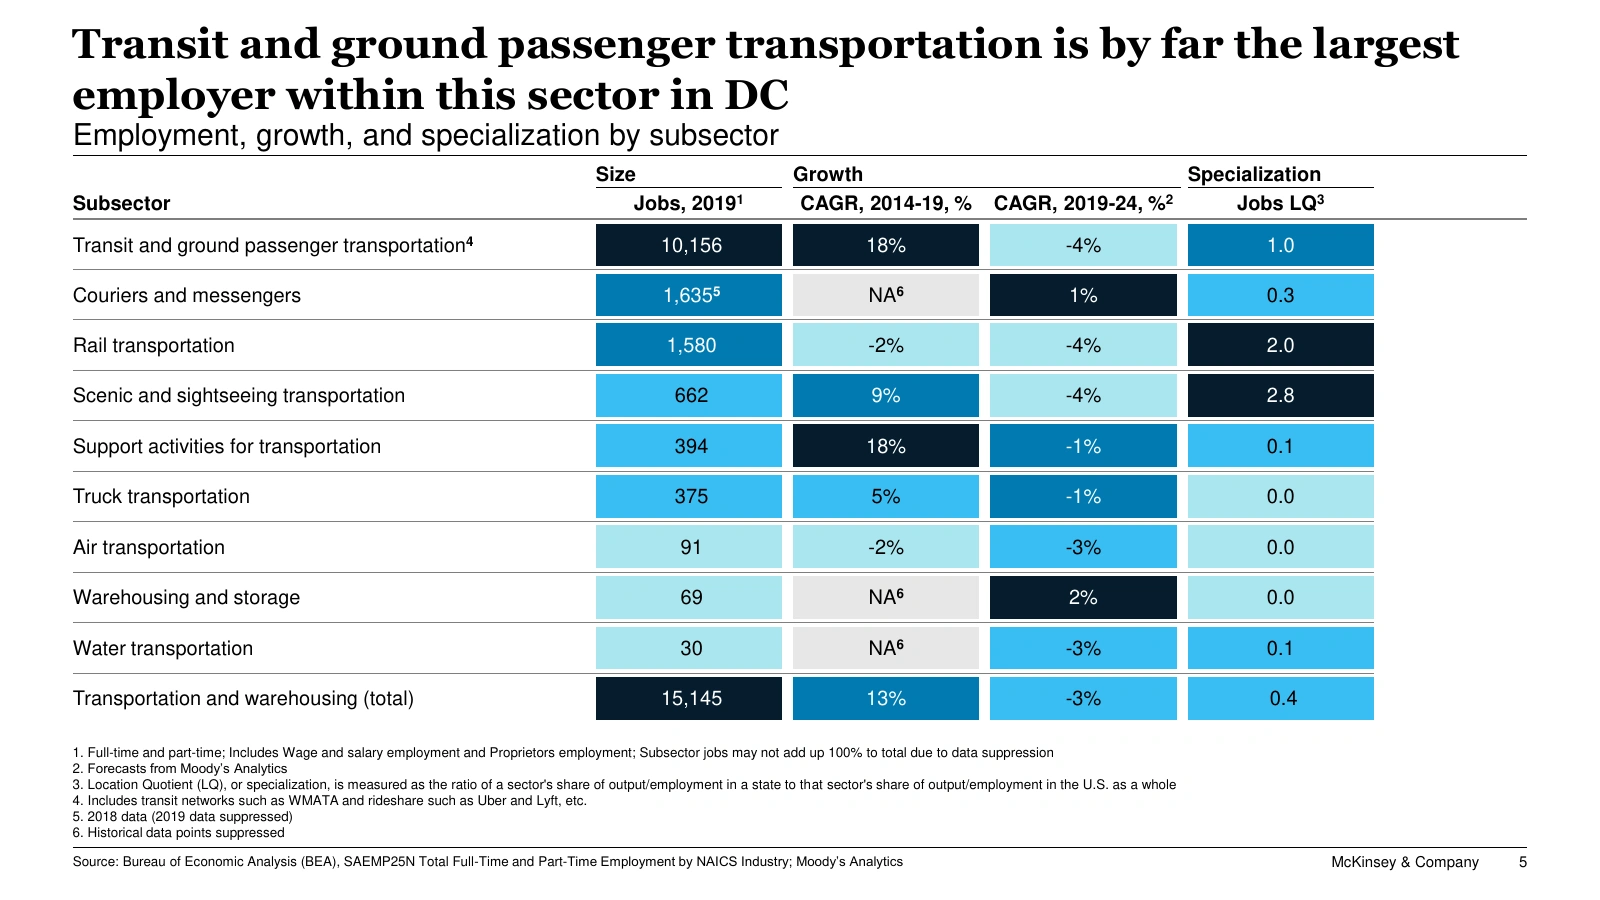
Original, Federal City Council deck, p. 5.
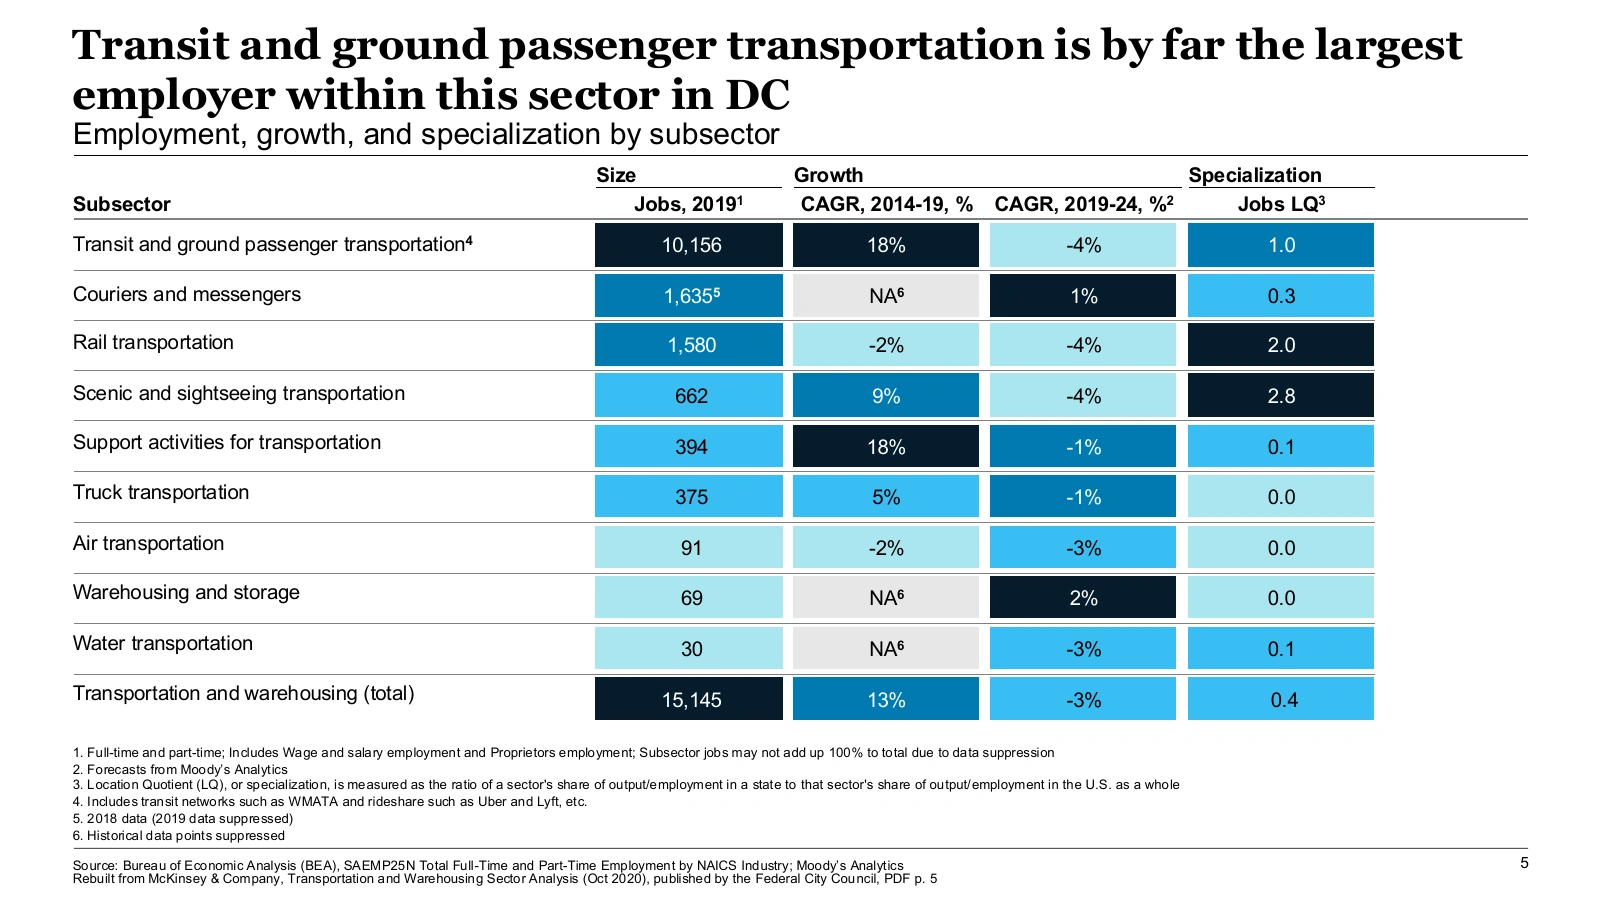
Compound’s copy, opened in PowerPoint.
Three header groups, size, growth and specialization, sort the columns by the question they answer. Each column is shaded on its own scale, and the darkest cells are the ones to read first. Where the data is suppressed, the cell shows a gray “NA” and a footnote explains why.
3. Line chart with event markers
Original, Federal City Council deck, p. 9.
Compound’s copy, opened in PowerPoint.
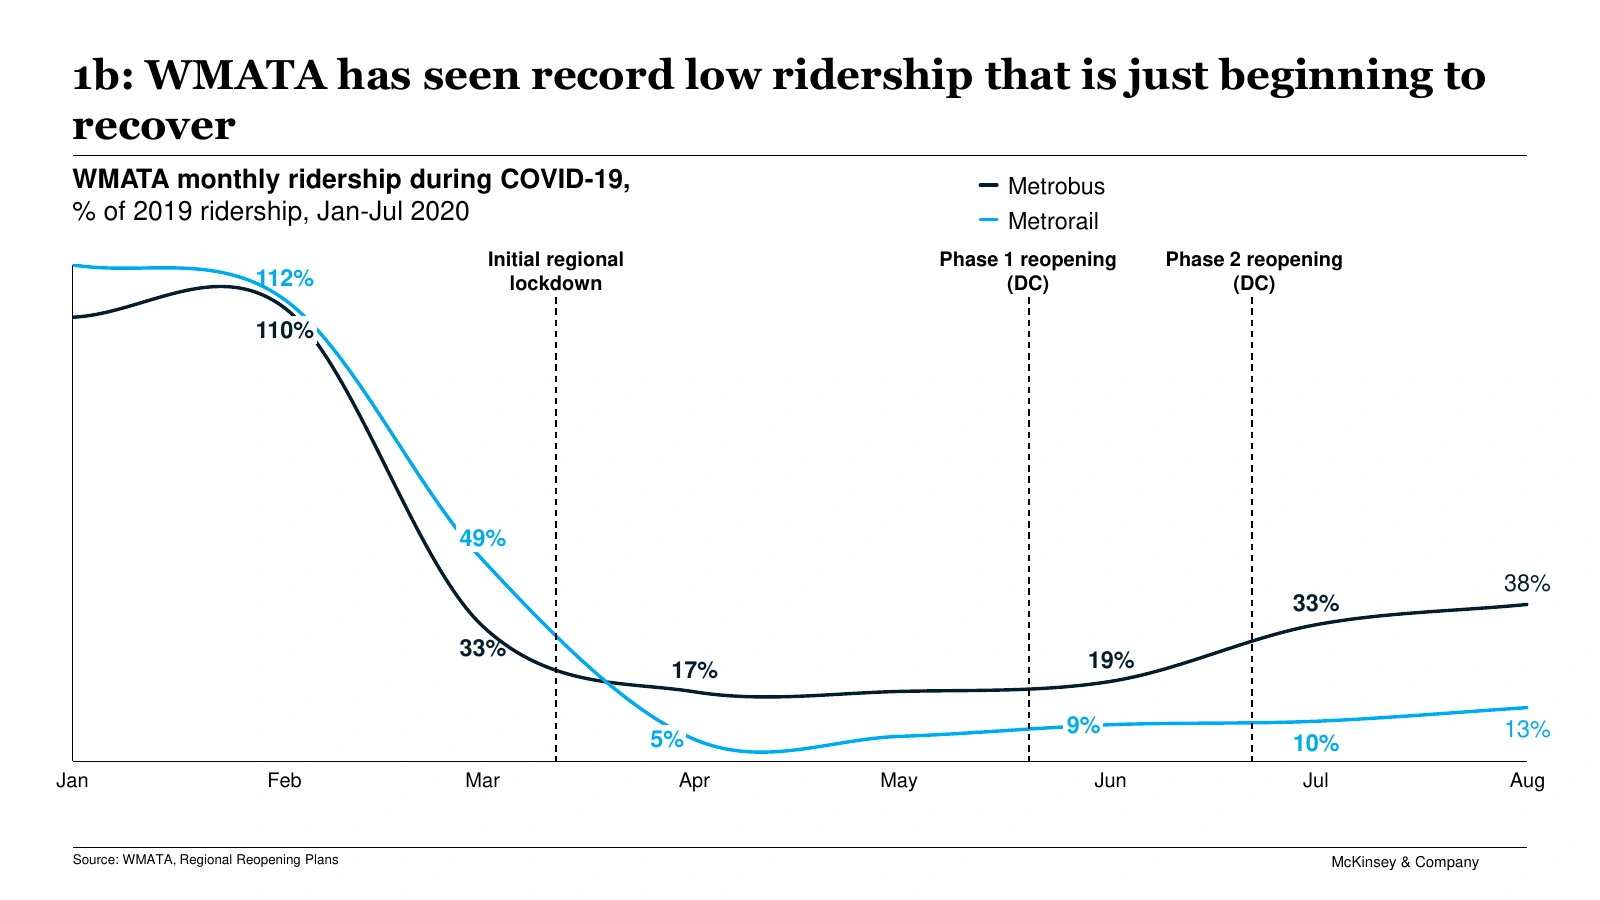
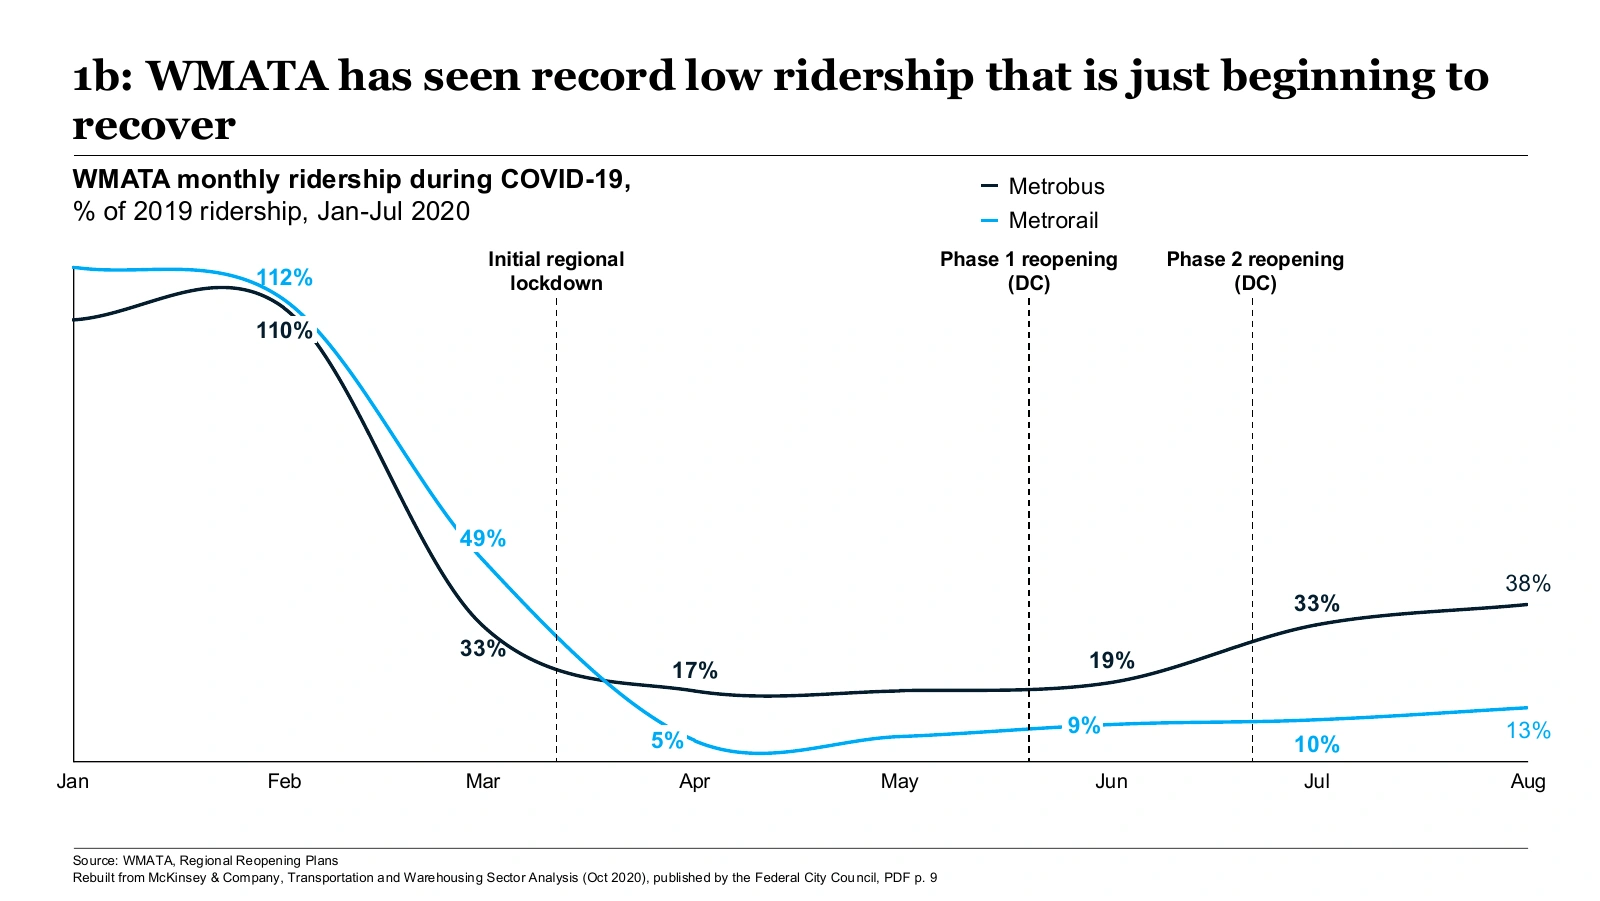
Three dashed lines mark the lockdown and the two reopening phases. Together they explain the fall and the slow recovery, and the slide has no body text. There is no value axis and no gridline. Instead, a handful of points carry labels in the line’s color: Metrorail fell to 5% of its 2019 ridership in April. The “1b:” in front of the title is a tracker, which tells the reader which section of the deck this slide belongs to.
4. Diverging bars, two panels
Original, Federal City Council deck, p. 10.
Compound’s copy, opened in PowerPoint.
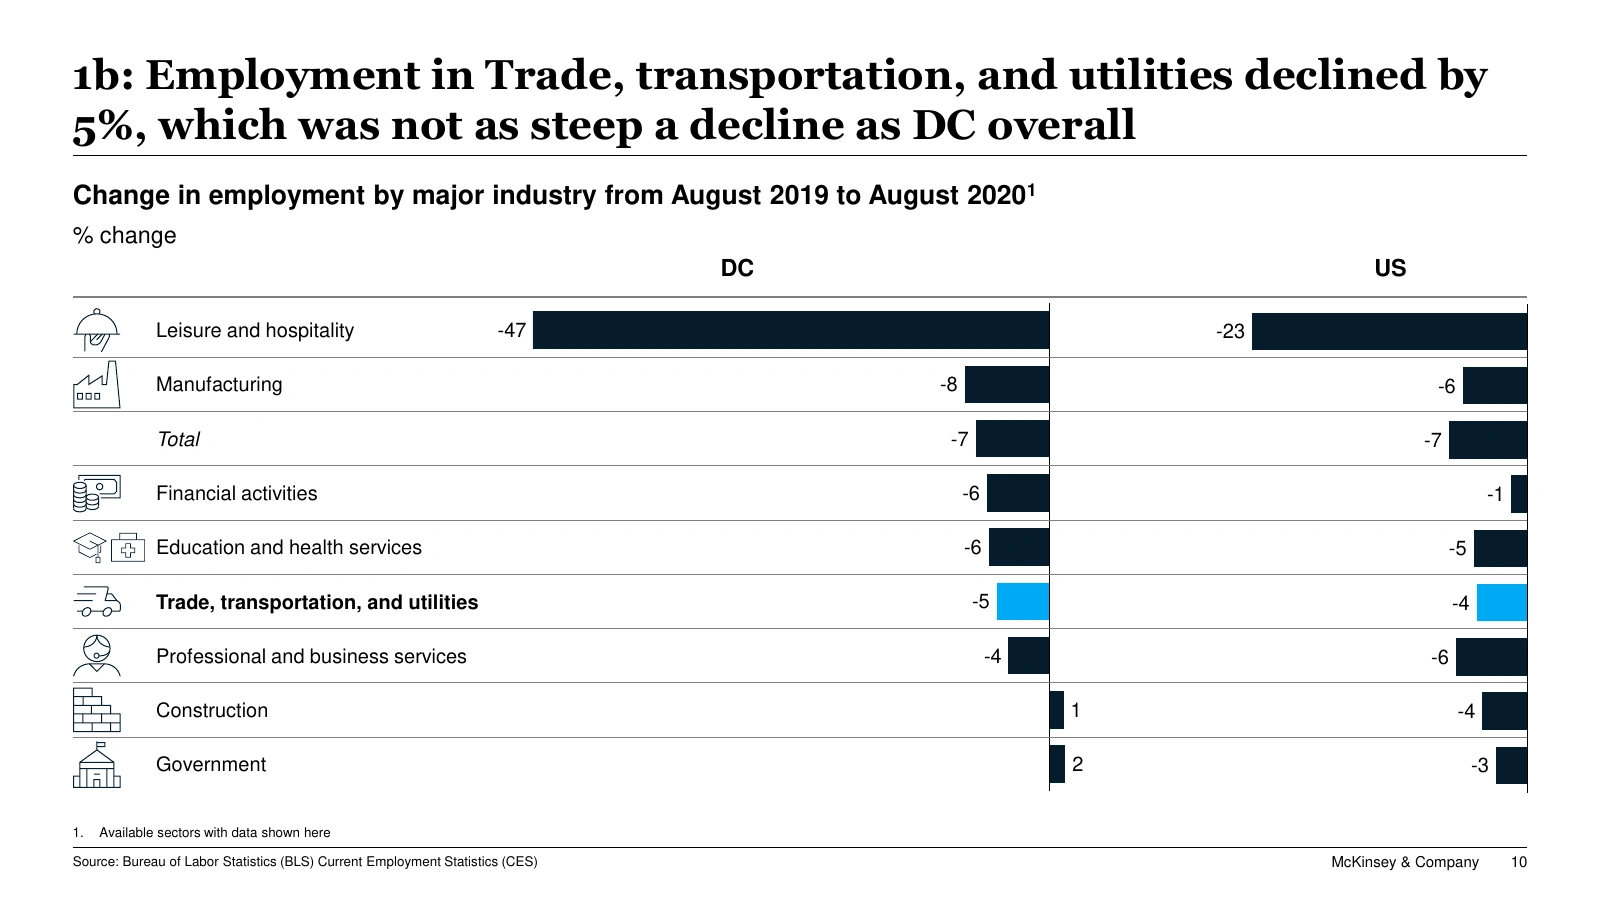
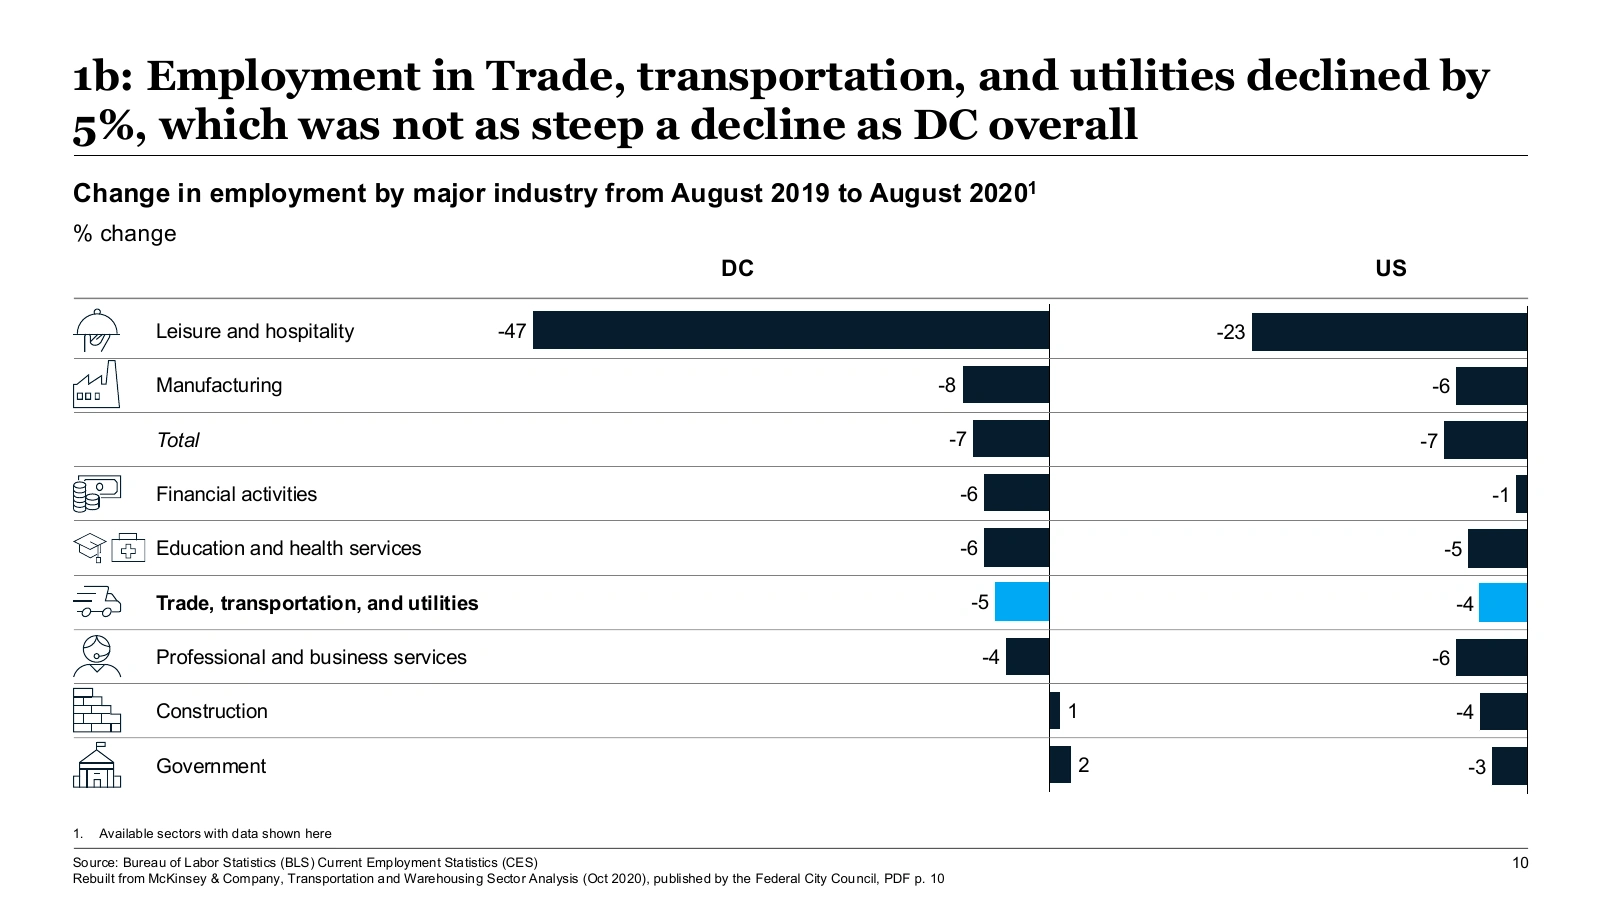
Each industry is one row that runs across the DC panel and the US panel, both measured from the same zero line. Trade, transportation and utilities is the only bar in the accent color. A total row gives the benchmark the title refers to.
5. Paired bar charts with evidence on the side
Original, Federal City Council deck, p. 14.
Compound’s copy, opened in PowerPoint.
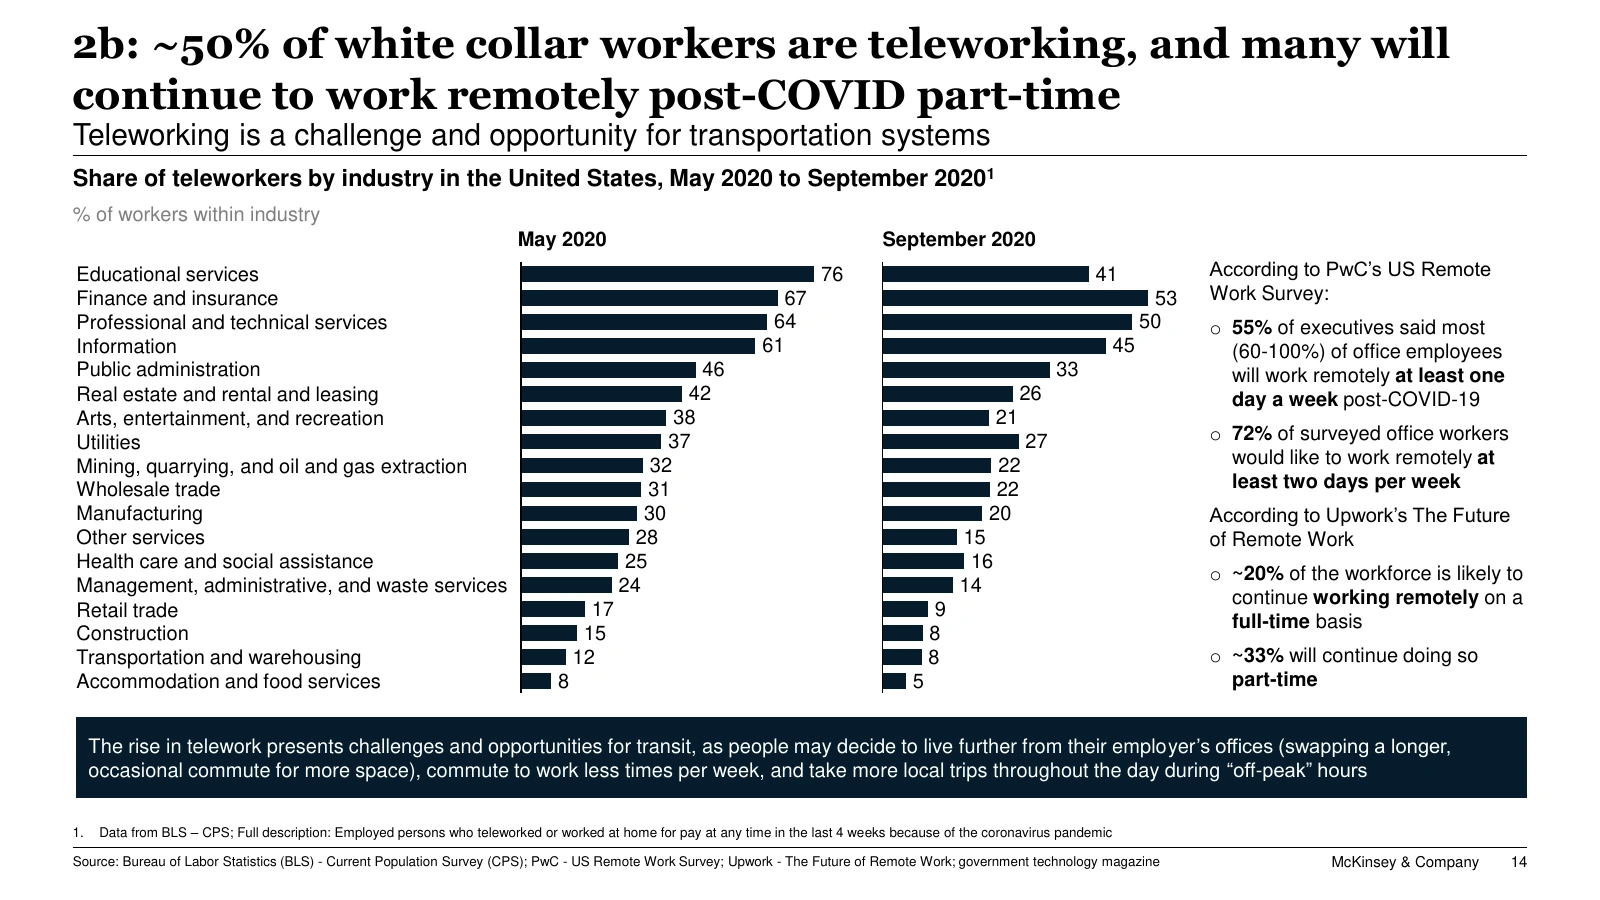
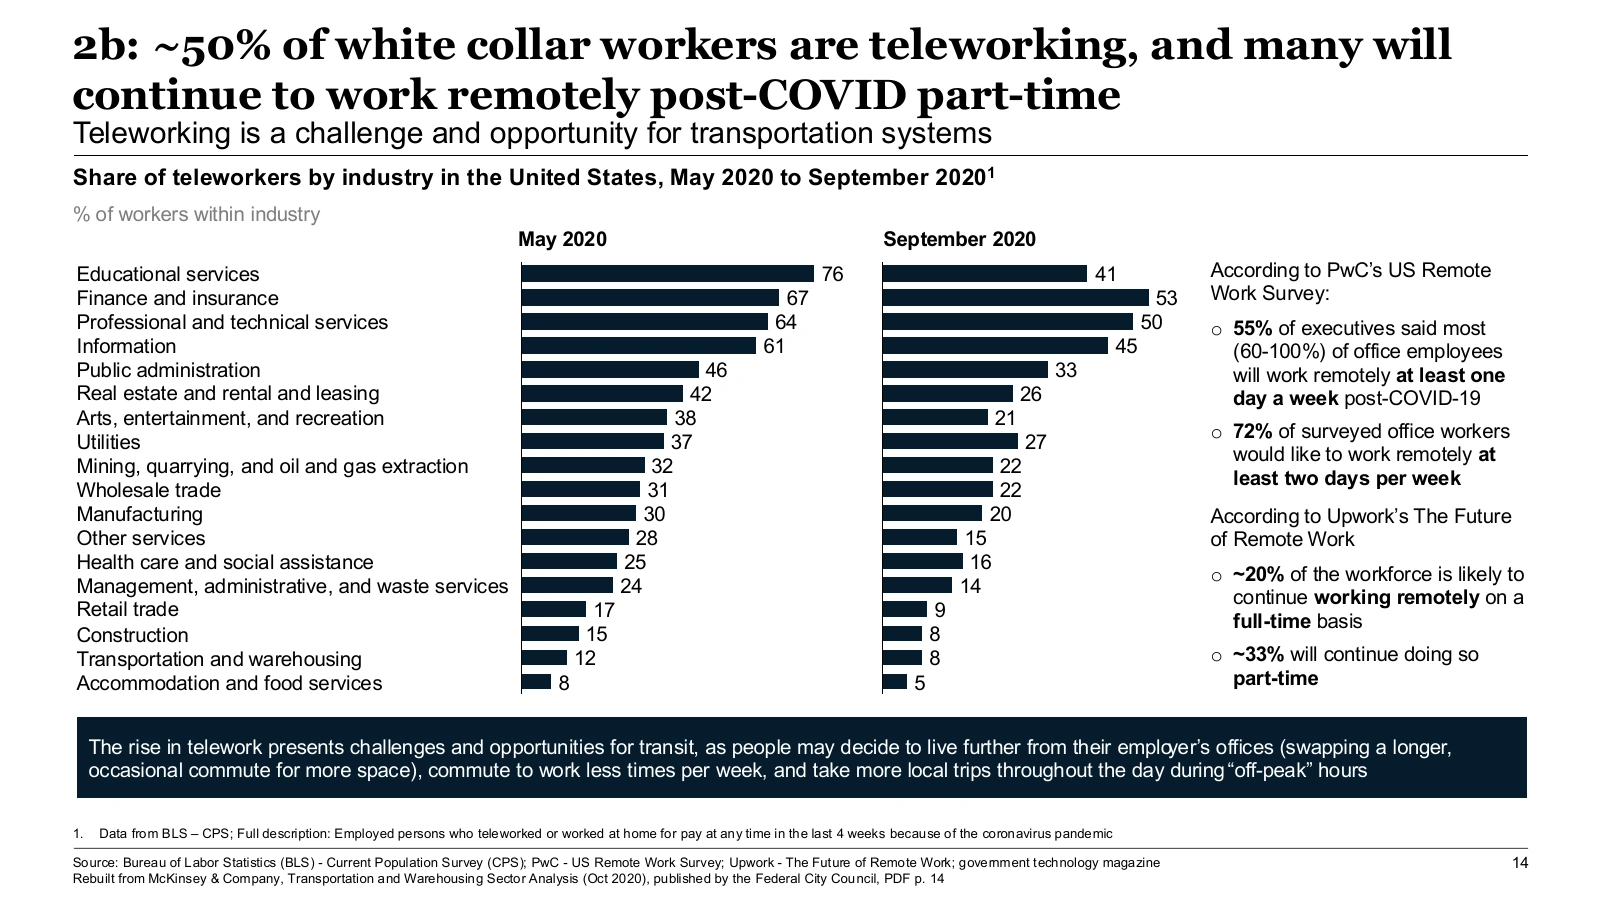
Two bar charts, May and September 2020, share one list of 18 industries. Reading across a row shows how much telework fell. The right-hand column holds survey results from PwC and Upwork. The dark bar along the bottom states what this means for transit.
6. The 2x2 matrix
Original, Federal City Council deck, p. 37.
Compound’s copy, opened in PowerPoint.
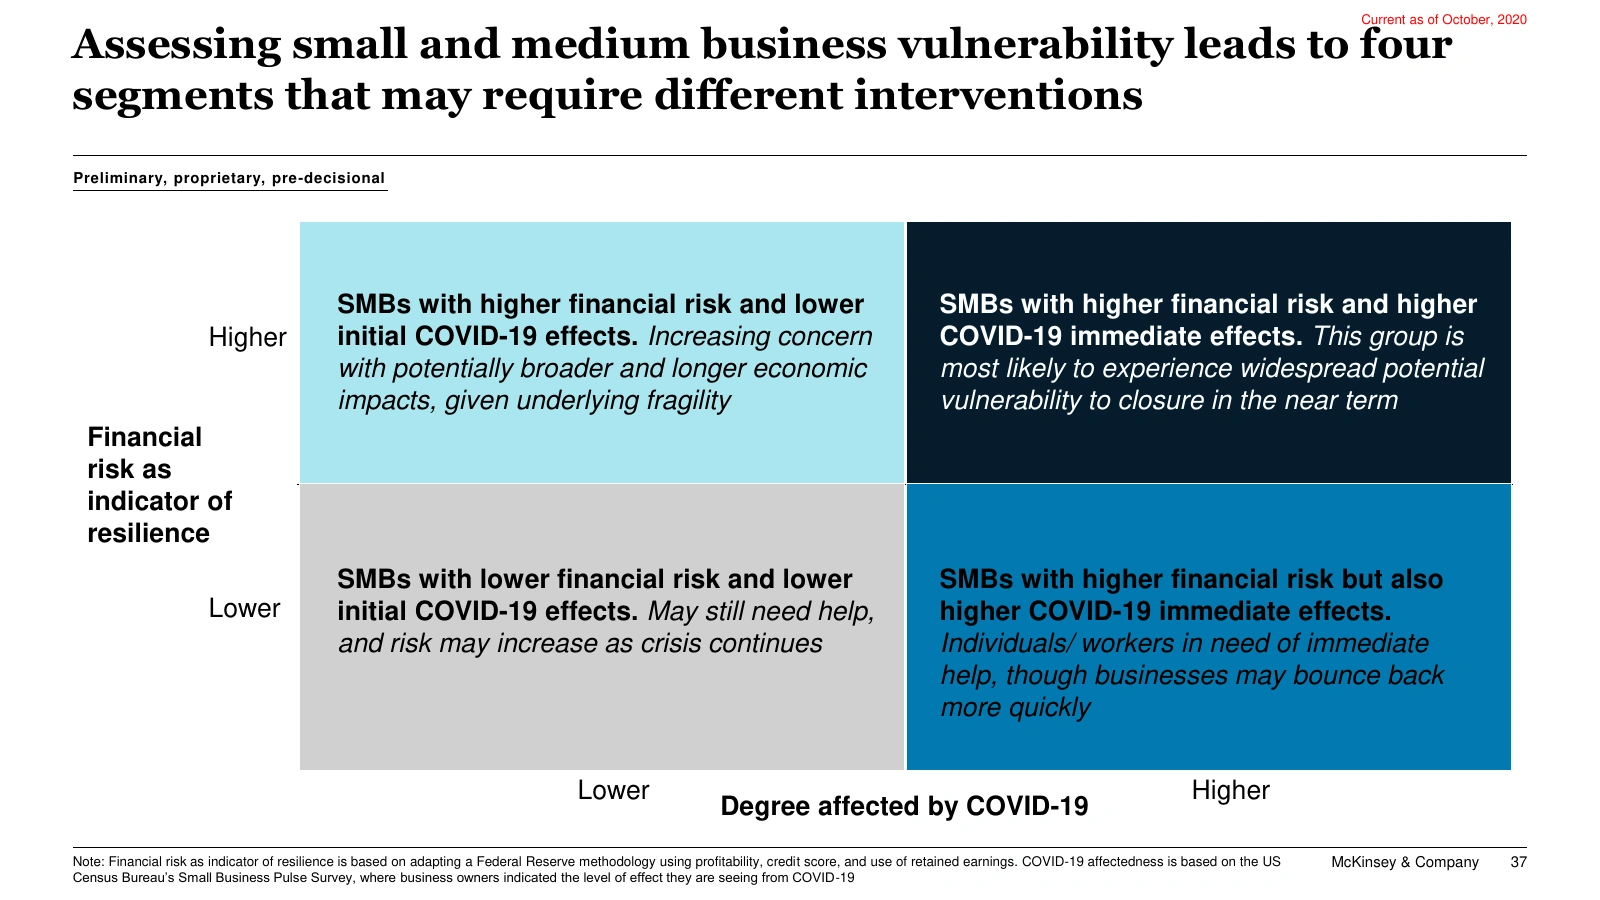
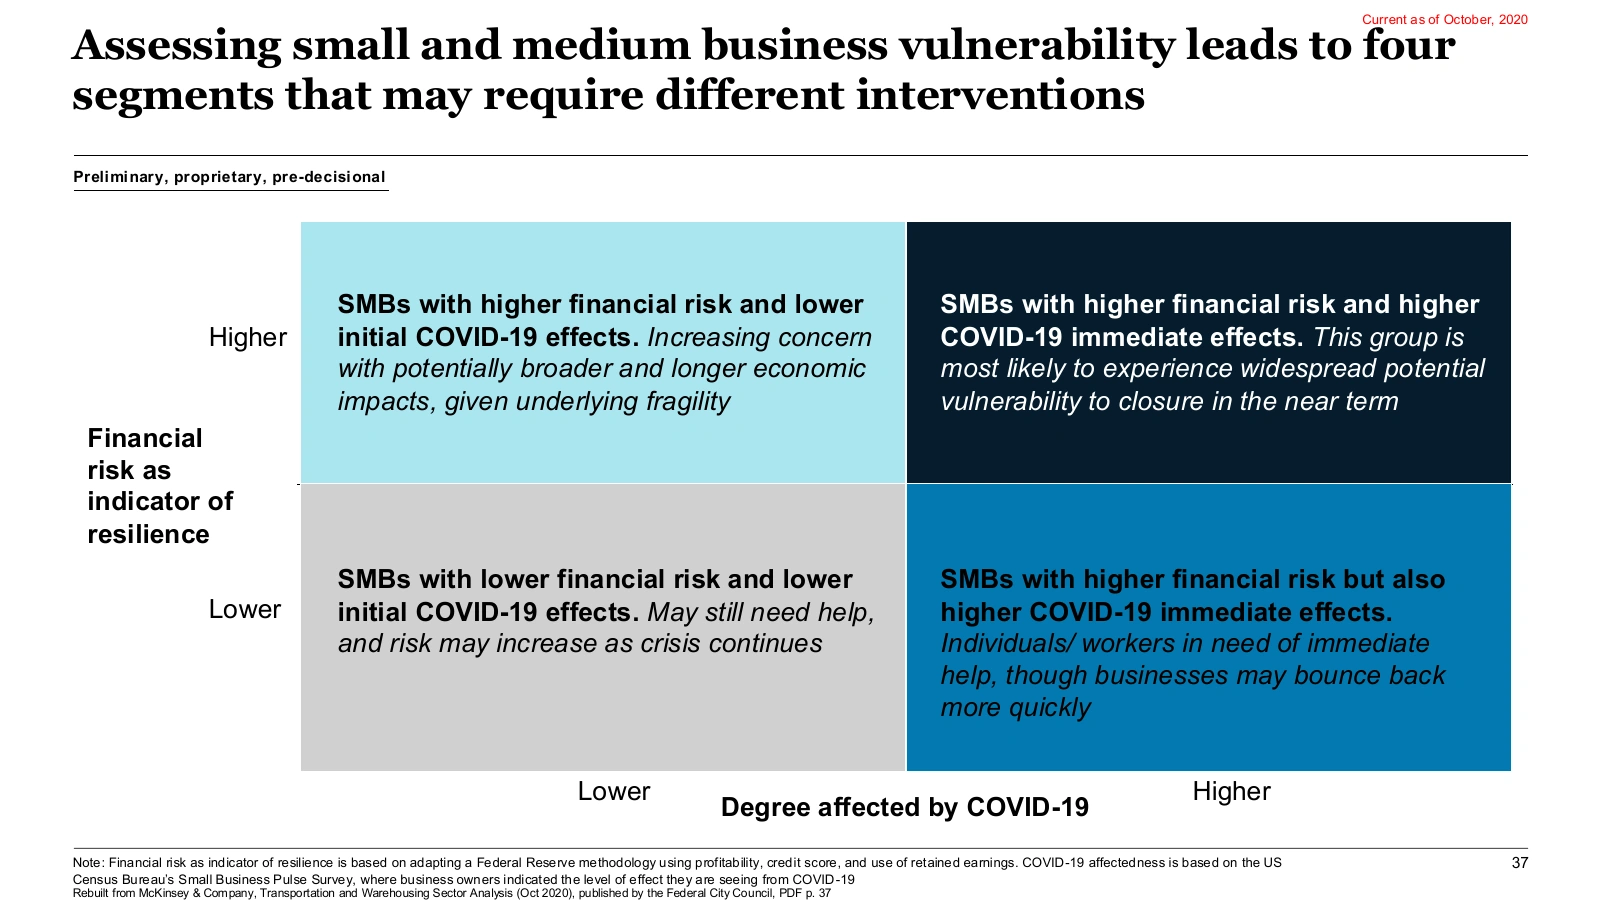
The axes are financial risk and how hard COVID-19 hit the business. Each quadrant has a bold segment name and an italic line on what that segment needs. The darker the quadrant, the more vulnerable the segment. A note under the matrix explains how each axis was measured.
7. Levers that add up to a total
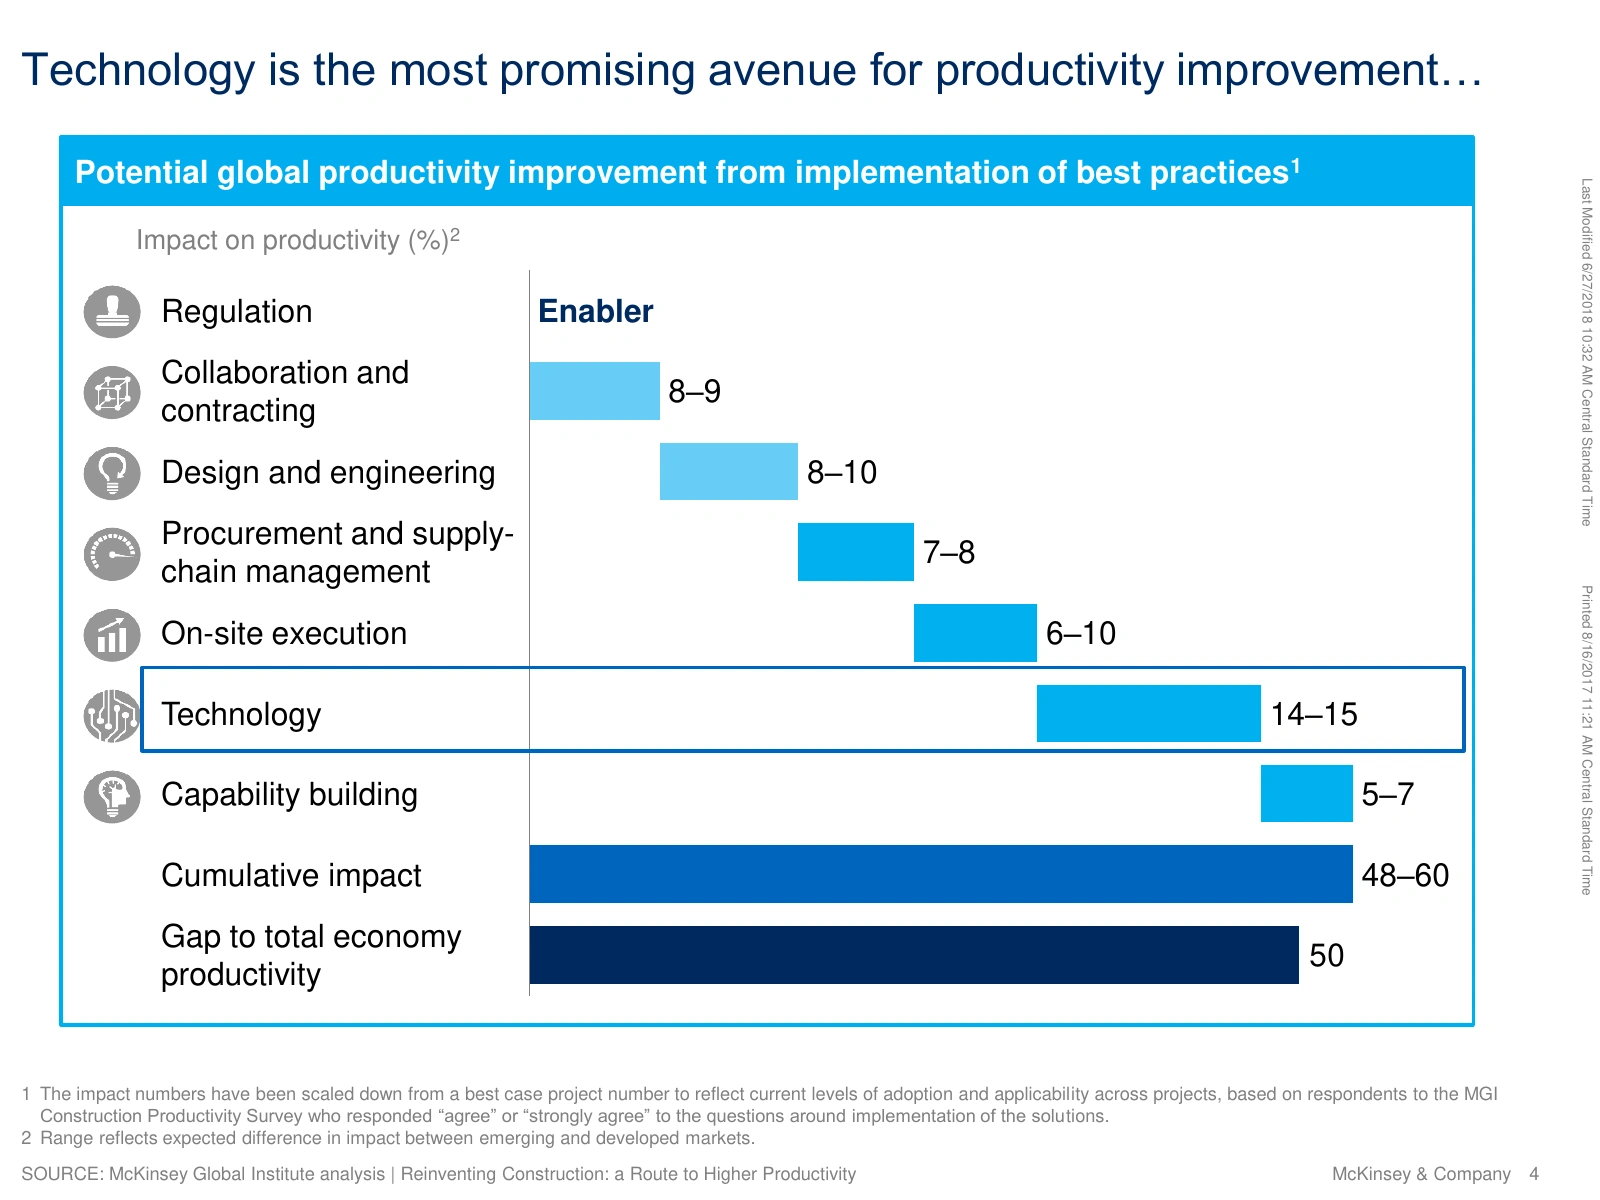
Original, CalPERS Board deck, p. 4.
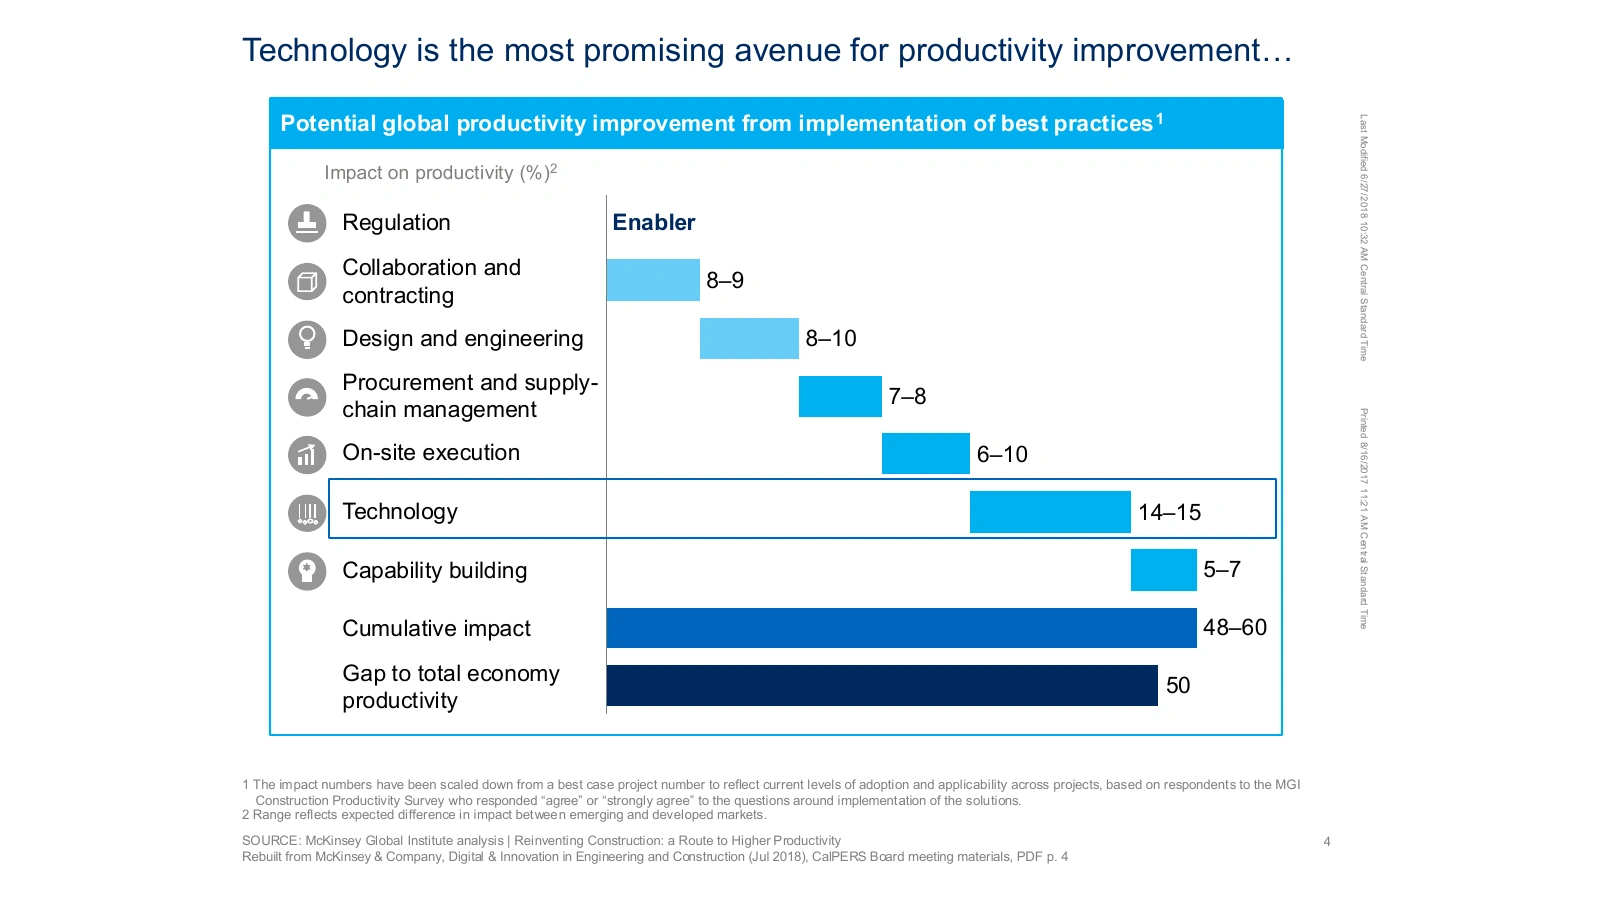
Compound’s copy, opened in PowerPoint.
Each lever’s bar starts where the previous one ends. Together they reach a 48–60% cumulative improvement, shown next to the 50% gap with the rest of the economy. Technology, the largest lever at 14–15%, sits in a box that matches the title. The ellipsis at the end of the title hands off to the next slide.
8. Forecast against capacity
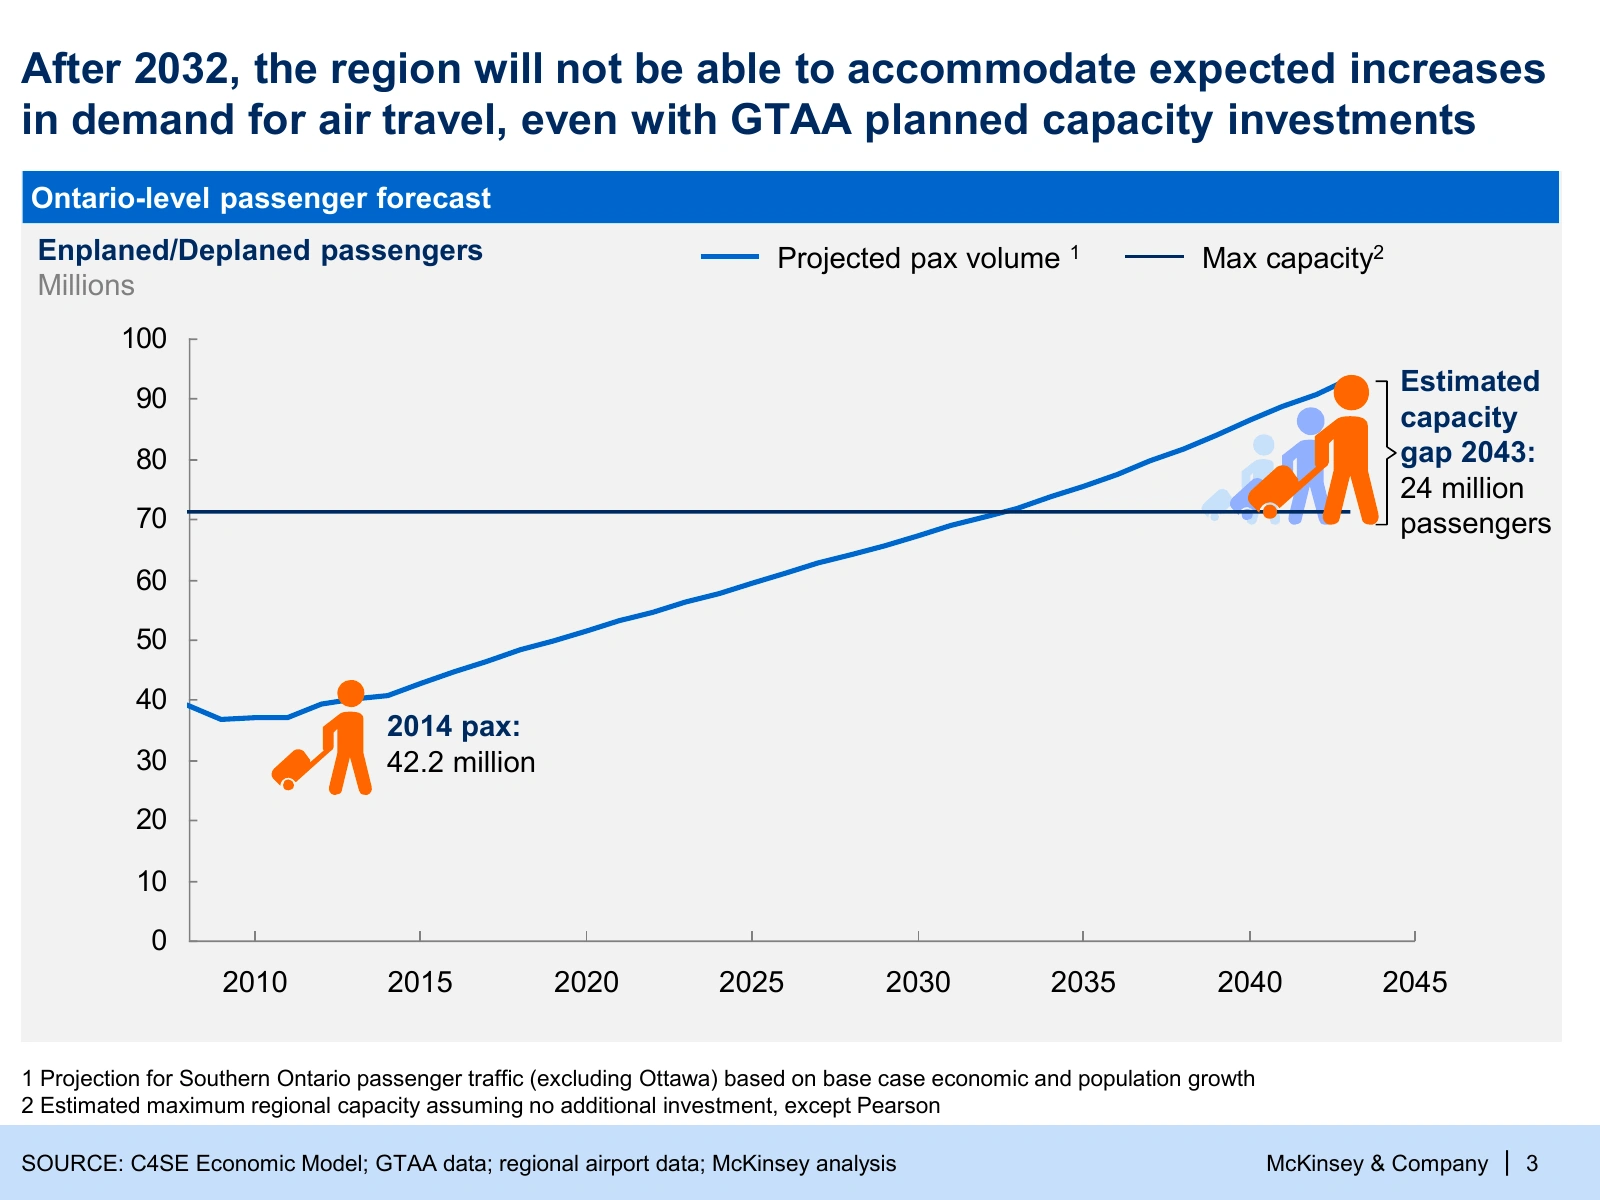
Original, ULI Toronto deck, p. 4.
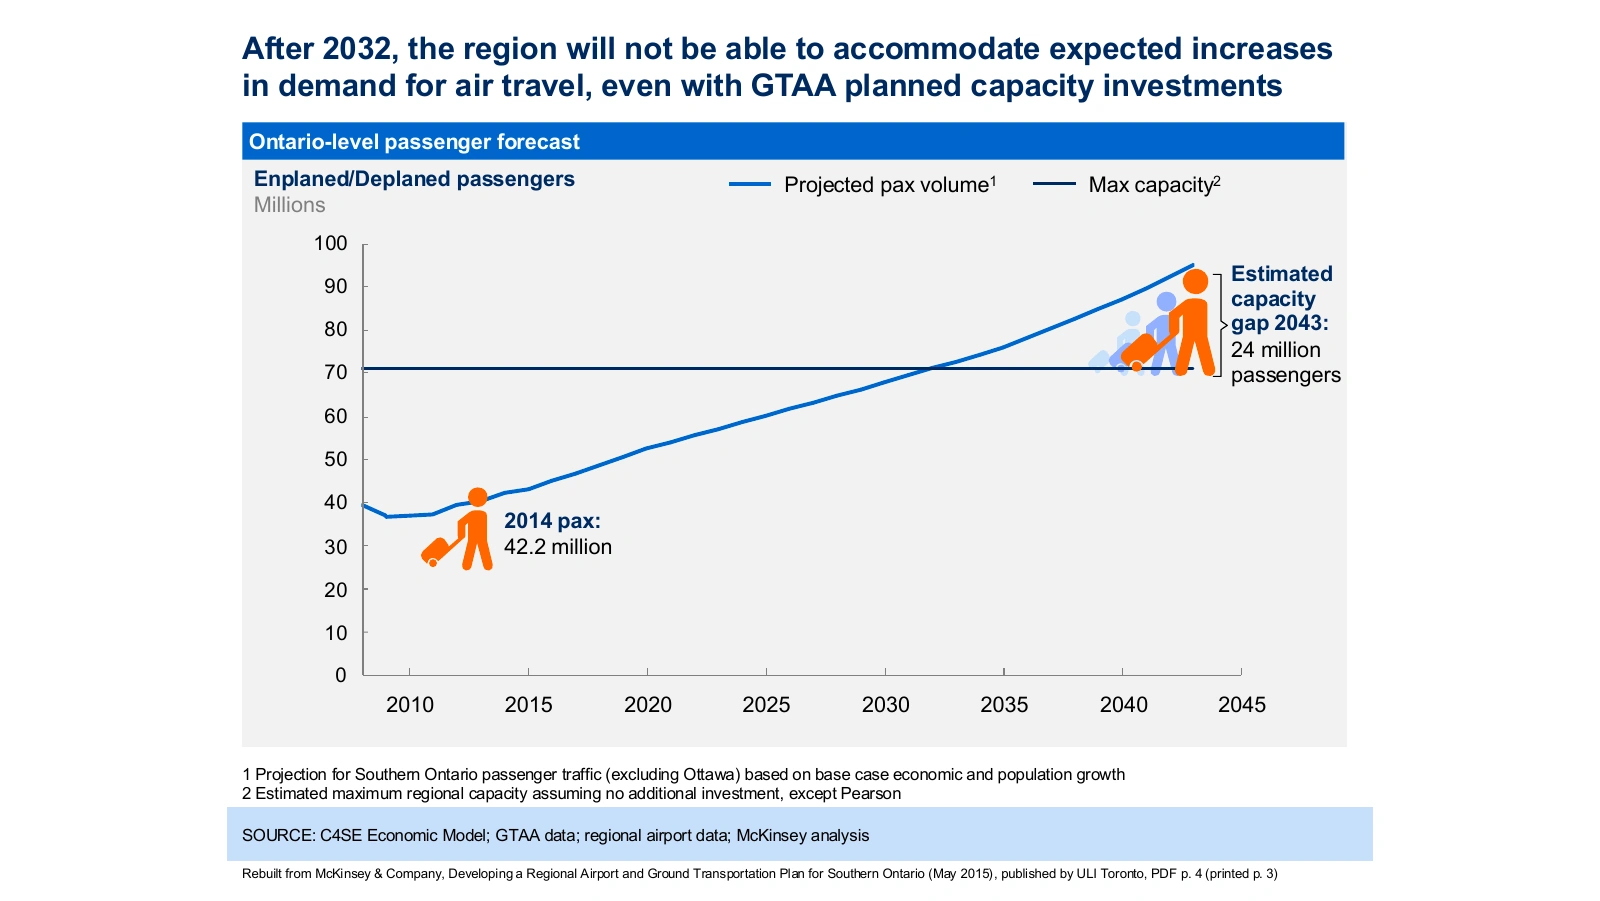
Compound’s copy, opened in PowerPoint.
Demand rises and crosses the flat capacity line in 2032, the year in the title. Only two values are labeled: 42.2 million passengers in 2014 and a 24 million gap in 2043. A bracket on the right marks the gap.
9. Numbered executive summary
Original, NGA deck, p. 2.
Compound’s copy, opened in PowerPoint.
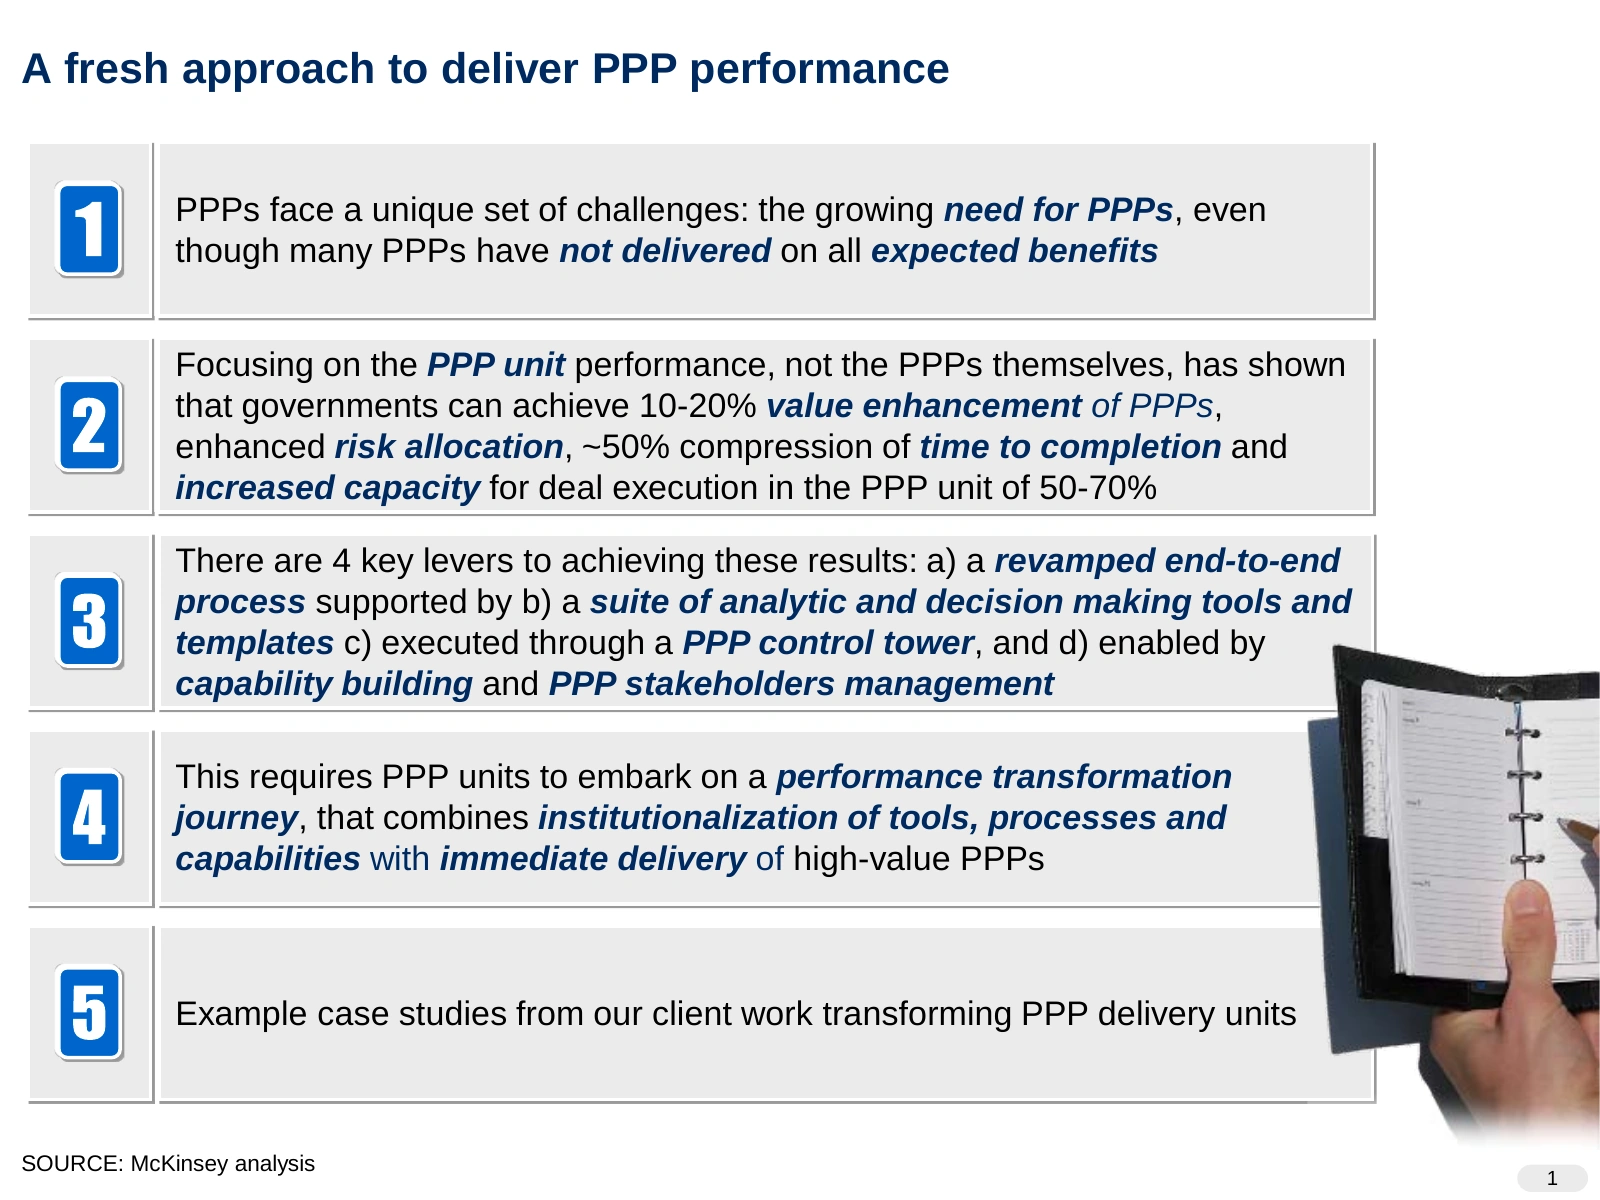
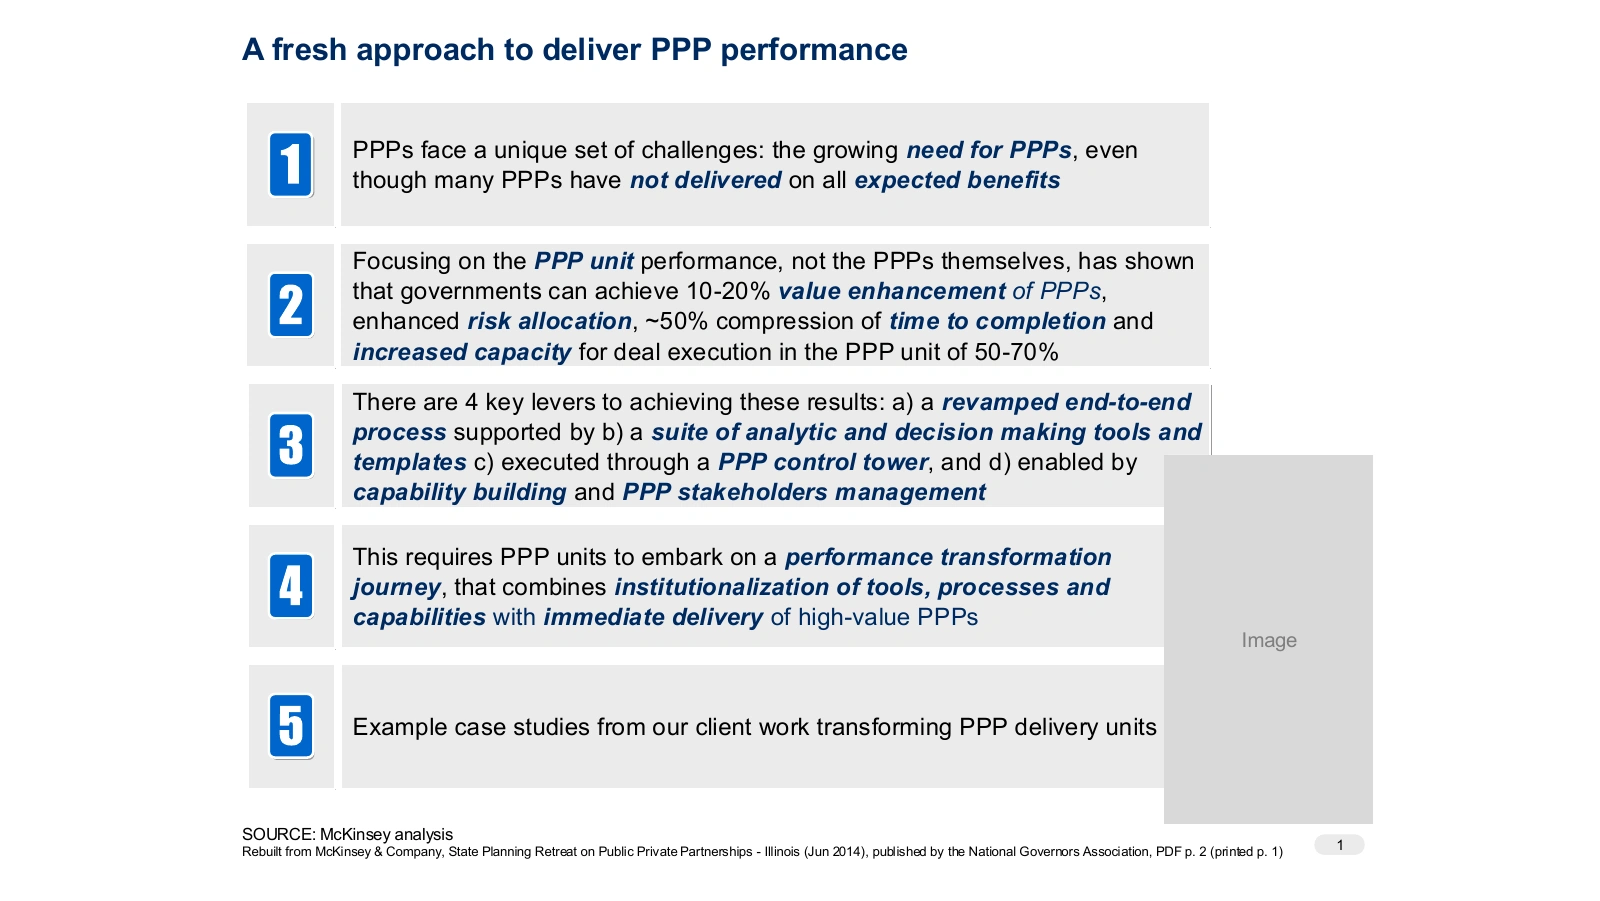
Five numbered rows: the problem, the proof, the approach, what it requires and client examples. The numbers come back later as trackers, like the “2” on slide 10. Bold italic picks out the phrases that carry the argument.
10. Value at stake, one row per case
Original, NGA deck, p. 8.
Compound’s copy, opened in PowerPoint.
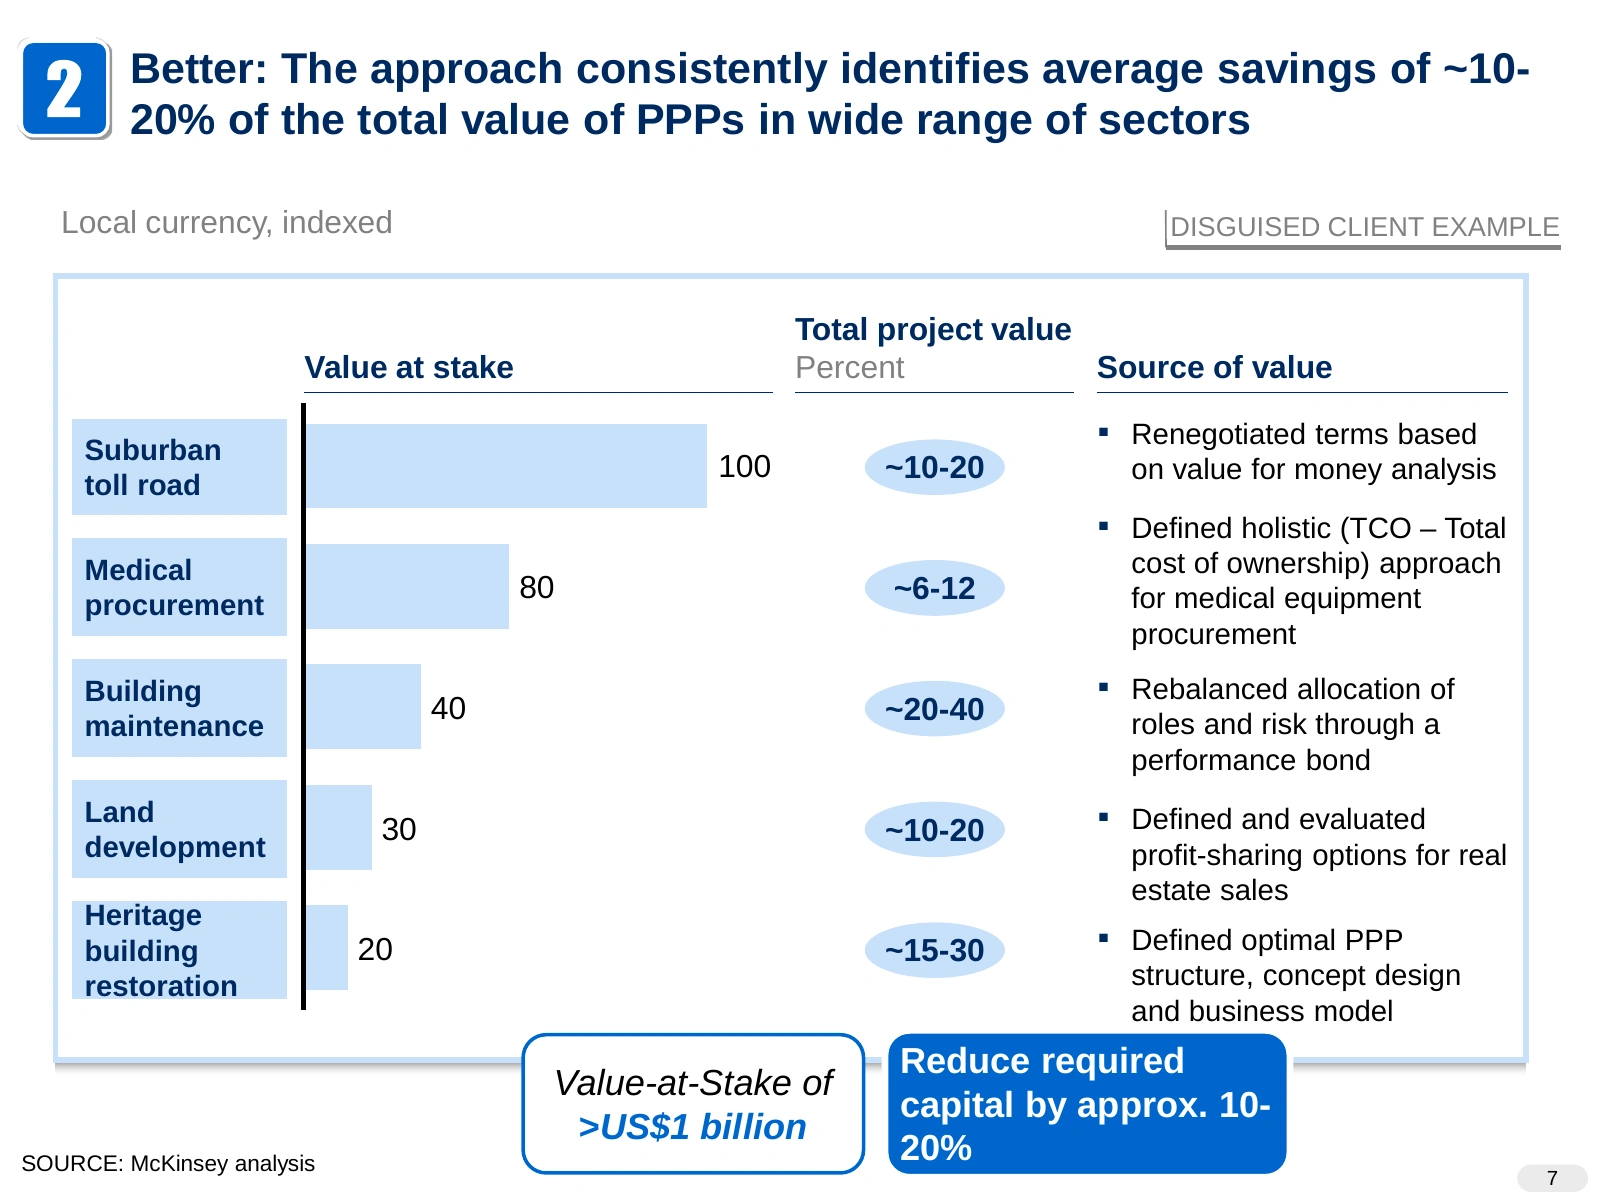
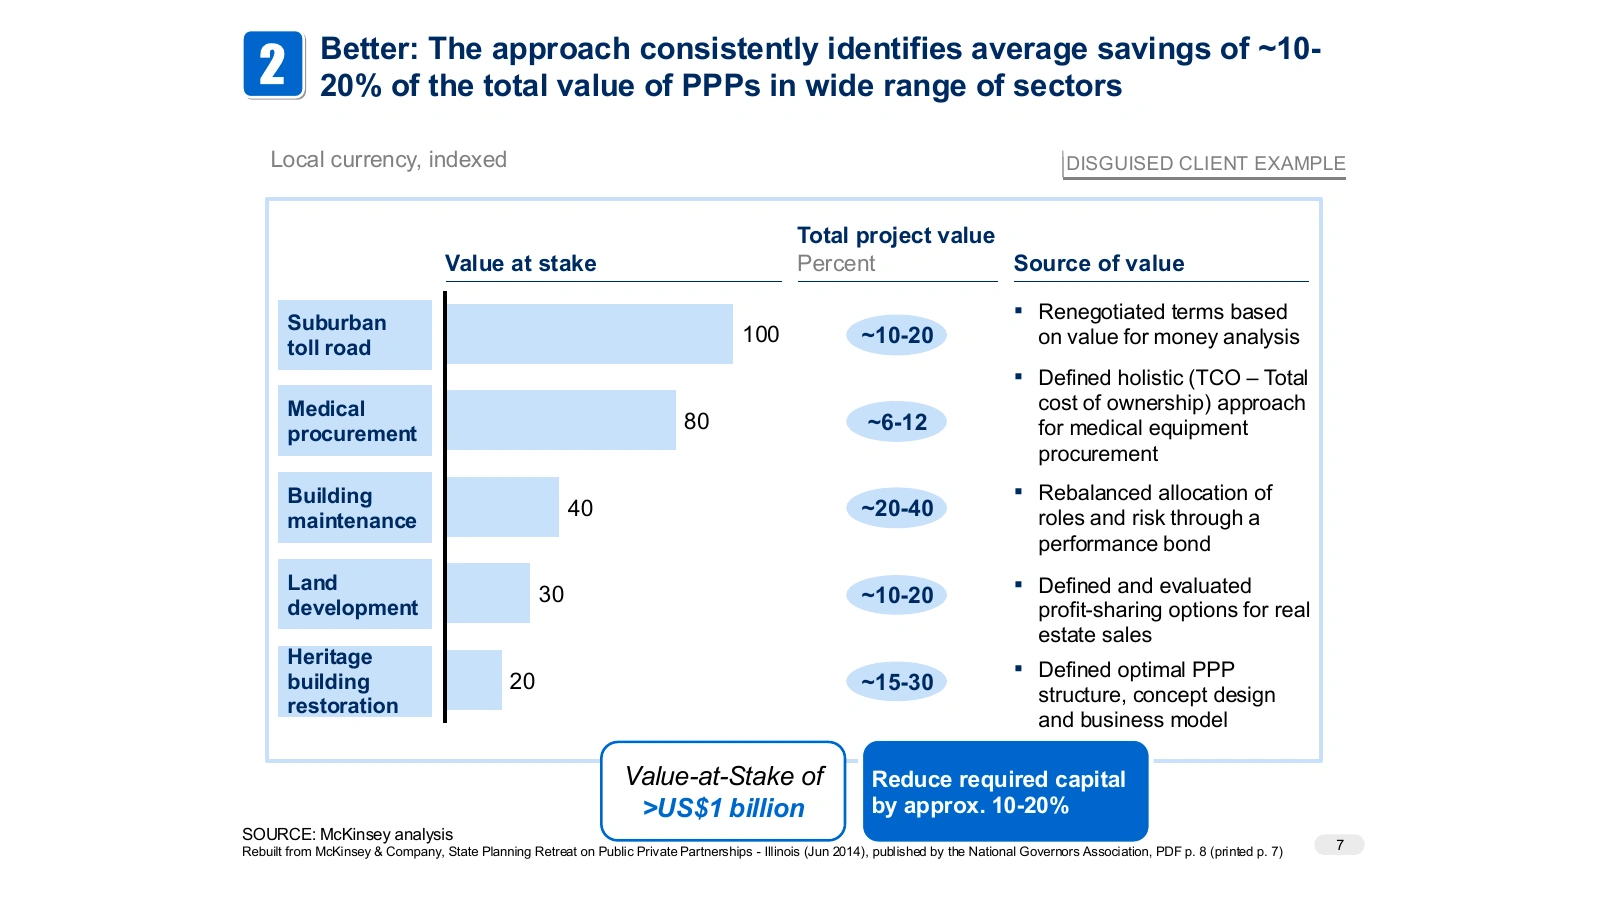
Each row is one disguised client case, with indexed value at stake, the savings range and what produced the savings. The two boxes below give the totals: more than US$1 billion at stake and 10–20% less capital required.
How the copies were made
Compound rebuilt each page as a PowerPoint slide. The charts are native PowerPoint charts with their data in the file, and every text box can be edited. We opened each copy in PowerPoint and checked it against the original page. Some of the original charts print no values, and for those the values were read off the chart. Georgia stands in for McKinsey’s headline typeface.
How to make slides like McKinsey
Write the conclusion in the title
Write the slide’s finding as a full sentence: “Transit and ground passenger transportation is by far the largest employer within this sector in DC.” “Employment by subsector” is a topic, and it tells the reader nothing. Read only the titles of a deck in order. They should tell the whole story.
Lead with the answer
Give the recommendation first, then the reasons, then the evidence. This is the pyramid principle. Slide 9 gives the answer and its reasons, and the slides after it prove each reason.
One point per slide
Everything on a slide supports its title. If a chart shows something the title doesn’t say, give it its own slide or cut it.
Split problems cleanly
Break a problem into parts that don’t overlap and leave nothing out. Consultants call this MECE. The six levers on slide 7 and the five rows on slide 9 follow it.
Add trackers
A label like “1b:” or a numbered box tells readers which section they are in. Use them in long decks and in pre-reads that nobody presents.
Match the chart to the comparison
Use bars to rank, lines for change over time, bubbles for two measures, a waterfall for parts of a total and a 2x2 for segments. Write labels on the data, then drop the legend, gridlines and axis if they add nothing.
Highlight one item
Give the item in the title the only accent color and keep everything else neutral, as on slides 1 and 4.
Spell out the implication
Close with one sentence on what the evidence means for the reader, in a box or a bar. Slides 1, 5 and 10 do this.
Source every number
Number the footnotes and put a source line on every slide. Anyone should be able to check a figure without asking you.
Use one grid
Keep titles, charts, notes and sources in the same position on every slide, with one title font and one body font.
FAQ
Are these real McKinsey slides?
Yes. They come from McKinsey & Company client decks published by the Federal City Council, the CalPERS Board of Administration, ULI Toronto and the National Governors Association. The table above links to each PDF.
What font does McKinsey use in its slides?
Recent McKinsey decks set titles in McKinsey’s own serif headline typeface and body text in Arial, as on the 2020 Federal City Council slides. The 2014 and 2015 decks above use Arial throughout. Georgia is a close, widely installed stand-in for the serif titles.
What is an action title?
An action title is a slide title written as a full-sentence conclusion, such as “WMATA has seen record low ridership that is just beginning to recover”. The rest of the slide proves that sentence.
How do I make slides like McKinsey in PowerPoint?
Put the conclusion in the title. Use one chart that proves it, write labels on the data and highlight only what the title names. Add a one-line takeaway, then numbered footnotes and a source line. The ten editable slides above are a place to start.
Can I use these slides?
The download is a recreation for learning slide design. The original decks belong to McKinsey & Company and the organizations that published them. Cite them if you reuse their content.