Finance AI Vendors Hold 18% of the Seat Market and 0.3% of Finance Payrolls
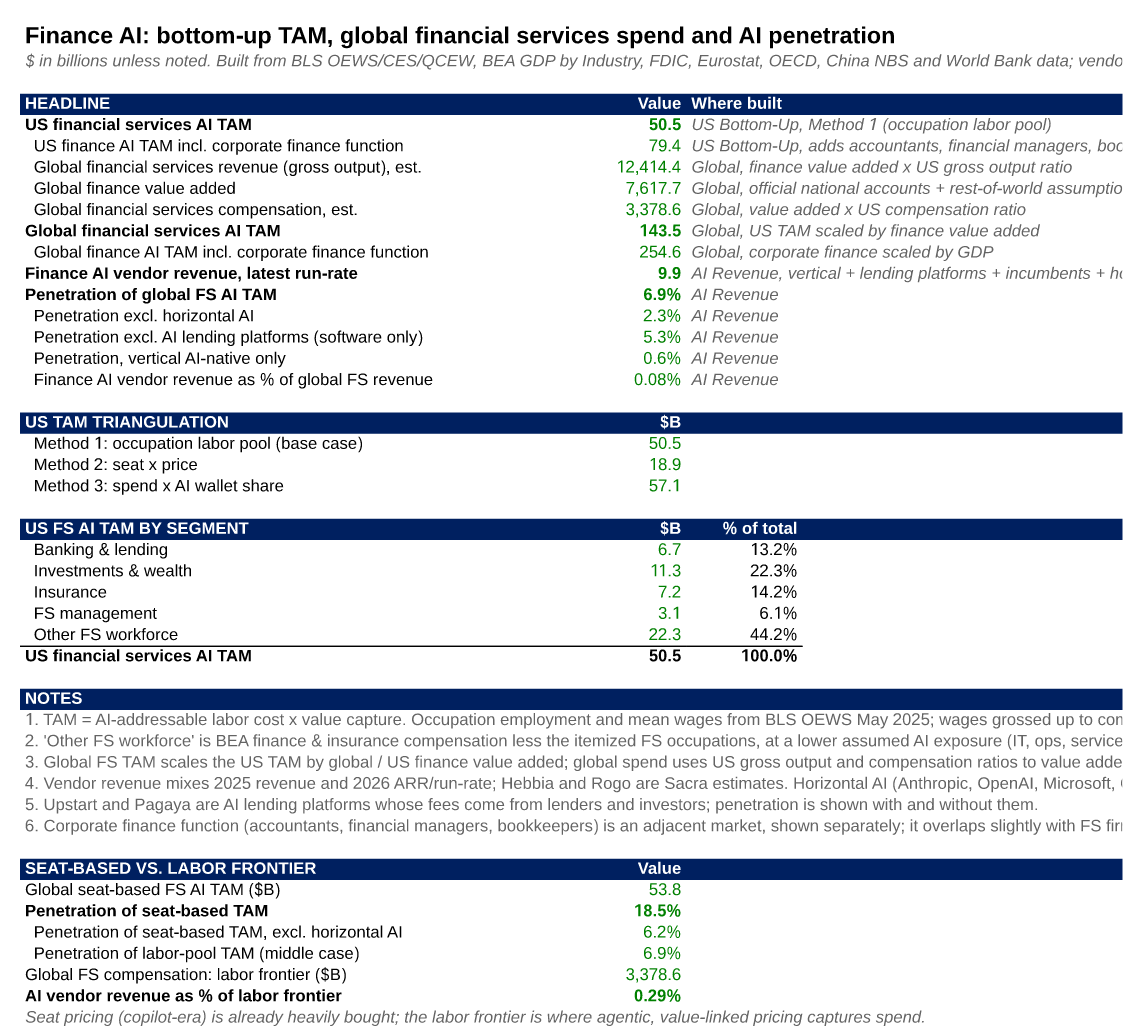
Finance AI vendors book about $9.9 billion a year: roughly 18% of a $54 billion seat-based market, but 0.3% of the $3.4 trillion finance pays its workers. Our BLS and BEA-based model puts the middle case at $143 billion, 6.9% penetrated.

AI vendors selling to banks, insurers and asset managers book about $9.9 billion a year. Priced the way most finance AI is sold today, by the seat, that is already about 18% of a $54 billion global market. Measured against what finance pays its people, an estimated $3.4 trillion a year, it is 0.3%.
Copilot-style seats are already widely bought. The larger spend is on agents that do work finance firms now pay salaries for. Our bottom-up model, built from BLS and BEA data, puts the middle case at a $143 billion global market, in which vendors capture 15% of the labor cost AI can address. Vendors are 6.9% of the way there.
Anthropic's S-1, filed Oct. 26, lists the 10 largest banks among customers paying it at least $100,000 a year. OpenAI launched ChatGPT for Financial Services on Sept. 10 with Morgan Stanley and Evercore as design partners, CNBC reported. US finance and insurance employment fell by 97,000 in the year to October, to 6.64 million, according to BLS payroll data; insurance carriers alone shed 3.0% of their jobs.
Seat-based market vs. the labor frontier
| Market measure | Size ($B) | AI vendor revenue as % |
|---|---|---|
| Seat-based TAM (copilot-style pricing) | 54 | 18.5% |
| Seat-based TAM, excluding general-purpose labs | 54 | 6.2% |
| Labor-pool TAM (15% of AI-addressable labor cost) | 143 | 6.9% |
| Global FS compensation | 3,379 | 0.29% |
| Global FS operating cost base (compensation + purchased services) | 8,088 | 0.12% |
Global financial services AI market by method, against $9.9B of identified finance AI vendor revenue. Seat and labor-pool TAMs scale US builds by global finance value added. Source: BLS, BEA, OECD, World Bank, company releases, Compound analysis.
Excluding the general-purpose labs, specialist vendors hold about 6% of the seat market, and finance-specific startups about 1.6%.
Compensation is a better ceiling than revenue. Much of the industry's $12.4 trillion of revenue is interest and insurance premiums, which AI does not replace: FDIC-insured banks earned $1.24 trillion of interest income in 2025 against $338 billion of noninterest income. BEA puts US finance and insurance compensation at $1,192 billion in 2025; worldwide it is about $3.4 trillion.
Much of the value will not show up as seat revenue. Upstart and Pagaya charge a share of loan volume rather than per seat, and banks build heavily in-house: IDC put banks' total AI spending at $31.3 billion in 2024, about three times the vendor revenue we can identify.
How we sized the US market
The BLS Occupational Employment and Wage Statistics for May 2025 count 361,980 financial and investment analysts at a mean wage of $116,800, 489,570 securities and financial services sales agents, 274,330 loan officers and 324,230 insurance claims adjusters, among 17 finance occupations. Their wage bill is $363 billion.
We grossed wages up to full compensation using the ratio of BEA finance and insurance compensation ($1,192 billion in 2025) to QCEW wages ($966.7 billion), or 1.23x. Each occupation gets an AI task exposure, from 30% for tellers and insurance agents to 60% for loan and claims clerks, and we assume vendors can charge 15% of the labor cost AI can address. The rest of the finance workforce, $744 billion of compensation in IT, operations, customer service and management, is counted at 20% exposure.
That gives a US financial services AI TAM of $50.5 billion a year, about 4.2% of the industry's compensation and 1.2% of its $4.38 trillion revenue.
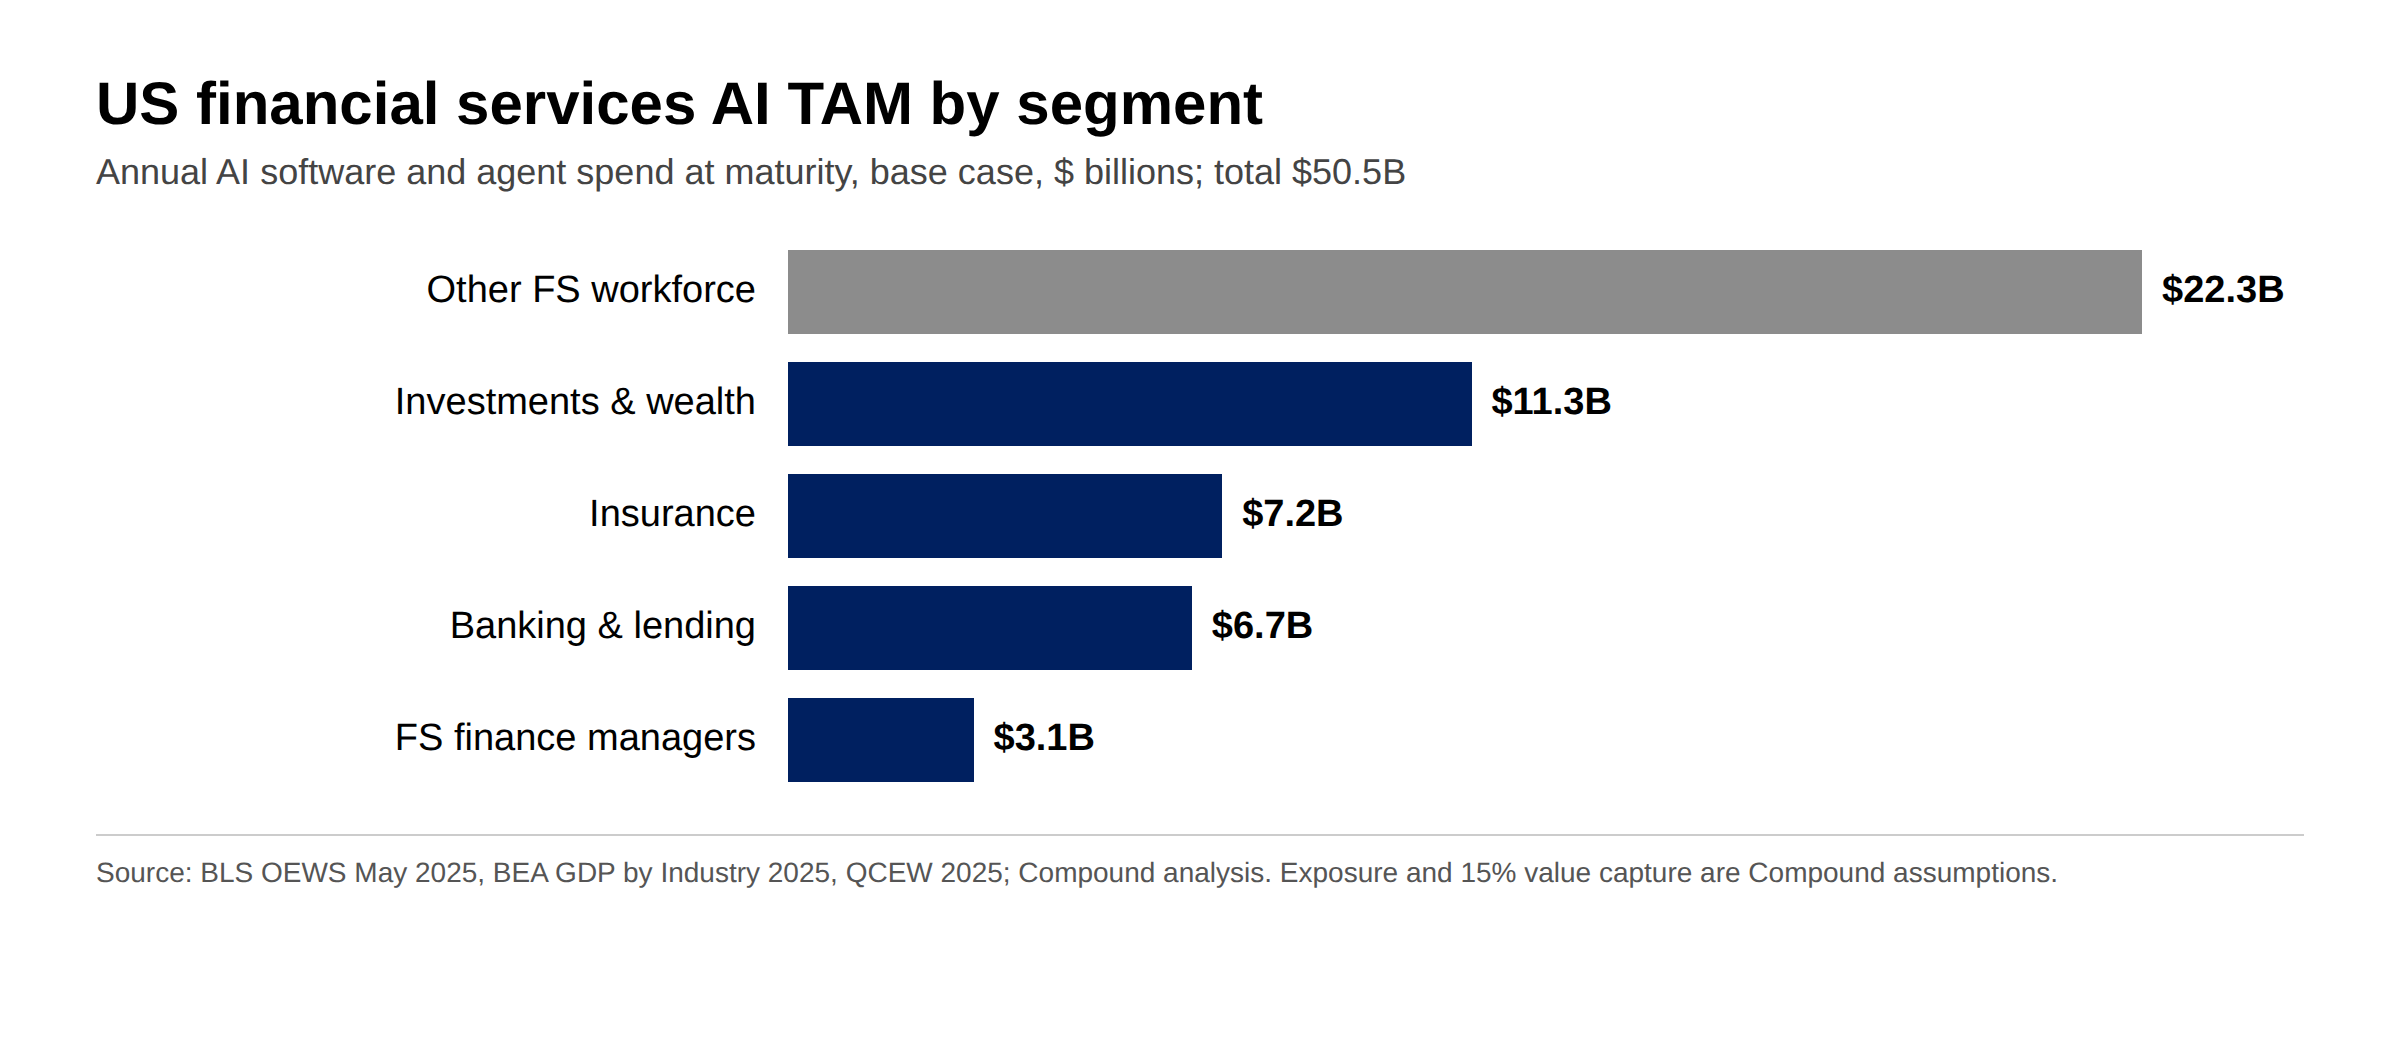
Two other methods bracket it. Pricing AI by the seat, at 70% to 90% adoption across banking, securities and insurance and a blended $3,875 per seat, gives $18.9 billion. Rogo charges about $3,300 a seat, per Sacra, and Microsoft 365 Copilot lists at $30 a user per month. Taking 2% of the industry's $2.85 trillion of compensation and purchased services gives $57.1 billion. The seat model comes in lowest because per-seat pricing captures copilot spend, while agents that do paid work get priced against labor.
| Method | US TAM ($B) | Basis |
|---|---|---|
| Occupation labor pool (base case) | 50.5 | BLS OEWS headcount and wages, BEA compensation |
| Seat x price | 18.9 | 6.64M BLS payroll jobs, 74% adoption, $3,875/seat |
| Spend x AI wallet share | 57.1 | 2% of BEA compensation + purchased services |
US financial services AI TAM by method, 2025 data. Source: BLS, BEA, Compound analysis.
Adding the corporate finance function outside financial firms, including 1.45 million accountants and auditors and 1.37 million bookkeeping clerks, lifts the US figure to $79.4 billion.
Global financial services spend
Finance added about $7.6 trillion to the world economy in 2025, roughly 6.4% of the $118.35 trillion of global GDP the World Bank reports. The US accounts for 35%: BEA puts US finance and insurance value added at $2,687.6 billion, 8.7% of GDP. Finance is 4.6% of EU output (Eurostat, 2024) and 7.2% of China's GDP (NBS, CNY 10,133.7 billion in 2025). Eleven more economies come from OECD national accounts; for India, Brazil and the rest we assume 5% of GDP.
| Economy | Finance share of output | Finance value added ($B) |
|---|---|---|
| United States | 8.7% | 2,680 |
| China | 7.2% | 1,409 |
| European Union | 4.6% | 975 |
| United Kingdom | 8.1% | 325 |
| Japan | 4.4% | 196 |
| Canada | 6.7% | 155 |
| Australia | 7.8% | 140 |
| Rest of world (assumed) | 5.0% | 1,293 |
| World | 6.4% | 7,618 |
Finance value added, latest official share applied to 2025 GDP in US dollars. Source: BEA, Eurostat, China NBS, OECD, World Bank, Compound analysis.
Applying US ratios to that base puts global financial services revenue at about $12.4 trillion and compensation at about $3.4 trillion. Scaling the US TAM by global finance value added (2.84x) gives the $143.5 billion global AI TAM; with the corporate finance function, $254.6 billion.
Key players
We identified $9.9 billion of AI revenue from financial customers. AI lending platforms are the largest disclosed piece: Upstart reported $1.0 billion of 2025 revenue and Pagaya $1.30 billion. AlphaSense passed $600 million of ARR in the first quarter of 2026, and we count half as financial services. Sacra estimates Rogo at $53 million of ARR and Hebbia at $48 million (both unconfirmed by the companies). Jump serves 27,000 financial advisors. We count 20% of CCC Intelligent Solutions' $1.057 billion of revenue as AI claims work.
The largest line is an estimate. Anthropic's run-rate revenue reached about $47 billion by late May, Forbes reported. If 8% comes from financial firms, and OpenAI, Microsoft and Google together earn 75% as much from finance, the general-purpose labs take $6.6 billion, two-thirds of the total. Neither company breaks out revenue by industry.
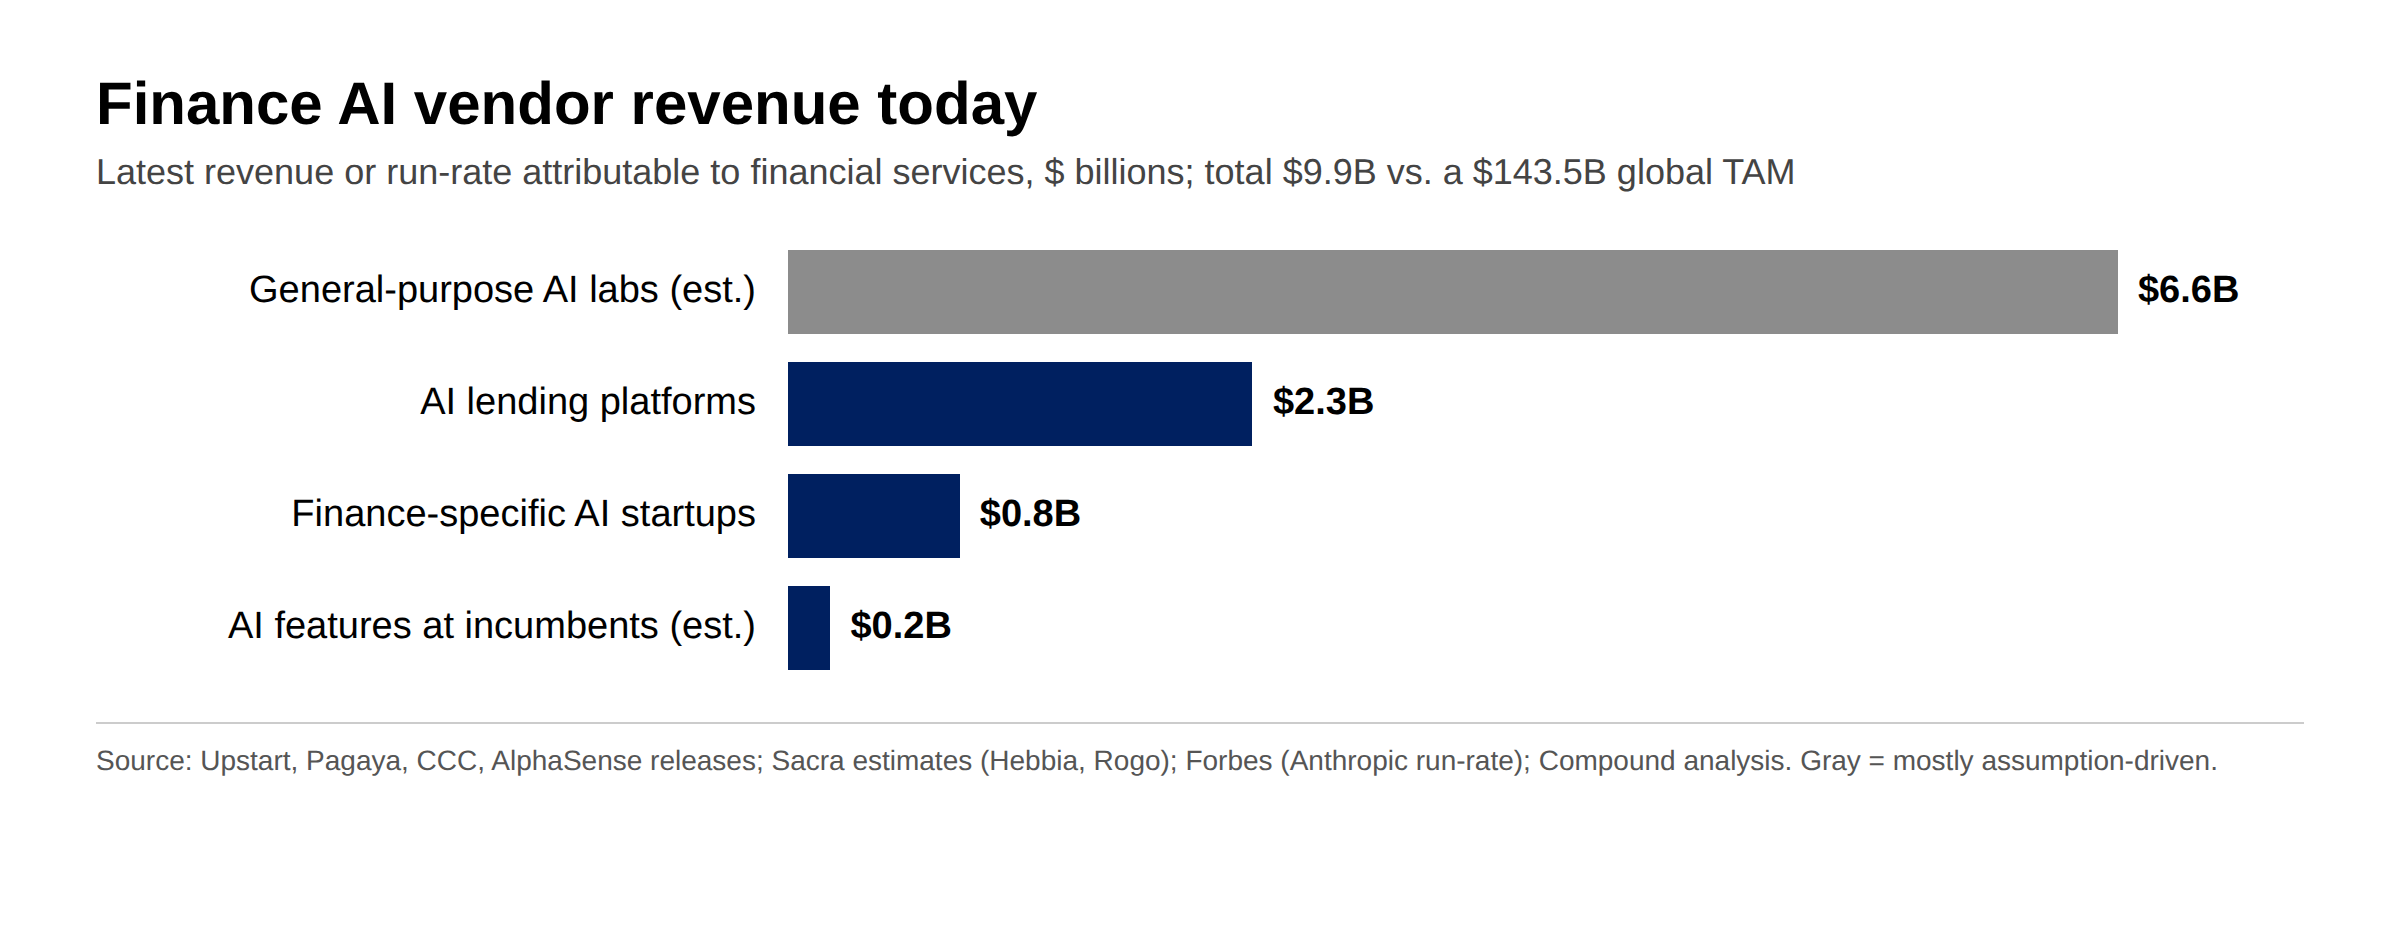
| Measure | Value |
|---|---|
| Global FS AI TAM | $143.5B |
| Identified finance AI vendor revenue | $9.9B |
| Penetration of seat-based TAM ($53.8B) | 18.5% |
| Penetration of labor-pool TAM, all vendors | 6.9% |
| Excluding AI lending platforms | 5.3% |
| Excluding general-purpose labs | 2.3% |
| Finance-specific AI startups only | 0.6% |
| AI vendor revenue / global FS revenue | 0.08% |
Penetration of the global financial services AI TAM. Vendor figures mix 2025 revenue and 2026 run-rates. Source: company releases, Sacra, Forbes, Compound analysis.
Sensitivity table
| AI value capture | 0.75x exposure | 0.90x | 1.00x | 1.10x | 1.25x |
|---|---|---|---|---|---|
| 10.0% | $72B | $86B | $96B | $105B | $120B |
| 12.5% | $90B | $108B | $120B | $132B | $149B |
| 15.0% | $108B | $129B | $143B | $158B | $179B |
| 17.5% | $126B | $151B | $167B | $184B | $209B |
| 20.0% | $143B | $172B | $191B | $210B | $239B |
Global financial services AI TAM by the share of AI-addressable labor cost vendors capture (rows) and a scalar on occupation-level task exposure (columns). Base case: 15% and 1.00x.
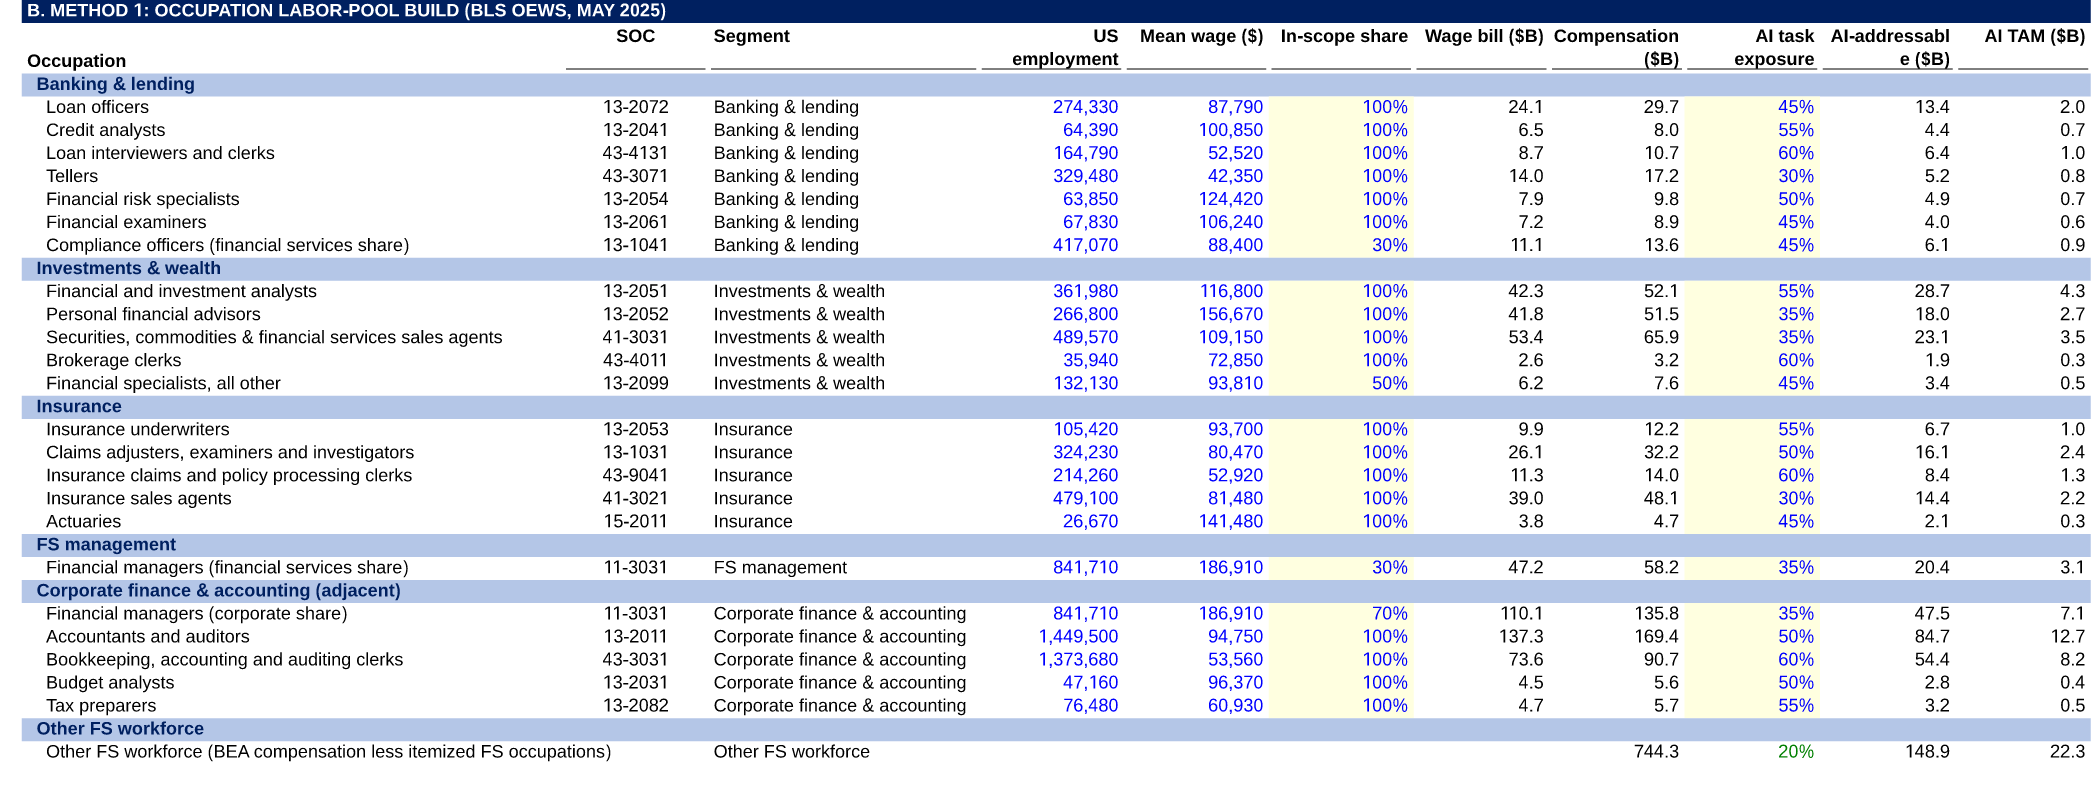
 Download the finance AI TAM model (Excel)Our bottom-up model of the financial services AI market: BLS occupation build, seat and wallet-share cross-checks, global finance spend by economy, and vendor penetration. Every assumption is editable, with sensitivities as Excel data tables.Download · Free
What to watch
- Dec. 4: the BLS November jobs report, the next read on finance and insurance payrolls after a 97,000 drop in the year to October.
- Anthropic's Nasdaq listing (ticker ANT): any industry revenue mix in its amended filings would replace our largest assumption.
How we estimated this: headcount, wages, compensation, output and value added come from BLS, BEA, Eurostat, China NBS, OECD and the World Bank, linked above, using 2025 data where published. Vendor revenue comes from company releases, Sacra estimates and press reports. AI task exposure by occupation, the 15% value capture, seat adoption and prices, the 5% rest-of-world finance share, the labs' financial services share, the long tail of unlisted vendors and CCC's AI share are our assumptions, all editable in the model. We used the same market-sizing approach in our China drugs and peptides TAM; for how much banks depend on their technology stack, see our Chase and Wells Fargo outage coverage.
More from Compound News

Legal AI has sold 10% to 13% of its seat market. Legal spend is $1.1 trillion
Legal AI vendors run at about $1.67 billion a year, 13% of a $12.6 billion seat-based market and 10% of a labor-value build. Against the $1.13 trillion spent on legal work outside China, it is 0.15%.
Read article →
Compound forecasts Nvidia Q3 revenue of $112.1 billion, above the $109.0 billion consensus
Nvidia reports Tuesday, its first quarter since Jensen Huang resigned. Our model puts revenue 2.9% above consensus and EPS at $2.58 against $2.48. China-headquartered customers were 8.2% of Q2 revenue.
Read article →
OpenAI breaks up its robotics team for the second time, betting GPT-6 Astra can run robots
OpenAI moved its robotics researchers under research chief Mark Chen and its robot hardware staff under president Greg Brockman, Fortune reported Nov. 13. It is the company's second robotics breakup since 2020. OpenAI says robotics work continues and a humanoid demo is still targeted for 2027.
Read article →