Tankers burn in Hormuz again. What oil could cost if the strait shuts
Iranian state media reported three tankers on fire in the eastern Strait of Hormuz on Wednesday (unconfirmed), and the Houthis claimed strikes on Saudi sites. Brent settled at $91.95. Re-anchored to that price, our model puts Brent near $106 in a sustained mine campaign and $125 if Gulf losses return to spring levels.
We built this oil scenario model in Compound from EIA, IEA and market data. Change the shut-ins and probabilities and rerun it yourself. Try Compound free, no credit card needed.
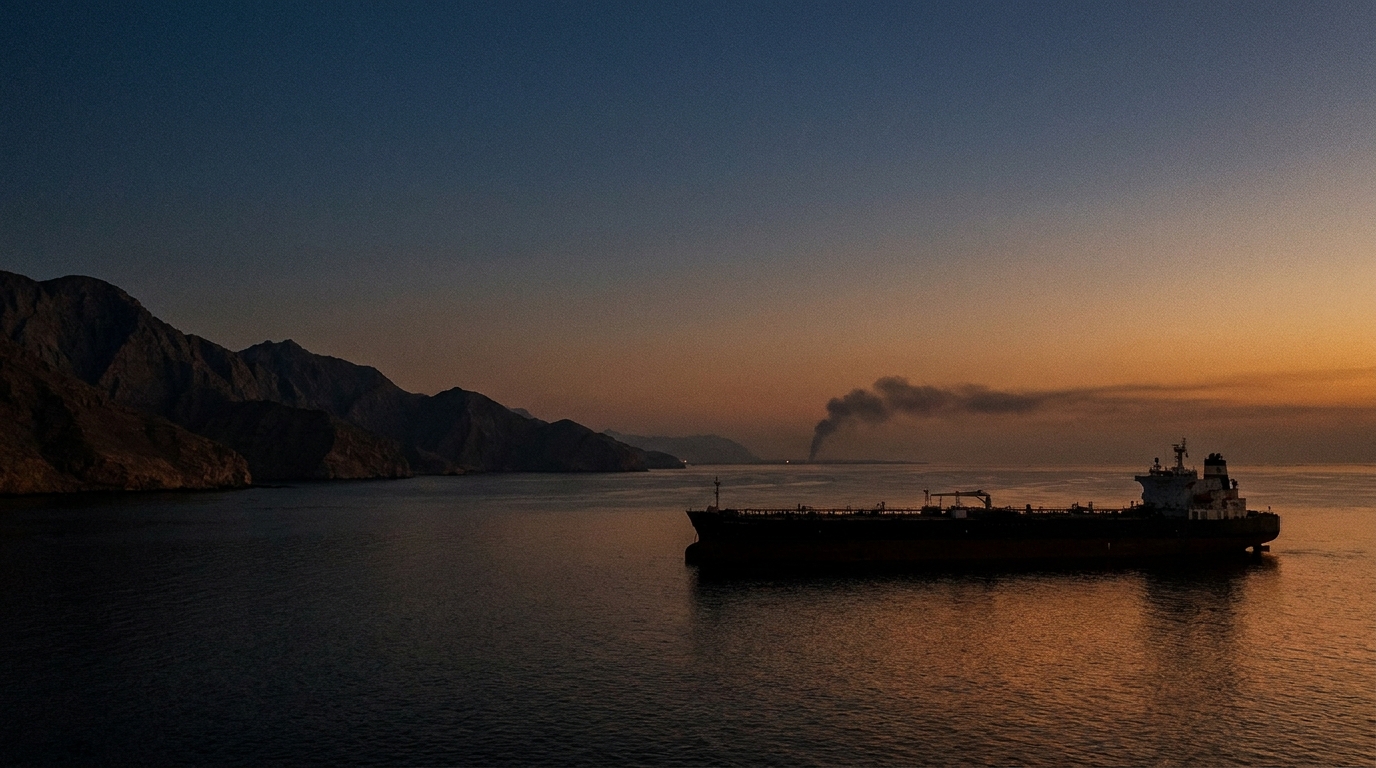
Three oil tankers caught fire in the eastern Strait of Hormuz on Wednesday, Nov. 18, Iranian state broadcaster IRIB reported, via FirstSquawk (unconfirmed). Separately, a Houthi spokesman claimed missile and drone strikes on Saudi sites at Jizan and the Khamis Mushait air base, FirstSquawk reported (unconfirmed).
Brent futures settled at $91.95, down $1.19 or 1.28%, about 20 minutes before the tanker report, so the settle does not reflect it. We re-anchored our scenario model to that settle.
Background: last weekend's mine strikes
Iran's navy said three oil tankers caught fire on Saturday, Nov. 14, after hitting naval mines in the Strait of Hormuz, Reuters reported from Iranian state media. On Sunday the Revolutionary Guards said one of them was a supertanker carrying more than 2 million barrels of crude and that it sank in the southern Persian Gulf. None of the claims has been independently verified.
The weekend strikes came as oil was easing. Brent futures settled at $95.84 on Friday, Nov. 13, after the benchmark fell 16% the week before. In October, Brent spot averaged $124 a barrel, according to the EIA. Brent has since fallen to $91.95.
We built a scenario model to answer one question: what happens to oil, fuel prices and inflation if the mines push Gulf exports back down? If mining becomes a sustained campaign, our model now puts Brent at about $106. If Gulf losses return to their March to September average, it reaches about $125. Weighted by our scenario probabilities, the expected price over the next quarter is about $99.
The strait looks empty, but the oil is getting out
Over the last 30 days, IMF PortWatch counted an average of 3.8 vessels a day crossing the strait, fewer than one of them a tanker. In January and February, before the war began on Feb. 28, the average was 68 a day. PortWatch only counts ships with their transponders on, though.
The export numbers tell a different story. The IEA says Gulf oil exports excluding Oman reached 18.4 million barrels a day (mb/d) in October, only 26% below pre-war levels. Crude exports were back to 15 mb/d, or 82% of pre-war. The EIA says the barrels are moving through ship-to-ship transfers along Oman's coast and the restarted Saudi East-West pipeline, plus dark transits. EIA estimates that production shut in by the closure fell from a 10.9 mb/d peak in May to 2.5 mb/d in October.
Those workarounds are what the mines threaten. Before the war, about 20 mb/d of oil, roughly a fifth of world consumption, moved through Hormuz. EIA estimated in 2025 that Saudi and UAE pipelines could reroute only about 2.6 mb/d of it.
What each lost barrel has cost so far
We calibrated the model to the war itself. From March to September, Brent averaged $100.28, up 41.5% from February's $70.89. Over the same months, Gulf production shut-ins averaged 7.49 mb/d, according to the EIA's November Short-Term Energy Outlook. That works out to about 5.5% on Brent for every 1 mb/d taken off the market.
A repeat could hurt more. The IEA says observed global stocks have fallen 462 million barrels since the war began, and on-land stocks are at their lowest since at least 2016. IEA members already committed 400 million barrels of emergency oil in March. So in the escalation scenarios we scale price increases up by 1.15x to 1.3x.
Five scenarios for the next quarter
- De-escalation (15%): A US-Iran ceasefire takes hold and shut-ins fall to 1.3 mb/d, the EIA's path for late 2027. Brent about $86.
- Base (50%): The strikes stay isolated and shut-ins hold at the EIA's 2.52 mb/d forecast for the fourth quarter. Brent stays near $92.
- Mine campaign (22%): Sustained mining deters dark and escorted transits, and shut-ins double to 5 mb/d. Brent about $106.
- Re-closure (10%): Gulf losses return to the March to September average of 7.49 mb/d. Brent about $125.
- Severe (3%): Losses return to the May peak of 10.9 mb/d. Brent about $147.
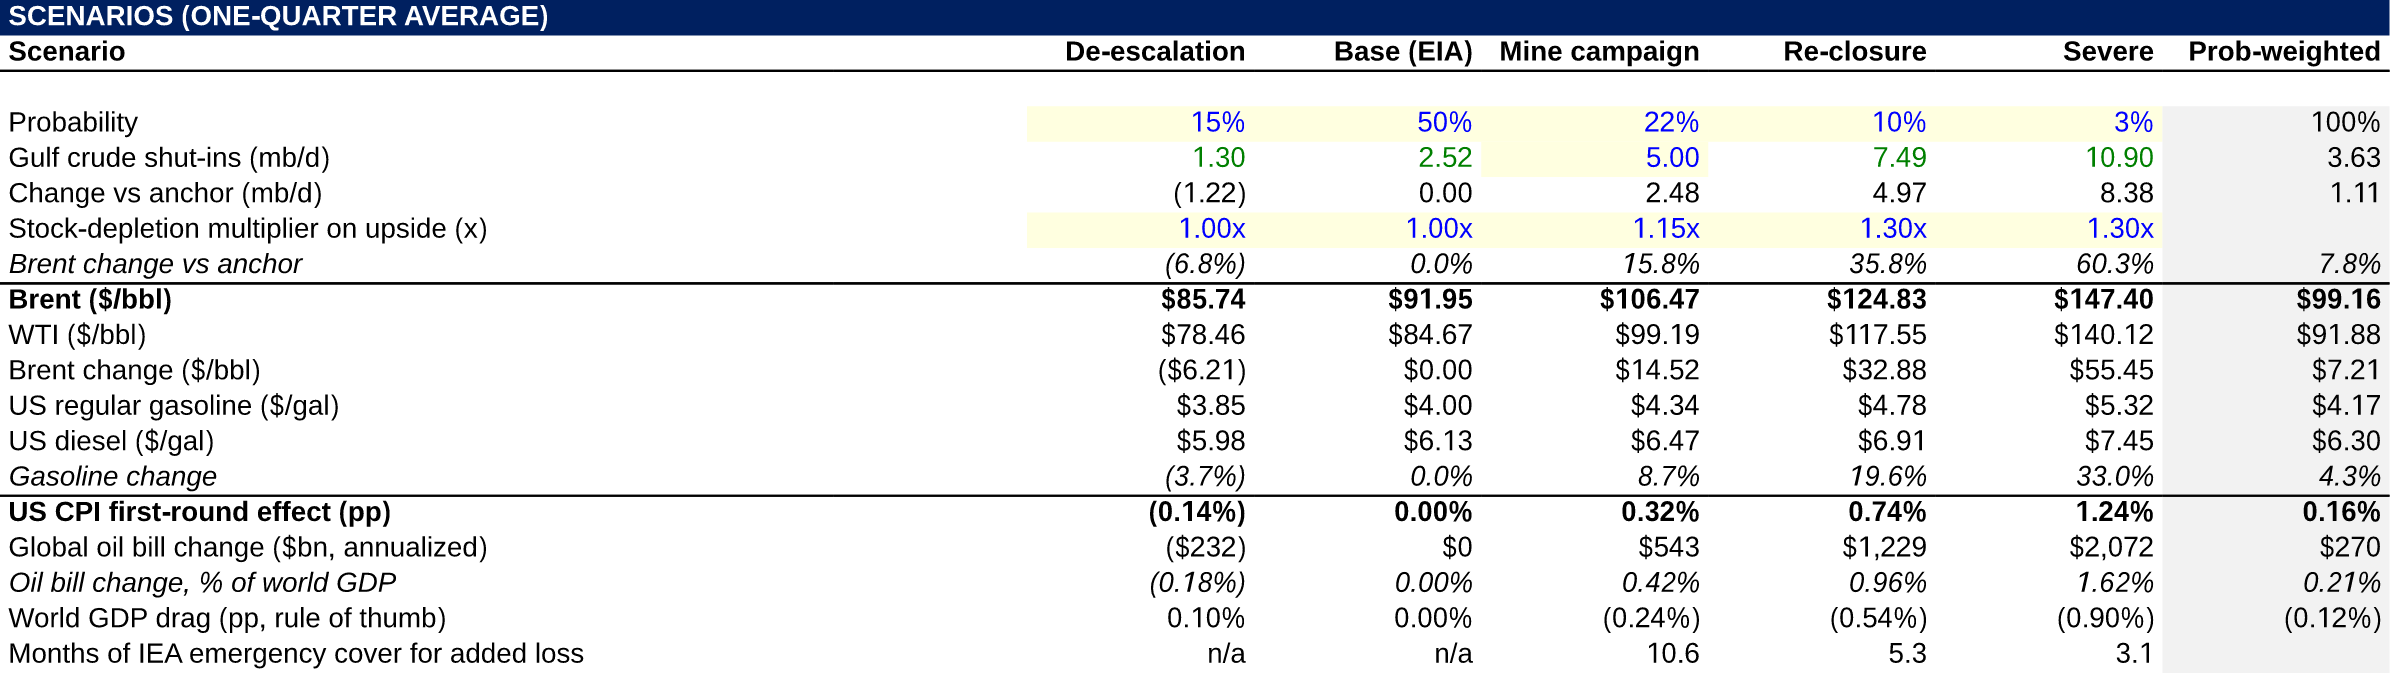
Model output: one-quarter averages by scenario, anchored to the Nov. 18 Brent settle of $91.95. The probabilities are our assumptions.
What it means for fuel prices and the economy
- US pump prices: Regular gasoline averaged $3.995 a gallon on Nov. 9, according to the EIA. With crude costs passed through in full, it would reach about $4.34 in the mine scenario and $4.78 in re-closure. Diesel, already $6.13, would reach $6.47 and $6.91.
- US inflation: Gasoline prices are up 37% from a year ago and now make up about 3.75% of the CPI basket, up from 2.9% in the BLS's December weights. The direct effect on headline CPI would be about +0.32 percentage points in the mine case and +0.74 in re-closure. That is on top of a 10-year Treasury yield already at 5.15%.
- The world's oil bill: At annual rates, consumers would pay about $543 billion more for oil in the mine scenario and $1.23 trillion more in re-closure. That is 0.42% and 0.96% of the IMF's $128 trillion estimate of 2026 world GDP.
- Emergency stocks: About 800 million barrels of IEA emergency oil would be left once the March release is delivered. That could cover the extra loss for about 10.6 months in the mine case, 5.3 months in re-closure and 3.1 months in the severe case.
- Europe and Asia: Euro area inflation was 4.0% in October, with energy up 20.8%. Asia is the most exposed region: 84% of Hormuz crude went there in 2024, and about a fifth of global LNG trade passes through the strait. The Asian LNG benchmark, JKM, went from $10.82 per million BTU in February to $28.59 in October.
What markets are betting
Polymarket traders give only a 4.5% chance that Hormuz traffic returns to normal by Dec. 31. With Brent below $92, they now price a 5.7% chance that WTI reaches $100 in November and a 70% chance that it dips to $80.
Sensitivity table
The table below varies the two inputs that matter most: how much oil the Gulf loses, and how much Brent moves for each barrel lost. Results range from about $79 if shut-ins fall to 1 mb/d and the market is very sensitive, to $173 if they reach 11 mb/d.

Sensitivity: Brent ($/bbl) by Gulf shut-ins in mb/d (rows) and Brent's % change per 1 mb/d shut in (columns), with stock-depletion scaling of 1.15x.
 Download the Hormuz oil scenario model (Excel)Our scenario model of Brent, US fuel prices, CPI and the global oil bill, with every input sourced and live sensitivity data tables.Download · Free
What to watch
- Confirmation of Wednesday's tanker fires from a maritime authority or an owner. So far the only source is Iranian state media.
- Saudi confirmation or denial of the Houthi strike claims at Jizan and Khamis Mushait.
- Brent's next settle, the first full session after the tanker report.
- The EIA's next Short-Term Energy Outlook on Dec. 8 and the IEA's December Oil Market Report.
How we built the model
Brent moves away from the Nov. 18 settle of $91.95 by the war's own price sensitivity (5.5% per mb/d) times the change in Gulf shut-ins from the EIA's 2.52 mb/d forecast. Increases are scaled up by 1.15x to 1.3x because inventories are depleted. Retail fuel prices move $1 a gallon for every $42 a barrel. The CPI effect counts only the direct effect of gasoline prices.
The model leaves out tanker freight and the Brent-WTI spread. October's $124 average came with only about 2.5 mb/d shut in, which shows how much those factors can add. The probabilities and the 5 mb/d mine-campaign figure are our assumptions. Every other input comes from the EIA, IEA, BLS, US Treasury, Eurostat, IMF, IMF PortWatch, Reuters or Polymarket.
More from Compound News
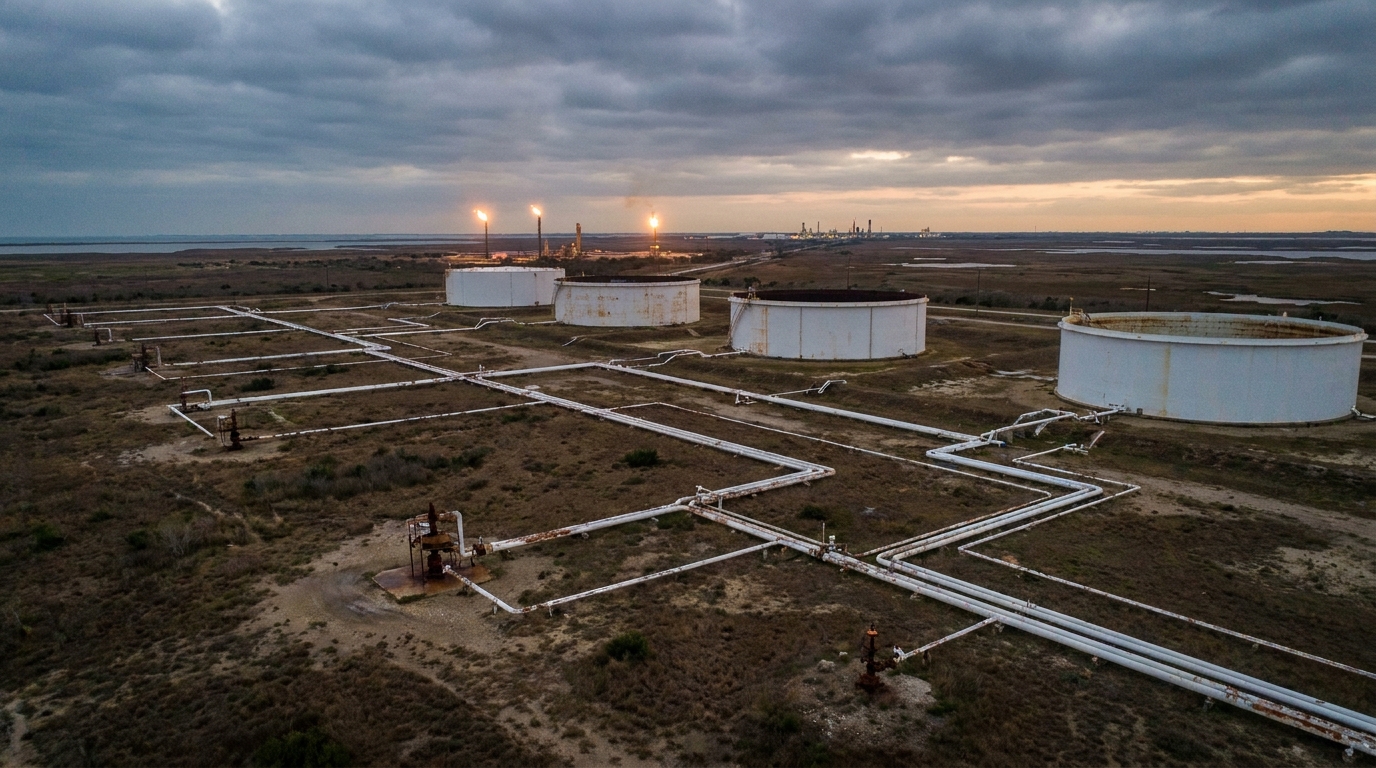
The US Oil Reserve Is at a 44-Year Low. How Much Can It Still Release?
The Strategic Petroleum Reserve held 276.4 million barrels last week, the lowest since 1982. Our model finds about 111 million barrels releasable at next year's trough, and a refill gap of about $17 billion.
Read article →
ByteDance would rent OpenAI models from Microsoft as its chip route narrows
ByteDance is in talks to spend about $500 million more on Azure for OpenAI models, as banks paused a $480 million Nvidia chip loan tied to it. Our model puts renting at about 5.5 times the per-token cost of owning the chips.
Read article →
The French fabric that limits how fast the US can build Patriot missiles
Every PAC-3 MSE rocket motor needs Raycarb, a carbonized rayon made only by ArianeGroup and processed only by Park Aerospace. New supply lands in 2028 and 2030, late in the ramp to 2,000 a year. Our model puts the shortfall near 1,380 missiles if today's supply supports 750 a year.
Read article →