| B | C | D | E | |
|---|---|---|---|---|
| 6 | Metric | 1 mile | 3 miles | 5 miles |
| 8 | Population | 18,6621 | 96,722 | 230,986 |
| 9 | Households | 8,971 | 38,546 | 91,138 |
| 12 | Median household income ($) | $69,4622 | $101,091 | $113,599 |
| 17 | Unemployment rate | 4.5% | 4.1% | 3.8% |
- 118,662 people within a mile: 44% more than a ZIP code area split gives
- 2Approximation: tract medians weighted by ring households
You are the associate on the buy side of Cedar Fork Commerce Park, the 248,400 square foot industrial and flex park in Lewisville, Texas from our real estate pro forma example. The broker asks $48.0M. Our model bids $46.4M for an 8.0% unlevered return, and it leases every suite that rolls at the appraisal’s market rent: $14.50 a square foot for small bays and $12.75 for large bays in 2027, triple net. It holds general vacancy and credit loss at 1.0%, on top of six months of downtime when a tenant leaves.
Before the bid goes to the investment committee, someone has to ask whether the market supports those inputs. That is the job of a market analysis. We gave Compound the underwriting model and asked it to build the trade area from Census data, read the submarket from the brokers’ Q3 2026 reports, and tell us whether the model’s rent and vacancy sit inside what the market shows. It ran once, on November 3, 2026.
The answer: the model’s rent sits above the submarket and its vacancy sits below it. Compound would raise general vacancy to 3.0% and run a downside at lower rents.
Cedar Fork Commerce Park, its tenants and its underwriting model are illustrative: a made-up property built to read like a real deal. The Census, BLS and broker figures are real public data. The workbook and the one-page slide on this page come from one real Compound run, quoted unedited.
How to do a real estate market analysis
A real estate market analysis tests a property’s income against the market it competes in.
It works outward from the site in five steps, and Compound’s run followed them in order.
- Fix the site and draw the trade area. The usual rings are 1, 3 and 5 miles, with population, households, income, the labor force, education, commuting and housing inside each.
- Compare the trade area with its city, county, metro, state and the US, so each figure reads as high or low.
- Read growth and the labor market from series with history: population, jobs and wages.
- Read the submarket for the property type: vacancy, asking rent, net absorption and space under construction, from each broker that publishes it.
- Tie the result back to the underwriting model. Do the model’s market rent and vacancy sit inside the market’s range, and if not, what changes?
The weight on each step depends on the property. An industrial park leans on labor and the construction pipeline, a multifamily deal on household growth and rent against income, and a retail center on spending in the trade area.
“Build a market and trade area analysis for [property] at [address] in Excel. Give 1, 3 and 5-mile ring demographics from ACS 5-year block group data, compare the 3-mile ring with the city, county, metro, state and US, add population, job and wage growth and the labor market for our tenants, read the submarket from the latest public broker reports, and test our model's market rent and vacancy against it. Cite every source value and mark every figure you compute.”
The address on Cedar Fork’s OM is invented, so it cannot be geocoded. Compound anchored every ring on a real point instead, I-35E and Corporate Drive in south Lewisville, and wrote that on the first sheet of the workbook and on the slide.
Population by radius: 1, 3 and 5-mile demographics around the site
The first sheet is the ring table, the part of a market analysis most readers look for first.
Within 3 miles of the site live 96,722 people in 38,546 households, with an approximate median household income of $101,091 and 4.1% unemployment.
| B | C | D | E | F | |
|---|---|---|---|---|---|
| 6 | Metric | 1 mile | 3 miles | 5 miles | Geography and method |
| 7 | POPULATION AND HOUSEHOLDS | ||||
| 8 | Population | 18,662 | 96,722 | 230,986 | Block groups, land-area share (B01003) |
| 9 | Households | 8,971 | 38,546 | 91,138 | Block groups, land-area share (B11001) |
| 10 | Persons per household | 2.081 | 2.51 | 2.53 | Our calculation |
| 11 | INCOME | ||||
| 12 | Median household income ($) | $69,4622 | $101,091 | $113,599 | Approximation: tract medians (B19013) weighted by ring households; no block group median or income brackets are loaded |
| 13 | Mean household income ($) | $85,490 | $123,028 | $136,206 | Block group aggregate income (B19025) / households |
| 14 | LABOR FORCE | ||||
| 17 | Unemployment rate | 4.5% | 4.1% | 3.8% | Our calculation |
| 18 | EDUCATIONAL ATTAINMENT (population 25+) | ||||
| 21 | Bachelor's degree or higher | 33.5% | 43.0% | 50.1% | ZCTA allocation |
| 22 | COMMUTE MODE (workers 16+) | ||||
| 24 | Drove alone | 70.0% | 68.0% | 66.2% | ZCTA allocation |
| 27 | Worked from home | 17.8% | 20.5% | 23.3% | ZCTA allocation |
| 29 | COMMUTE TIME (workers not working from home) | ||||
| 36 | Mean travel time (minutes) | 25.5 | 25.7 | 26.2 | Our calculation at bracket midpoints (ACS Data row 4) |
| 37 | HOUSING | ||||
| 40 | Median home value ($) | $339,056 | $406,893 | $444,844 | Approximation: ZCTA medians (B25077) weighted by ring owner units |
| 41 | Median gross rent ($/month) | $1,582 | $1,670 | $1,749 | Approximation: ZCTA medians (B25064) weighted by ring renter units |
| 42 | CHECKS | ||||
| 43 | Block groups counted (land share > 0) | 23 | 71 | 155 | Our calculation |
| 44 | Population, centroid method (internal point inside ring) | 16,380 | 97,112 | 230,854 | Our calculation, for comparison only |
| 45 | Area share less centroid population | 2,2823 | (390) | 132 | Our calculation |
- 12.08 people per household at 1 mile, against 2.51 at 3 miles
- 2Approximation: tract medians weighted by ring households
- 3At 1 mile the centroid method misses 2,282 people that the area share counts
Compound took the 2026 TIGER/Line block group boundaries around the site and intersected them with circles of 1, 3 and 5 miles. Before it took any shares, it cut out water with the Census hydrography layer: Lewisville Lake, Grapevine Lake and smaller water bodies. A block group then counts by the share of its land area inside the ring. If 40% of a block group’s land is inside the 3-mile circle, 40% of its people and households are counted.
The other common method counts a block group whole if its center point falls inside the ring and not at all if it falls outside. Compound kept that centroid count as a check in rows 43 to 45. At 3 and 5 miles the two methods agree within 390 people. At 1 mile, where only 23 block groups touch the circle, the centroid method gives 16,380 people, 2,282 fewer than the area share. A small ring is where the method matters most.
Some rows are built differently, and the method column says which. Population, households, aggregate income, the labor force and unemployment come straight from block groups. A median cannot be added up across areas, so the ring’s median income is an approximation: tract medians weighted by the ring’s households. Education, commuting and housing are read for ZIP code areas (ZCTAs) and allocated by the share of each ZCTA’s population that lives in the ring’s block groups. Median home value and median rent are medians of medians and are labeled approximations. The mean household income, aggregate income over households, is built from block group totals, which makes it the better figure to compare across rings.
For a flex park, the rings describe the people who could work for its tenants and the small businesses that lease its bays. Cedar Fork’s HVAC, fire protection, cabinetry and dental lab tenants hire locally and serve the households around them. The 3-mile ring holds a civilian labor force of 59,117, with a 25.7-minute average commute.
The 1-mile ring looks different from the other two. Its households are small (2.08 people each, against 2.51 at 3 miles), its approximate median income is $69,462, and the ZIP-allocated housing figures put more renter units than owner units inside it (4,622 against 3,023). It reads as a rental corridor along the highway, with a younger, lower-income population than the suburbs further out.
Block group vs ZIP code: the ZIP shortcut missed 30% of the 1-mile ring
An earlier quick ring check on this site, dated October 28, split ZIP code totals by the share of each ZIP’s area inside the ring.
Compound set those figures beside the block group figures. At 3 and 5 miles they agree within 3%. At 1 mile they do not.
| B | C | D | E | F | G | |
|---|---|---|---|---|---|---|
| 5 | Metric | Ring (miles) | Prior ZIP area split (rounded) | Block group method | Difference | Difference (%) |
| 6 | Population | 1 | 12,980 | 18,662 | 5,682 | 43.8%1 |
| 7 | 3 | 93,900 | 96,722 | 2,822 | 3.0% | |
| 8 | 5 | 230,350 | 230,986 | 636 | 0.3% | |
| 9 | Households | 1 | 5,320 | 8,971 | 3,651 | 68.6%2 |
| 10 | 3 | 37,700 | 38,546 | 846 | 2.2% | |
| 11 | 5 | 90,320 | 91,138 | 818 | 0.9% | |
| 12 | Median household income ($) | 1 | $78,550 | $69,462 | ($9,088) | (11.6%)3 |
| 13 | 3 | $91,240 | $101,091 | $9,851 | 10.8% | |
| 14 | 5 | $104,070 | $113,599 | $9,529 | 9.2% |
- 1The ZIP split spread ZIP 75067's 66,913 people evenly over its area
- 2Households miss by more than people: the ring's households are small
- 3Not like for like: ZIP income brackets against tract medians
The ZIP split put 12,980 people and 5,320 households inside 1 mile. The block groups put 18,662 people and 8,971 households there, 44% and 69% more. The cause is in Compound’s note on the sheet. ZIP 75067 holds 66,913 people, and the ZIP split spread them evenly over its whole area, water included. The block groups near I-35E and Corporate Drive are denser than the ZIP’s average, so an even spread puts too few people near the site.
Households miss by more than people because the people near the site live in smaller households. The ZIP split implies 2.44 people per household (our arithmetic), and the ring’s block groups have 2.08. Across 3 and 5 miles, the dense and sparse parts of each ZIP average out, which is why the two methods converge there.
The income rows move 9% to 12% in both directions, and Compound marked that comparison as not like for like. The ZIP split read median income off the ACS income brackets for each ZIP. The block group method weights tract medians by the ring’s households. The comparison that holds is population and households, and there the ZIP split came in 30% short on people and 41% short on households.
For a buyer, the point is which ring the market story rests on. A 1-mile population of 13,000 and one of 18,700 describe different neighborhoods, and a broker’s OM that quotes ZIP-based rings can carry the smaller one without saying so.
Trade area analysis: the 3-mile ring against Lewisville, Denton County and DFW
A trade area figure means little alone.
The third sheet sets the 3-mile ring beside the city of Lewisville, Denton County, the Dallas-Fort Worth-Arlington metro, Texas and the US, all from the same ACS 2020-2024 release.
| B | C | D | E | F | G | H | I | |
|---|---|---|---|---|---|---|---|---|
| 5 | Metric | 3 mile ring | Lewisville city | Denton County | DFW-Arlington metro | Texas | United States | Ring vs metro |
| 6 | Population | 96,722 | 131,080 | 979,561 | 7,985,590 | 30,188,424 | 334,922,499 | |
| 7 | Households | 38,546 | 51,915 | 360,392 | 2,891,725 | 10,992,816 | 129,227,496 | |
| 9 | Median household income ($) | $101,091 | $89,233 | $111,498 | $90,275 | $78,476 | $80,734 | 12.0%1 |
| 10 | Mean household income ($) | $123,028 | $114,750 | $145,847 | $124,387 | $109,933 | $113,530 | (1.1%)2 |
| 12 | Unemployment rate | 4.1% | 4.3% | 4.0% | 4.6% | 5.3% | 5.2% | (0.5%) |
| 14 | Bachelor's degree or higher (25+) | 43.0% | 40.7% | 49.4% | 39.4% | 33.8% | 35.7% | 3.6% |
| 18 | Worked from home | 20.5% | 19.3% | 23.5% | 17.8% | 14.4% | 15.1% | 2.8% |
| 21 | Mean travel time (minutes, our calc.) | 25.7 | 26.5 | 30.3 | 30.3 | 28.8 | 28.6 | (4.6)3 |
| 22 | Median home value ($) | $406,893 | $378,500 | $437,200 | $359,500 | $283,800 | $332,700 | 13.2% |
| 23 | Median gross rent ($/month) | $1,670 | $1,670 | $1,728 | $1,614 | $1,403 | $1,413 | 3.5% |
- 1The ring's median is an approximation
- 2Mean income, built from block group totals: level with the metro
- 3Commutes 4.6 minutes shorter than the metro average
The headline comparison needs care. The ring’s approximate median income of $101,091 is 12.0% above the metro’s $90,275. Its mean income, the figure built from block group totals, is $123,028, 1.1% below the metro’s $124,387. We read the trade area as level with the metro on income. The median runs high because tract medians weighted to the ring are not the same statistic as a published median.
The other rows point the same way. The 3-mile ring is better educated than the metro (43.0% with a bachelor’s degree against 39.4%), more of it works from home (20.5% against 17.8%), and its commutes are 4.6 minutes shorter. Unemployment is 4.1% against the metro’s 4.6%. Home values sit 13.2% above the metro, and rent 3.5% above it. Against Denton County, the ring is less affluent: the county’s mean household income is $145,847 and 49.4% of its adults hold a degree. Cedar Fork sits in the older, denser south end of a fast-growing county.
Growth and the industrial labor market for a flex tenant
The fourth sheet keeps to series with published history and projects nothing.
Denton County grew from 914,517 people in July 2020 to 1,069,346 in July 2025, 3.2% a year, against 2.0% for the metro and 0.6% for the US. Covered employment in the county grew 3.9% a year from March 2014 to March 2026, and the metro’s 2.2%.
| B | C | D | |
|---|---|---|---|
| 5 | A. RESIDENT POPULATION, JULY 1 (Census Population Estimates, Vintage 2025) | ||
| 6 | Year | Denton County | DFW-Arlington metro |
| 7 | 2020 | 914,517 | 7,667,416 |
| 12 | 2025 | 1,069,346 | 8,477,157 |
| 13 | CAGR 2020-2025 (our calc.) | 3.2%1 | 2.0% |
| 34 | C. EMPLOYMENT AND WAGES (BLS QCEW, all industries, total covered) | ||
| 35 | Year | Denton County employment (March) | Metro employment (March) |
| 36 | 2014 | 200,402 | 3,109,042 |
| 48 | 2026 | 317,8332 | 4,034,579 |
| 49 | CAGR 2014-2026 (our calc.) | 3.9% | 2.2% |
- 13.2% a year, against 2.0% for the metro and 0.6% for the US
- 20.4% below March 2025: the first fall in the series
The latest year is softer than the long run. Denton County’s population grew 2.2% in the year to July 2025, its slowest in the series, and county employment in March 2026 was 0.4% below March 2025. Per capita personal income grew 4.7% a year from 2010 to 2024, to $80,108 (BEA). A flex park does not need the fastest-growing county in Texas. It needs enough small businesses to fill bays when leases roll, and the county is still adding them, more slowly.
The fifth sheet narrows to the jobs a flex tenant fills: construction, manufacturing, and transportation and warehousing. In Denton County those three sectors held 60,290 jobs in March 2026, 19.0% of covered employment and 3.7% more than a year earlier. Construction did most of that, up 11.4%. In the metro the same three sectors are 19.7% of jobs.
| B | C | D | E | F | G | |
|---|---|---|---|---|---|---|
| 12 | B. DENTON COUNTY BY SECTOR (BLS QCEW, private) | |||||
| 13 | Sector | Employment | Employment, year earlier | YoY | Share of county total | Avg weekly wage ($) |
| 14 | Period | Mar 2026 | Mar 2025 | Q1 2026 | ||
| 15 | Total, all industries (total covered) | 317,833 | 319,147 | (0.4%) | 100.0% | $1,374 |
| 16 | Construction | 21,851 | 19,618 | 11.4% | 6.9% | $1,667 |
| 17 | Manufacturing | 19,433 | 19,420 | 0.1% | 6.1% | $1,870 |
| 18 | Transportation and warehousing | 19,006 | 19,078 | (0.4%) | 6.0% | $1,171 |
| 19 | Three industrial sectors combined | 60,290 | 58,116 | 3.7% | 19.0%1 | |
| 21 | C. DFW-ARLINGTON METRO BY SECTOR (BLS QCEW, private; latest quarter BLS discloses for the sectors) | |||||
| 22 | Sector | Employment | Employment, year earlier | YoY | Share of metro total | Avg weekly wage ($) |
| 23 | Period | Jun 20252 | Jun 2024 | Q2 2025 | ||
| 24 | Total, all industries (total covered) | 4,037,769 | 4,002,521 | 0.9% | 100.0% | $1,521 |
| 25 | Construction | 244,582 | 233,044 | 5.0% | 6.1% | $1,658 |
| 26 | Manufacturing | 310,017 | 309,087 | 0.3% | 7.7% | $1,812 |
| 27 | Transportation and warehousing | 240,778 | 239,730 | 0.4% | 6.0% | $1,450 |
| 28 | Three industrial sectors combined | 795,377 | 781,861 | 1.7% | 19.7% | |
| 31 | D. DFW-ARLINGTON METRO, CURRENT EMPLOYMENT STATISTICS (thousands, not seasonally adjusted) | |||||
| 32 | Sector | Employment (000s) | Year earlier (000s) | YoY | Share of total nonfarm | |
| 33 | Period | Sep 2026 | Sep 2025 | |||
| 34 | Total nonfarm | 4,352.1 | 4,308.2 | 1.0% | 100.0% | |
| 35 | Mining, logging and construction | 274.6 | 267.0 | 2.8% | 6.3% | |
| 36 | Manufacturing | 313.2 | 313.1 | 0.0% | 7.2% | |
| 37 | Transportation, warehousing and utilities | 271.6 | 263.7 | 3.0%3 | 6.2% |
- 1One job in five in the county is in the three industrial sectors
- 2The latest metro quarter BLS discloses for these sectors. Later quarters show as 0
- 3September 2026, preliminary: 3.0% more than a year earlier
One gap in the public data shaped the sheet. BLS publishes the metro’s sector employment from QCEW with a lag, and the quarters after Q2 2025 show as 0 in the series, meaning not disclosed. Compound took June 2025 as the latest usable metro sector quarter and said so on the sheet. To bring the metro up to date, it added September 2026 from the monthly CES survey, which groups construction with mining and logging, and transportation with utilities. On that basis the metro’s industrial jobs grew 2.8% (construction group), 0.0% (manufacturing) and 3.0% (transportation group) over the year.
Unemployment in September 2026 was 3.9% in Denton County and 4.1% in the metro, each 0.1 points lower than a year earlier (BLS LAUS, not seasonally adjusted). Wages are the other half of a tenant’s labor cost. A county manufacturing job paid $1,870 a week in Q1 2026, 36% above the all-industry average. A transportation and warehousing job paid $1,171, 15% below it. Cedar Fork’s contractor tenants hire in the sector whose jobs grew fastest, construction, and pay its above-average wages.
Industrial submarket analysis: Q3 2026 vacancy, rent and absorption
The ring and the labor market describe demand.
The submarket shows what landlords are getting for space now. Compound read the two public Q3 2026 industrial reports that break out a submarket containing the site. It placed the site on each broker’s submarket map: CBRE calls it Lewisville, in its Northwest Dallas district, and Cushman & Wakefield calls it Far North/I-35. It also read the metro-wide flex segment from each, the closest product match to a small-bay park. Newmark’s 3Q26 report keeps its submarket table behind a form, so Compound did not use it.
| B | C | F | G | H | I | J | K | |
|---|---|---|---|---|---|---|---|---|
| 5 | Broker | Broker's name for the area | Vacancy | Asking rent ($/SF/yr) | Rent basis | Q3 2026 net absorption (SF) | YTD net absorption (SF) | Under construction (SF) |
| 6 | CBRE | Lewisville | 11.0% | $11.29 | Avg. direct asking, NNN | (106,000)1 | (204,000) | 1,890,0003 |
| 7 | CBRE | Northwest Dallas Total | 10.3% | $11.66 | Avg. direct asking, NNN | 150,000 | 1,090,000 | 4,090,000 |
| 8 | CBRE | R&D/Flex | 6.4% | $12.83 | Avg. direct asking, NNN | (258,000) | (693,000) | 168,000 |
| 9 | CBRE | Below 50K SF | 6.4% | $12.63 | Avg. direct asking, NNN | (968,000) | (1,900,000) | 168,000 |
| 10 | CBRE | DFW Total | 7.8% | $10.39 | Avg. direct asking, NNN | 6,440,000 | 23,630,000 | 33,910,000 |
| 11 | Cushman & Wakefield | Far North/I-35 | 10.2% | $9.97 | Overall weighted avg. net | 2,055,0032 | 2,932,560 | 375,831 |
| 12 | Cushman & Wakefield | Office Service Center (Flex) | 6.6% | $12.98 | Overall weighted avg. net | (42,856) | (522,634) | 275,413 |
| 13 | Cushman & Wakefield | Dallas/Fort Worth Totals | 7.3% | $9.76 | Overall weighted avg. net | 13,934,588 | 28,563,372 | 30,560,051 |
- 1CBRE Lewisville gave back 106,000 SF in Q3
- 2Cushman's Far North/I-35 absorbed 2.06M SF in Q3, on a different boundary
- 31.89M SF under construction, 5.1% of the submarket's inventory (our arithmetic)
The two brokers agree on vacancy and disagree on almost everything else. CBRE’s Lewisville submarket is 11.0% vacant with an average direct asking rent of $11.29 a square foot, triple net. Cushman’s Far North/I-35 is 10.2% vacant at $9.97. Both submarkets hold about 37.3 million square feet, but they are not the same 37.3 million. CBRE’s Lewisville lost 106,000 square feet of occupancy in the quarter. Cushman’s Far North/I-35 gained 2,055,003. A buyer who quoted only one report would tell the committee either that the submarket is softening or that it is absorbing space fast.
Compound’s sheet says why the figures differ. The boundaries differ, so inventory and absorption differ. CBRE quotes average direct asking rent, triple net, for buildings of 10,000 square feet and over. Cushman quotes an overall weighted average net rent. Neither is wrong. Compound used the two submarkets as the ends of a range, 10.2% to 11.0% vacancy and $9.97 to $11.29 rent, and the two flex segments as a second range, 6.4% to 6.6% vacancy and $12.83 to $12.98.
The submarket against its metro tells the rest. Both brokers put the submarket’s vacancy above the metro’s (7.8% at CBRE, 7.3% at Cushman). Flex vacancy, 6.4% to 6.6%, sits below it. Small-bay space is tighter than the market as a whole. The reports do not split the submarket’s pipeline by building size, so how much of CBRE’s 1.89 million square feet under construction competes with small bays is a question for the brokers.
Market rent and vacancy vs the underwriting model
The last analysis sheet reads the model’s inputs from the pro forma workbook, without changing them, and tests each one against the two ranges.
| B | C | D | E | F | G | H | I | J | |
|---|---|---|---|---|---|---|---|---|---|
| 23 | B. TESTS AGAINST THE Q3 2026 BROKER FIGURES (our calc.) | Model | Submarket low | Submarket high | Inside submarket range? | Model less submarket high | Flex segment low | Flex segment high | Inside flex range? |
| 24 | Small-bay market rent ($/SF/yr) | $14.50 | $9.97 | $11.29 | Above | $3.211 | $12.83 | $12.98 | Above |
| 25 | Large-bay market rent ($/SF/yr) | $12.75 | $9.97 | $11.29 | Above | $1.46 | $12.83 | $12.98 | Below |
| 26 | General vacancy and credit loss | 1.0% | 10.2% | 11.0% | Below | (10.0%) | 6.4% | 6.6% | Below |
| 27 | Average economic vacancy over the hold | 3.3%2 | 10.2% | 11.0% | Below | (7.7%) | 6.4% | 6.6% | Below |
| 30 | Average economic vacancy with general vacancy at the proposed rate in D30 (our calc.) | 5.2% | 3.0%3 |
- 1$3.21 above the top of the submarket range, a 28.4% premium to CBRE Lewisville
- 2Downtime plus general vacancy, averaged over the 2027-2036 hold
- 3Proposed general vacancy, an input you can change
Neither model rent sits inside the submarket range. Small bay at $14.50 is $3.21 above the top of the submarket’s $9.97 to $11.29 and $1.52 above the flex segment’s $12.83 to $12.98. Large bay at $12.75 is $1.46 above the submarket and just under the flex range.
There is a fair case for the model. Its rents come from the appraisal’s market rent conclusion and from the park’s own lease comps, which average $14.70 for small bays and $12.75 for large bays. Broker averages blend every building type and age in a submarket, and a 20,000 square foot flex suite rents for more than a 300,000 square foot warehouse. So the gap does not prove the model wrong. It does mean the rent rests on one appraisal and a handful of park-level leases, and no public market figure confirms it.
Vacancy is the clearer miss. General vacancy and credit loss of 1.0% sits on top of modeled downtime, and Compound worked out what the two add up to. Over the 2027 to 2036 hold, downtime and general vacancy remove 3.3% of potential rent and recoveries. Submarket vacancy is 10.2% to 11.0%, and flex vacancy 6.4% to 6.6%. Physical vacancy and economic vacancy are not the same measure, and the model’s 3.3% leaves out free rent. Counted with free rent, the model’s figure is 5.2%. Either way, the model sits below both ranges.
Compound’s recommendations, from the sheet:
| Change | From | To | Why |
|---|---|---|---|
| General vacancy and credit loss | 1.0% | 3.0%, which lifts downtime plus general vacancy over the hold from 3.3% to about 5.2%, before free rent | Closer to the 6.4% to 6.6% flex range. Keep six months of downtime and 70% renewal |
| Market rent, base case | $14.50 small bay, $12.75 large bay | Keep only once the seller’s 2025-2026 park leasing confirms them | No broker range reaches $14.50 |
| Market rent, downside case | none | $12.90 small bay, $11.29 large bay | The flex segment and CBRE Lewisville asking rents |
| Supply | not modeled | Watch 1.89M SF under construction in CBRE’s Lewisville and 375,831 SF in Cushman’s Far North/I-35 | New space could hold vacancy up through the first rollover years |
The run stops at the inputs. It does not rerun the pro forma at them, so the IRR and bid at 3.0% vacancy and downside rents are the next step, in the real estate pro forma workbook. Both changes push the same way, toward a bid below $46.4M.
The market analysis report: one page for the investment committee
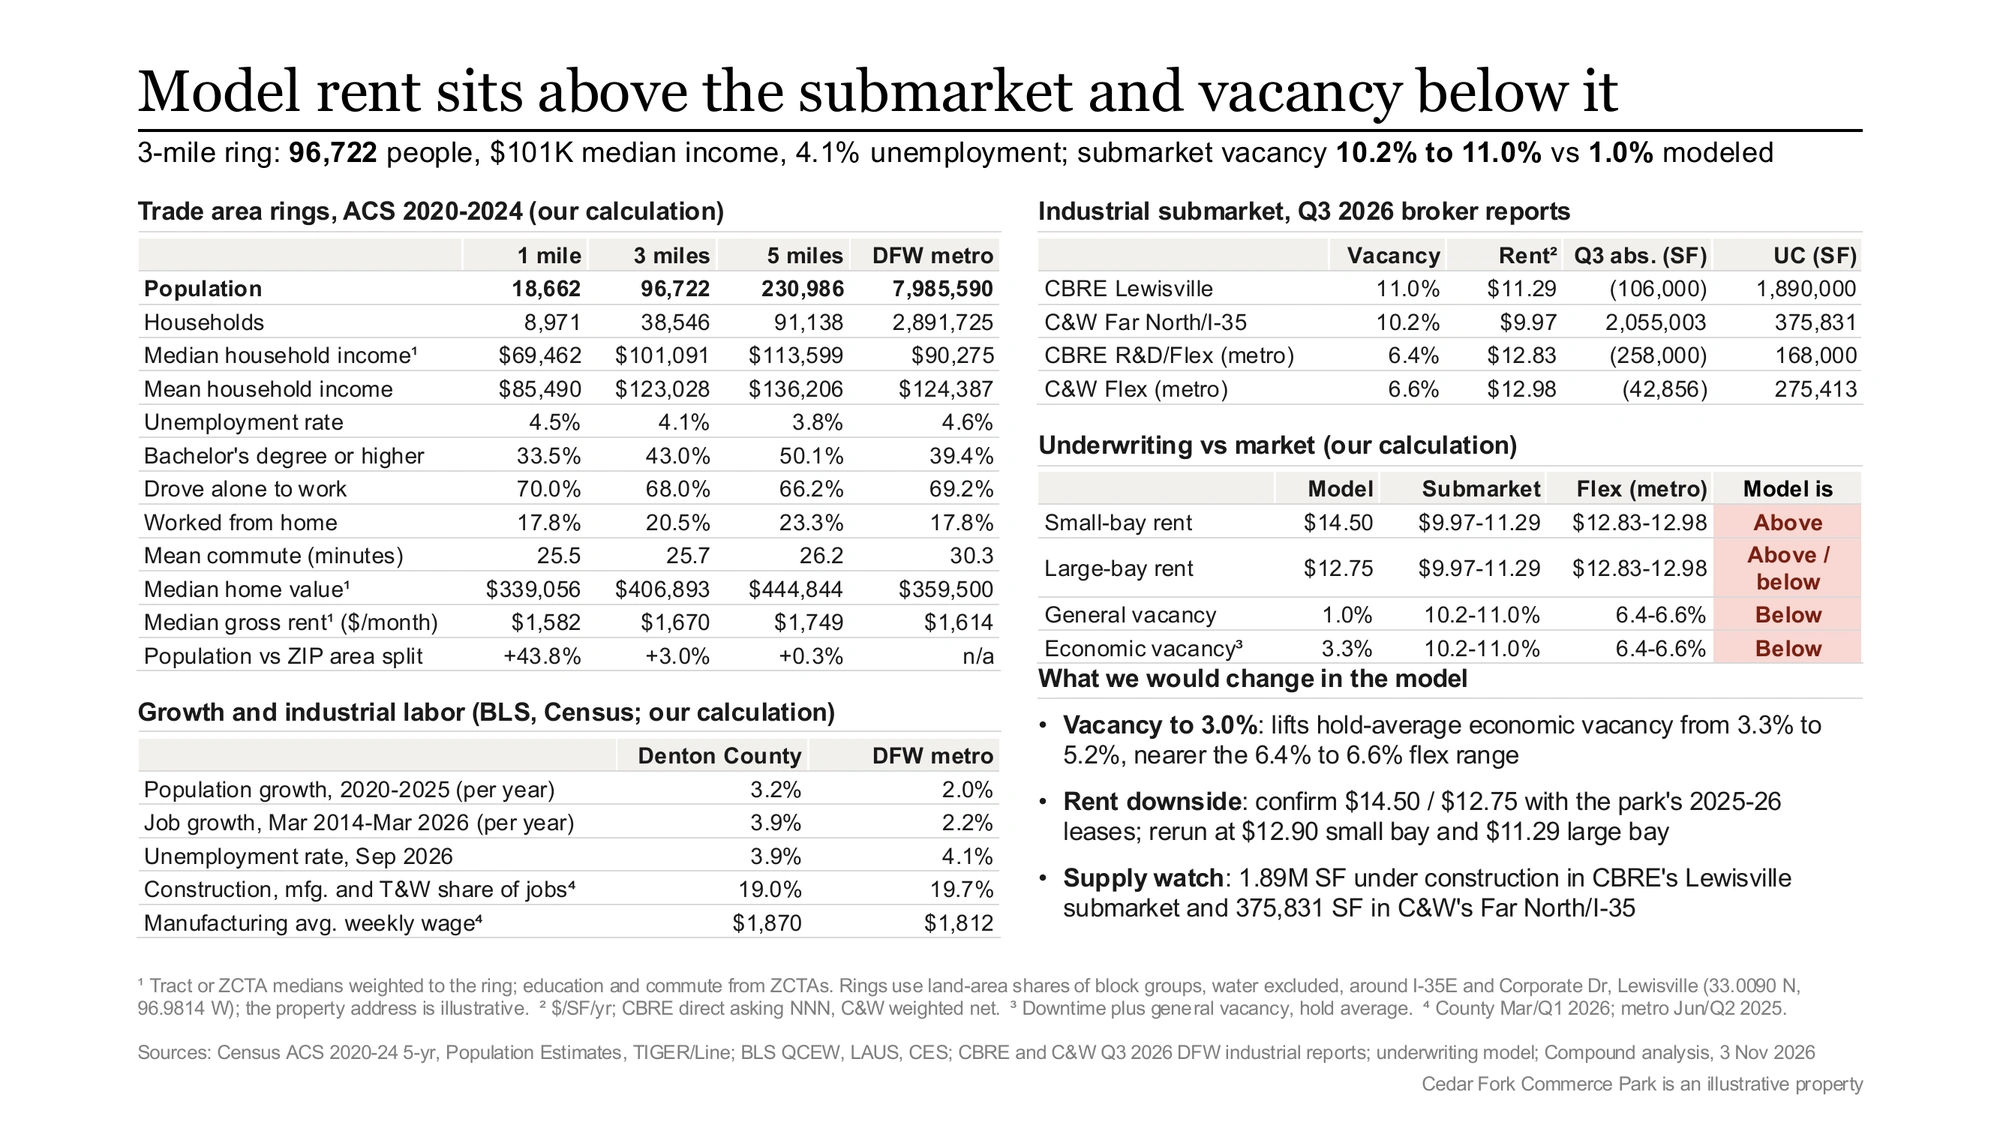
A real estate market analysis report for a committee is one page, answer first.
Compound ended the run with that page, in the house slide template, shown here with one label corrected.
Where the data comes from: real estate market analysis tools and sources
Every figure in the workbook comes from a public source, cited on the sheet that uses it.
Compound pulled the Census and BLS series itself and saved the two broker reports beside the workbook.
| Source | What it gives | Geography | Latest used |
|---|---|---|---|
| Census ACS 5-year | Population, households, income, labor force, education, commuting, housing | Block group to US | 2020-2024 |
| Census TIGER/Line and TIGERweb hydrography | Block group boundaries and water areas for the rings | Block group | 2026 boundaries |
| Census Population Estimates | July 1 resident population | County, metro, US | Vintage 2025 |
| BEA CAINC1 | Population and per capita personal income | County | 2024 |
| BLS LAUS | Unemployment and labor force | County, metro | September 2026 |
| BLS QCEW | Employment and wages by sector | County, metro | Q1 2026 county, Q2 2025 metro sectors |
| BLS CES | Monthly employment by sector | Metro | September 2026, preliminary |
| CBRE Dallas/Fort Worth Industrial Figures | Vacancy, rent, absorption, construction | Submarket, product type | Q3 2026 |
| Cushman & Wakefield MarketBeat Dallas/Fort Worth Industrial | Vacancy, rent, absorption, construction | Submarket, product type | Q3 2026 |
The ring step is GIS work, and Compound kept its block group shares on the BG Data sheet, so every ring figure traces to a block group.
FAQ
Should I use 1, 3 and 5-mile rings or drive-time areas?
Rings are the convention in offering memoranda and appraisals, so they compare across deals and against a broker’s package. A drive-time area follows the road network and fits a labor shed or a retail catchment better. For an industrial site, read the ring’s commute table beside it: 41.9% of commuters in Cedar Fork’s 3-mile ring travel 15 to 29 minutes.
Block group, tract or ZIP code: which geography should a ring use?
Use the smallest one the data has. A block group is the smallest area the ACS publishes, usually 600 to 3,000 people, and a tract holds a few block groups. ZIP code areas are much larger, and on this site a ZIP area split understated the 1-mile population by 30%. A row read for a larger area is allocated to the ring and labeled.
How current is ACS data, and what fills the gap?
Census publishes a new ACS 5-year release once a year, and each one averages five years of surveys, so 2020-2024 figures describe the middle of that period more than today. For current conditions, use the monthly and quarterly series: BLS LAUS for unemployment, CES for jobs, QCEW for wages, and the Census population estimates. Compound’s workbook puts each beside the ACS with its own date.
Which broker should I trust when submarket figures disagree?
Read each broker’s definitions before the numbers: the submarket boundary, the minimum building size, the rent basis and how absorption is counted. On Cedar Fork, CBRE and Cushman & Wakefield agree on vacancy within a point, while their absorption runs from minus 106,000 to plus 2.06 million square feet because the boundaries differ. Use the two as a range, and test the property’s own leasing against it.
How does a multifamily market analysis differ from an industrial one?
A multifamily analysis leans on household growth, renter share, rent against income and the apartment pipeline, with unit-level rent comps. An industrial analysis leans on the labor market, highway access, submarket vacancy and the construction pipeline. The rings and the comparison geographies are the same in both.
What from the market analysis goes into the IC memo?
The trade area in one table, the submarket figures with each broker’s name and basis, and a direct answer on whether the model’s rent and vacancy sit inside the market. Add what you would change and why. The investment memo page shows how Compound writes the memo with each figure cited to its source.