Permira and Warburg Pincus financed the $8.4 billion take-private of Clearwater Analytics with a $2.7 billion first-lien term loan priced at SOFR plus 4.50%. The debt schedule and LBO model for the deal hold Term SOFR flat at 3.53% for six years, a common shortcut and an optimistic one. This page asks what the loan costs on the market’s own SOFR path instead, and whether the sponsor should hedge it.
What changes when the SOFR forward curve replaces the flat rate:
- Forward SOFR is 88 to 107 basis points higher in every fiscal year from 2027 to 2031, peaking at 4.60% in 2028. The 3M forward tops out at 4.66% in July 2027.
- Interest on the term loan rises $129.0 million over the five-year hold ($128.0 million in cash, $0.9 million of extra PIK), and $161.1 million through 2031.
- Cash interest cover falls 0.10x to 0.55x a year, from 2.4x to 2.1x in 2027 and 2028 on the outside-in case.
- FY2030 net debt is $126.0 million higher, at $2,435.8 million, and first-lien net leverage at exit is 4.2x instead of 4.0x.
- The sponsor barely feels it. Its 2030 IRR moves from 21.1% to 20.8%. The cost lands on coverage, which is the lender’s problem first.
Nothing in the debt commitment letter or the merger proxy requires the borrower to hedge. A cap at 4.75% or a swap at 4.51% on half the loan pays nothing on the curve and only matters if rates rise, and in the downside case with SOFR 200 basis points above the curve it is the difference between drawing $258 million of the $325 million revolver and drawing $162 million.
The SOFR forward curve on October 27, 2026
The market expects SOFR to rise from 3.95% to a 4.66% peak in mid-2027 and settle near 4.4%. A flat 3.53% sits below every point on the curve.
Market-implied SOFR forward curve against the flat rate in the buyout model
Forward rate at each quarterly reset, October 2026 to October 2031, percent
Compound's market-implied SOFR forward curve of the October 27, 2026 close, fitted to 268 SOFR swap trades reported to DTCC that day and the New York Fed SOFR fixing. Not CME Term SOFR. From Compound's Forward Curve tab.
A SOFR forward curve is the rate the market will pay or receive for each future SOFR period, read out of the prices of SOFR swaps. A trader quoting a two-year swap at a fixed rate is quoting the average of the forwards over those two years, so a day’s swap trades pin the curve down. Most borrowers get it from a hedging adviser’s website or a terminal. Compound builds its own each New York business day from the SOFR swap trades reported publicly to DTCC and the New York Fed’s SOFR fixing. For about the first 15 months the overnight rate may only step at FOMC meetings, which is how the market itself prices it.
Two things the curve is not. It is not a forecast: it is the rate at which someone will take the other side today, and it moves every day. And it is not CME Term SOFR, the forward-looking one-month or three-month rate most leveraged loans reference, which publishes today’s term rate and no curve. A model converts the forwards into the rate each period will reset at, which is what Compound did: each fiscal year’s SOFR is the day-weighted average of the 3M forwards it covers, with the 86 NY Fed fixings since the June 25 close standing in for the part of 2026 already past (they averaged 3.72%).
| B | C | D | |
|---|---|---|---|
| 28 | Date | 1M (%) | 3M (%) |
| 30 | 29-Oct-26 | 3.935 | 4.053 |
| 31 | 29-Jan-27 | 4.260 | 4.332 |
| 32 | 29-Apr-27 | 4.487 | 4.554 |
| 33 | 29-Jul-27 | 4.638 | 4.664 |
| 34 | 29-Oct-27 | 4.649 | 4.659 |
| 35 | 31-Jan-28 | 4.615 | 4.633 |
| 36 | 28-Apr-28 | 4.596 | 4.610 |
| 37 | 31-Jul-28 | 4.575 | 4.576 |
| 38 | 30-Oct-28 | 4.526 | 4.535 |
| 39 | 29-Jan-29 | 4.502 | 4.511 |
| 40 | 30-Apr-29 | 4.480 | 4.490 |
| 41 | 30-Jul-29 | 4.461 | 4.472 |
| 42 | 29-Oct-29 | 4.442 | 4.449 |
| 43 | 29-Jan-30 | 4.416 | 4.426 |
| 44 | 29-Apr-30 | 4.400 | 4.414 |
| 45 | 29-Jul-30 | 4.395 | 4.411 |
| 46 | 29-Oct-30 | 4.393 | 4.402 |
| 47 | 29-Jan-31 | 4.376 | 4.390 |
| 48 | 29-Apr-31 | 4.375 | 4.395 |
| 49 | 29-Jul-31 | 4.390 | 4.416 |
| 50 | 29-Oct-31 | 4.418 | 4.442 |
The market already prices SOFR about a point above the 3.53% in the model. The next part puts that point into the model the way Compound did, and the one after prices it on the loan.
How to use the SOFR forward curve in a debt model
Match the curve to the loan’s reset tenor, weight each reset by the days it covers in the fiscal year, use published fixings for the part of the year already past, and stamp the close the curve is from.
Compound’s Forward Curve tab does this in four steps, each one a formula a reviewer can follow:
- Pick the tenor the loan resets on. The term loan resets on three-month Term SOFR, so the schedule reads the 3M forwards; a switch moves it to the 1M curve. The difference is small: the fiscal-year average of the 1M forwards runs 1 to 5 basis points below the 3M, 4.45% against 4.51% in 2027.
- Weight each quarterly reset by its days in the year. A reset on October 29 covers three months that straddle December, so its rate counts in two fiscal years in proportion to the days in each. Fiscal 2026 starts at the June 25 close and runs 189 days.
- Use published fixings for the past. 126 of those 189 days were already behind the model on the day of the run, so they use the New York Fed’s daily SOFR fixings, which averaged 3.72%, and only the last 63 days use the curve. That is why 2026 sits just 30 basis points above the flat rate while every later year is 88 to 107 basis points above it.
- Stamp the close. The curve is fitted to one day’s swap trades and moves every day, so the tab names the close it is from (October 27, 2026) and the number of trades behind it (268). A rerun on a later close changes every number on this page, so the model is rebuilt on the latest curve before each committee.
Shocks are applied to the curve itself, as parallel shifts of every forward, and the published fixings stay as they were. The Rate Cases tab carries each path, so the whole schedule, the credit statistics and the returns switch between flat SOFR, the curve and each shock from one cell.
Term loan interest: flat SOFR vs the forward curve
On the curve, the term loan pays $27.7 million to $32.6 million more cash interest every year from 2027. Over the hold to 2030 that adds up to $129.0 million, and cash interest cover stays between 2.0x and 2.2x through 2029.
Compound kept every other term of the existing schedule: the 4.50% margin stepping down to 4.25% from 2028, the 2.25% of margin paid in kind until June 2028 with its 0.25% step-up, the excess cash flow sweep and the sponsor’s optional sweep. Only the SOFR row changed, so the difference below is the curve and nothing else.
| B | D | E | F | G | H | I | K | |
|---|---|---|---|---|---|---|---|---|
| 5 | Fiscal year | 2026E | 2027E | 2028E | 2029E | 2030E | 2031E | FY26-FY30 |
| 6 | SOFR, fiscal-year average | |||||||
| 7 | Term SOFR held flat (21-Oct-26 schedule) | 3.53% | 3.53% | 3.53% | 3.53% | 3.53% | 3.53% | |
| 8 | Market-implied SOFR forward curve | 3.83% | 4.51% | 4.60% | 4.49% | 4.42% | 4.41% | |
| 9 | Curve less flat (bp) | 30 | 98 | 107 | 96 | 89 | 88 | |
| 10 | Term loan cash interest | |||||||
| 11 | Flat | 81.3 | 157.9 | 182.4 | 203.6 | 192.3 | 176.3 | 817.6 |
| 12 | Forward curve | 85.5 | 185.6 | 215.0 | 235.6 | 223.8 | 208.4 | 945.6 |
| 13 | Extra cash interest on the curve | 4.2 | 27.7 | 32.6 | 32.0 | 31.5 | 32.2 | 128.0 |
| 14 | Term loan PIK interest accrued | |||||||
| 15 | Flat | 35.2 | 68.3 | 31.0 | – | – | – | 134.5 |
| 16 | Forward curve | 35.2 | 68.7 | 31.6 | – | – | – | 135.5 |
| 17 | Extra PIK on the curve | – | 0.4 | 0.5 | – | – | – | 0.9 |
| 18 | Term loan total interest (cash + PIK) | |||||||
| 19 | Flat | 116.5 | 226.2 | 213.5 | 203.6 | 192.3 | 176.3 | 952.1 |
| 20 | Forward curve | 120.7 | 254.3 | 246.6 | 235.6 | 223.8 | 208.4 | 1,081.0 |
| 21 | Extra total interest on the curve | 4.2 | 28.1 | 33.1 | 32.0 | 31.5 | 32.2 | 129.0 |
| 22 | Cumulative extra total interest | 4.2 | 32.3 | 65.5 | 97.5 | 129.0 | 161.1 | 129.0 |
| 23 | Cash interest cover: Adj. EBITDA / cash interest and fees, all facilities | |||||||
| 24 | Flat | 2.09x | 2.42x | 2.41x | 2.52x | 2.97x | 3.59x | |
| 25 | Forward curve | 1.99x | 2.07x | 2.05x | 2.18x | 2.55x | 3.04x | |
| 26 | Change | (0.10x) | (0.35x) | (0.36x) | (0.34x) | (0.42x) | (0.55x) | |
| 27 | 1L net leverage: net debt / Adj. EBITDA | |||||||
| 28 | Flat | 7.92x | 6.71x | 5.74x | 4.83x | 4.03x | 3.26x | |
| 29 | Forward curve | 7.94x | 6.79x | 5.88x | 5.01x | 4.25x | 3.50x | |
| 30 | Change | 0.01x | 0.08x | 0.14x | 0.19x | 0.22x | 0.25x |
Three things stand out to me in this table.
The PIK barely moves. The paid-in-kind interest is a fixed 2.25% of margin plus the step-up, not SOFR, so the higher curve flows almost entirely into cash interest: $128.0 million of the $129.0 million. A sponsor who elected PIK to protect early liquidity gets no help from it against rates.
Cover is worst exactly where the model was most comfortable. On a flat 3.53%, cash interest cover was 2.4x in 2027 and 2028; on the curve it is 2.1x in both years, because the curve’s peak sits in that window. A credit memo that quoted 2.4x for those years quoted a number the market does not support.
The sponsor’s return hardly moves. Net debt at the 2030 exit is $126.0 million higher, which against $5.7 billion of sponsor equity takes the IRR from 21.1% to 20.8%. The borrower pays the higher rate, but the lender carries the credit consequence of thinner cover, which is why the hedging terms in the credit documents get read from the lender’s side first.
Does the credit agreement require an interest rate hedge?
No. Compound read the debt commitment letter and the merger proxy: neither has a hedging covenant, so whether to hedge is the sponsor’s decision.
The amended and restated debt commitment letter has no covenant requiring a hedge. Its hedging language covers only security: a hedge entered with a lender or one of its affiliates can, “at the option of the Borrower”, share the guarantees and the first-lien security pari passu with the facilities (Exhibit B, pp. B-8 to B-9). The merger proxy’s only hedging language is the pre-closing covenant that the company will not enter “any swap or hedging transaction” before the deal closes (DEFM14A, p. 125).
So the sponsor chooses. Compound modeled the two standard answers on $1,350 million, half the term loan, from the curve’s spot date to the third anniversary of close.
| B | D | |
|---|---|---|
| 6 | Hedging required by the debt commitment letter or the merger proxy | None |
| 7 | Notional: 50% of the $2,700m term loan | 1,350.0 |
| 8 | Effective date (later of close and curve spot) | 29-Oct-26 |
| 9 | Maturity (third anniversary of close) | 25-Jun-29 |
| 10 | Peak 3M forward resetting within the term | 4.66% |
| 11 | Cap strike: peak forward rounded up to the next 0.25% | 4.75% |
| 12 | Swap fixed rate: par rate the 3M curve implies for the term | 4.51% |
| 13 | Cap premium | Not priced |
An interest rate cap and a pay-fixed swap on half the loan
Neither hedge pays anything on the curve itself. At 100 basis points above the curve, the cap pays $27.7 million and the swap $36.5 million over three years; at 200 basis points, $64.1 million and $72.9 million.
An interest rate cap pays the borrower whenever SOFR resets above the strike, on the capped notional, in exchange for an upfront premium. Setting the strike at 4.75%, just above the curve’s 4.66% peak, makes it a tail hedge: out of the money on every forward, so it pays only if rates beat what the market already expects. It costs less than an at-the-money cap, but 9 basis points above the peak forward on $1,350 million is still close to the money, so the premium is material. A pay-fixed swap converts the floating rate to a fixed 4.51% on the notional, the rate at which the curve values it at zero, so it costs nothing upfront and nets close to nothing on the curve. It pays when SOFR rises and costs when SOFR falls.
| B | D | E | F | G | H | I | K | |
|---|---|---|---|---|---|---|---|---|
| 15 | Cap payout received | 2026E | 2027E | 2028E | 2029E | 2030E | 2031E | Total |
| 16 | Forward curve | – | – | – | – | – | – | – |
| 17 | Curve +100bp | 0.7 | 10.3 | 11.6 | 5.0 | – | – | 27.7 |
| 18 | Curve +200bp | 3.1 | 24.0 | 25.4 | 11.6 | – | – | 64.1 |
| 19 | Peak forward held | – | – | – | – | – | – | – |
| 20 | ||||||||
| 21 | Swap net settlement paid / (received) | 2026E | 2027E | 2028E | 2029E | 2030E | 2031E | Total |
| 22 | Forward curve | 1.1 | 0.0 | (1.2) | 0.0 | – | – | (0.1) |
| 23 | Curve +100bp | (1.3) | (13.6) | (15.0) | (6.6) | – | – | (36.5) |
| 24 | Curve +200bp | (3.6) | (27.3) | (28.7) | (13.2) | – | – | (72.9) |
| 25 | Peak forward held | 1.1 | 0.0 | (2.1) | (1.0) | – | – | (2.0) |
On the curve, the swap’s 4.51% is above SOFR only for its first two resets, at 4.05% and 4.33%; from April 2027 the 3M forwards run 4.49% to 4.66%, around or above the fixed rate. That is why it pays $1.1 million in 2026 and gets $1.2 million back in 2028. The curve’s easing to about 4.40% comes in 2029 to 2031, after the swap matures, so the swap gives up little against the forwards. What it gives up is the benefit if rates fall below them. The cap keeps that benefit, for an upfront premium the model does not include, and on these numbers that is all it buys: the swap pays more in every shock, and the capped revolver draws below leave the premium out. Both protect cash interest cover in the years it is already thinnest. With SOFR 200 basis points above the curve, the swap takes term loan cash interest from $242.5 million to $214.7 million in 2027 and from $277.0 million to $246.2 million in 2028; the shocks below show what that does to cover.
Rate shocks: where cash interest cover bottoms
On the outside-in case, the loan never draws more than $33 million of the revolver even at 200 basis points above the curve. On the downside case the same shock takes cash interest cover to 1.34x and draws $258 million of the $325 million revolver; either hedge cuts the draw by about $100 million.
Compound ran each rate path through both operating cases from the LBO model, unhedged, capped and swapped. The shocks move the whole forward curve in parallel; SOFR already fixed since the close is left as it was. The peak-held path follows the curve to its 4.66% peak and stays there.
| B | D | E | F | G | H | I | J | K | L | |
|---|---|---|---|---|---|---|---|---|---|---|
| 38 | Unhedged | Capped | Swapped | |||||||
| 39 | Rate path | Cover | Year | Revolver | Cover | Year | Revolver | Cover | Year | Revolver |
| 40 | Term SOFR held flat (21-Oct-26) | 2.09x | 2026 | – | 2.09x | 2026 | – | 2.04x | 2026 | – |
| 41 | Forward curve | 1.99x | 2026 | – | 1.99x | 2026 | – | 1.97x | 2026 | – |
| 42 | Curve +100bp | 1.79x | 2028 | 1.0 | 1.89x | 2027 | 0.2 | 1.92x | 2026 | – |
| 43 | Curve +200bp | 1.59x | 2027 | 32.9 | 1.77x | 2027 | 2.5 | 1.79x | 2029 | 1.9 |
| 44 | Peak forward held | 1.99x | 2026 | – | 1.99x | 2026 | – | 1.97x | 2026 | – |
| B | D | E | F | G | H | I | J | K | L | |
|---|---|---|---|---|---|---|---|---|---|---|
| 48 | Unhedged | Capped | Swapped | |||||||
| 49 | Rate path | Cover | Year | Revolver | Cover | Year | Revolver | Cover | Year | Revolver |
| 50 | Term SOFR held flat (21-Oct-26) | 1.96x | 2026 | 2.8 | 1.96x | 2026 | 2.8 | 1.88x | 2028 | 5.2 |
| 51 | Forward curve | 1.73x | 2028 | 7.0 | 1.73x | 2028 | 7.0 | 1.74x | 2028 | 8.1 |
| 52 | Curve +100bp | 1.51x | 2028 | 97.5 | 1.59x | 2028 | 64.4 | 1.62x | 2029 | 53.9 |
| 53 | Curve +200bp | 1.34x | 2028 | 257.7 | 1.46x | 2029 | 162.1 | 1.47x | 2029 | 149.0 |
| 54 | Peak forward held | 1.71x | 2028 | 7.7 | 1.71x | 2028 | 7.7 | 1.73x | 2028 | 8.1 |
My read is that the curve alone thins coverage without threatening the loan: 1.99x at worst on the outside-in case and 1.73x on the downside, with the revolver all but untouched. The risk sits in the combination of a weaker business and rates above the curve. That is the cell a credit committee should look at, and it is the one a hedge on half the loan moves most, from 1.34x to 1.46x and from $258 million of revolver to about $150 million to $160 million.
The limit in that cell is liquidity. The revolver’s springing test is 15.00x first-lien net leverage against about 8x in the model, and it springs only when drawings net of cash exceed $260 million; with the $75 million minimum cash, even the unhedged $258 million draw stays below that. Unhedged, though, the loan has about $67 million of the revolver left; hedged, about $165 million to $175 million. What would change the view: a curve that moves up by 50 basis points or more before the sponsor acts, which would push the strike and the swap rate up with it, or a business running below the downside case, where even the hedged loan starts to run out of revolver.
The result on one page
The curve adds $129 million of interest, costs the sponsor 0.3 points of IRR and costs the lender up to half a turn of cover. A hedge is optional and only earns its keep in the downside.
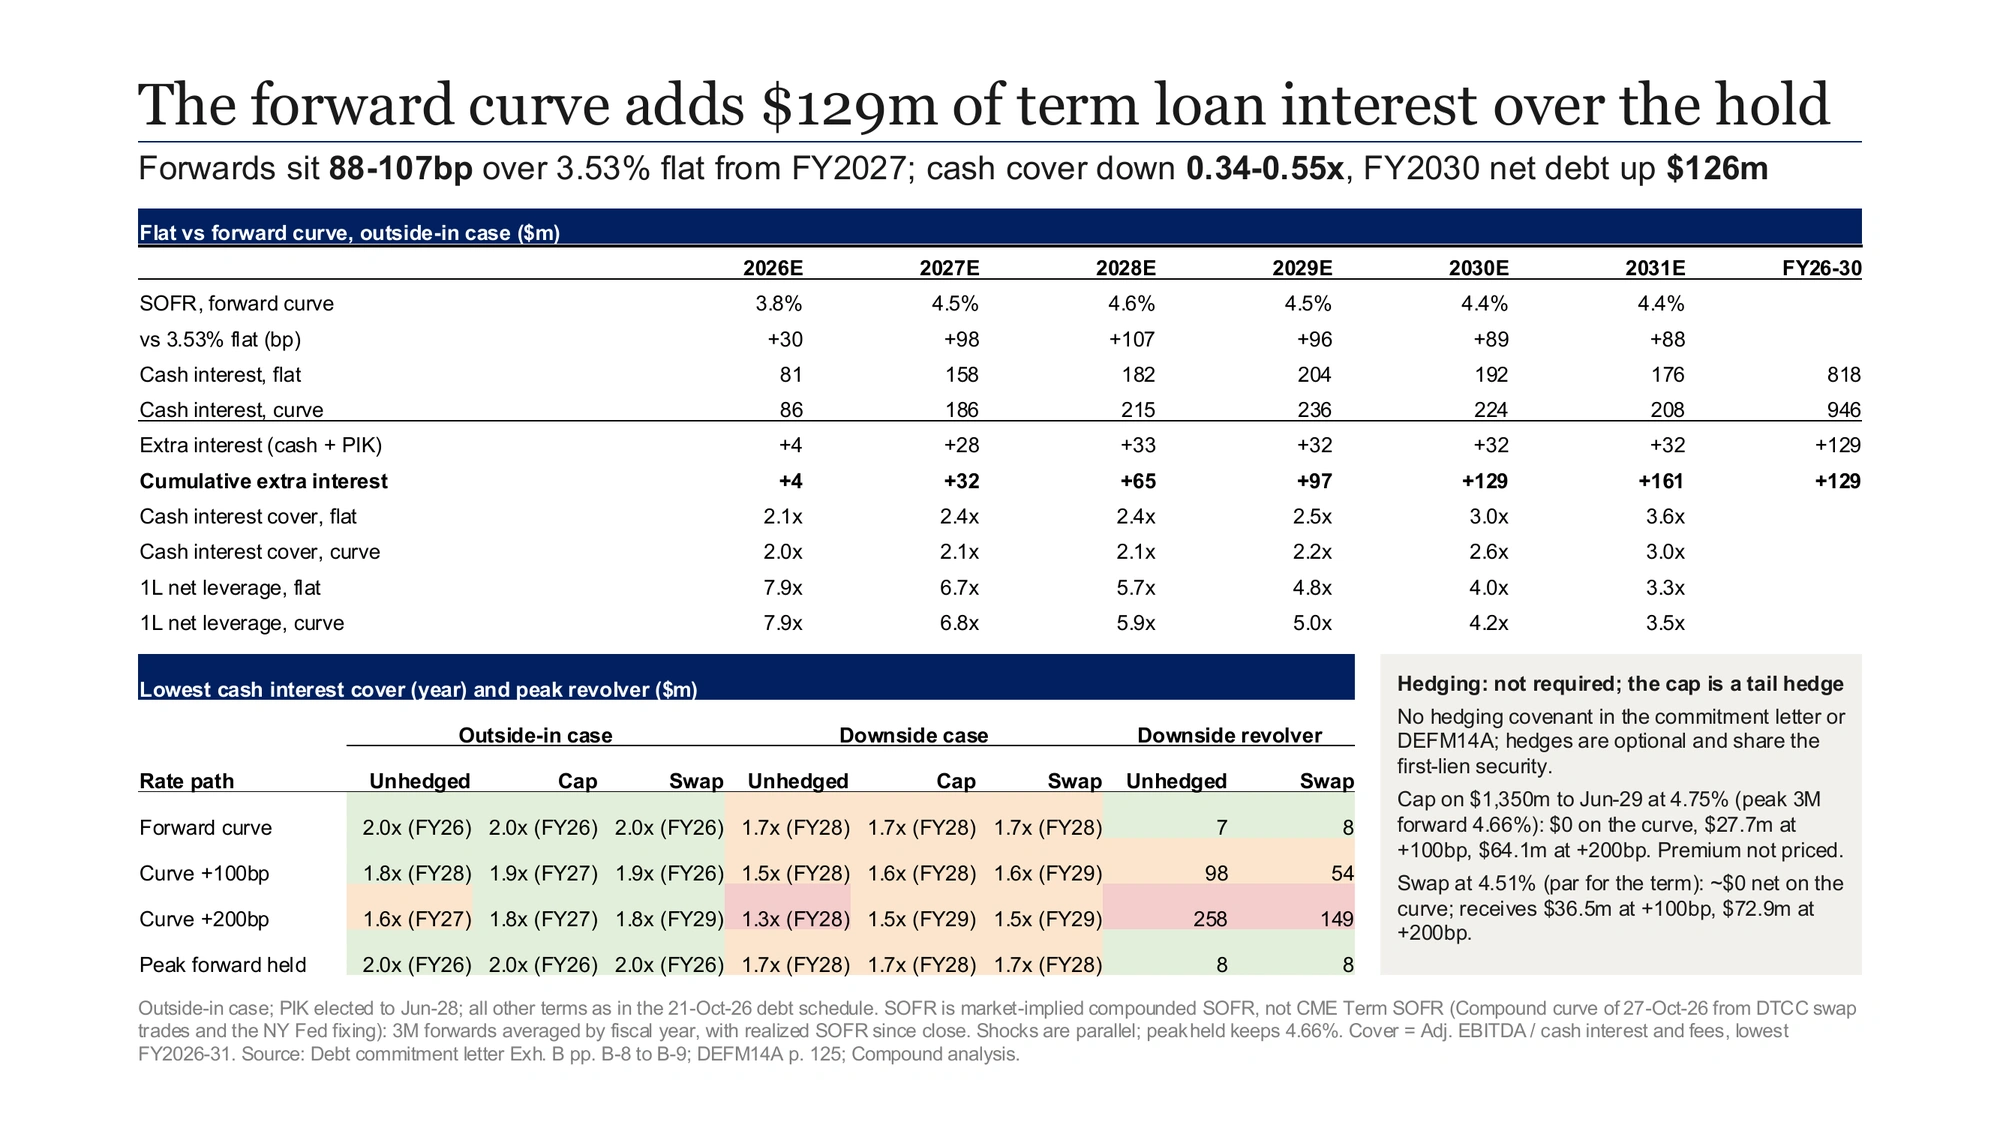
The workbook download on this page is Compound’s file from this run, with private citations removed. The Rate Cases tab switches the whole schedule between flat SOFR, the curve and each shock; the 1M toggle on the Forward Curve tab reprices the loan on one-month forwards instead of three-month.