Stress-Testing ADT's Take-Private
An outside-in look at Thrive's $10.00 take-private of ADT: where the 21.2% IRR comes from, how the Downside gets there and how much room the plan has.
by Compound Team · October 30, 2026 · 11 min read
On 29 October Exec Sum posted on X that Thrive Holdings would take ADT private. Our deal-monitor agent, which watches X for deals like this, pinged us within hours with a first LBO model, an IC-style deck and a one-line view: back the deal at $10.00, but only if ADT cuts its cost to serve and customer churn. That first pass returned 21.2% and 2.61x on its Base case over five years, against a 20% hurdle. We then went back to the model and sensitized the deal.
This is an outside-in analysis. The model is built from ADT’s filings, the merger 8-K and market data, not from the buyers’ or management’s projections, and the 20% hurdle and the financing terms are our assumptions. Every figure below is from Compound’s internal analysis on that model; the workbook is at the end of the post.
What $10.00 a share pays
At $10.00 Thrive pays 5.7x LTM adjusted EBITDA, against 4.9x for ADT before the bid and 10.1x for Verisure, the closest listed monitoring peer. The Base case exits at 6.0x; a conservative case should assume no expansion, or less.
| EV / LTM adjusted EBITDA | Multiple |
|---|---|
| ADT at the $6.87 unaffected price | 4.9x |
| ADT at the $10.00 offer | 5.7x |
| Model’s exit, FY31 (Base case) | 6.0x |
| Brink’s (security services) | 7.5x |
| Verisure (alarm monitoring) | 10.1x |
Enterprise value of $15.4 billion at the offer on LTM adjusted EBITDA of $2.7 billion; peers at 28 October 2026 prices.
Brink’s and Verisure trade higher mainly because they grow faster, 8% and 10% a year against ADT’s 5%; leverage is not the difference, at 2.9x net debt to EBITDA for ADT and Brink’s and 3.4x for Verisure. ADT’s adjusted EBITDA is also measured before about $1.1 billion a year of subscriber acquisition spend: after that spend and capex, $10.00 is 11.4x FY25 cash earnings, so the deal is cheap on EBITDA but not on cash flow. The question for the exit is whether a buyer in 2031 pays more than Thrive did. The model says slightly more, 6.0x. Holding the exit at the 5.7x paid, the Base case returns 19.4% and misses the hurdle; at the 4.9x ADT traded at before the bid, 12.6% and 1.81x. So on a conservative exit the Base plan alone does not clear 20%: the deal needs either a modest re-rating or operations that beat its own Base case. Keep that in mind through everything below.
Start where the committee starts
At the $10.00 offer the Base case needs an exit at or above about 5.8x. At 5.5x it returns 17.7%; at 6.5x, 24.3%.
Sponsor IRR by exit multiple and offer price
Base case, FY31 exit; every other input at Base
| Exit multiple (LTM adj. EBITDA) | Offer price per share | ||||
|---|---|---|---|---|---|
| $9.00 | $9.50 | $10.00 | $10.50 | $11.00 | |
| 5.0x | 18.0% | 15.8% | 13.8% | 12.1% | 10.5% |
| 5.5x | 22.1% | 19.8% | 17.7% | 15.9% | 14.2% |
| 6.0x | 25.7% | 23.3% | 21.2% | 19.3% | 17.5% |
| 6.5x | 28.9% | 26.4% | 24.3% | 22.3% | 20.5% |
| 7.0x | 31.8% | 29.3% | 27.1% | 25.1% | 23.2% |
Green at or above a 20% IRR, red below; the boxed cell is the Base case at the $10.00 offer. Each cell is a live Excel data table on the model.
Each half-turn of exit multiple is worth about 3 points of IRR and each 50 cents of offer price about 2. That is useful, and it is all the grid says. ADT’s own risks are not price and exit multiple: they are how many subscribers leave each year, what it costs to win new ones, and whether overhead comes down as planned. The model has a Downside, Base and Upside row for each of those, and the grid holds all of them at Base.
The grid can take two of them at a time:
Sponsor IRR by attrition and adjusted SG&A
Base case, FY31 exit, $10.00 offer; FY27–31 averages, each moving its whole per-year path
| Gross revenue attrition | Adjusted SG&A, % of revenue | ||||
|---|---|---|---|---|---|
| 23.2% | 24.5% | 25.7% | 27.0% | 28.2% | |
| 10.9% | 26.5% | 25.1% | 23.7% | 21.9% | 20.0% |
| 11.5% | 25.3% | 23.9% | 22.4% | 20.6% | 18.7% |
| 12.1% | 24.1% | 22.7% | 21.2% | 19.3% | 17.3% |
| 12.7% | 23.0% | 21.5% | 20.0% | 18.1% | 16.1% |
| 13.3% | 21.8% | 20.3% | 18.8% | 16.8% | 14.8% |
Green at or above a 20% IRR, red below; a red 20.0% sits just under the hurdle. The boxed cell is the Base case.
Six operating drivers, the price and the exit multiple make 28 possible pairs. Nobody reads 28 grids, and even if they did, the Downside case moves all six drivers at once. Four more views cover what the grids leave out.
Where the return comes from
Of the $7.3 billion of equity value the Base case creates, half comes from paying down debt. Multiple expansion contributes $0.9 billion, and without it the deal misses the hurdle: exiting at the 5.7x paid returns 19.4%.
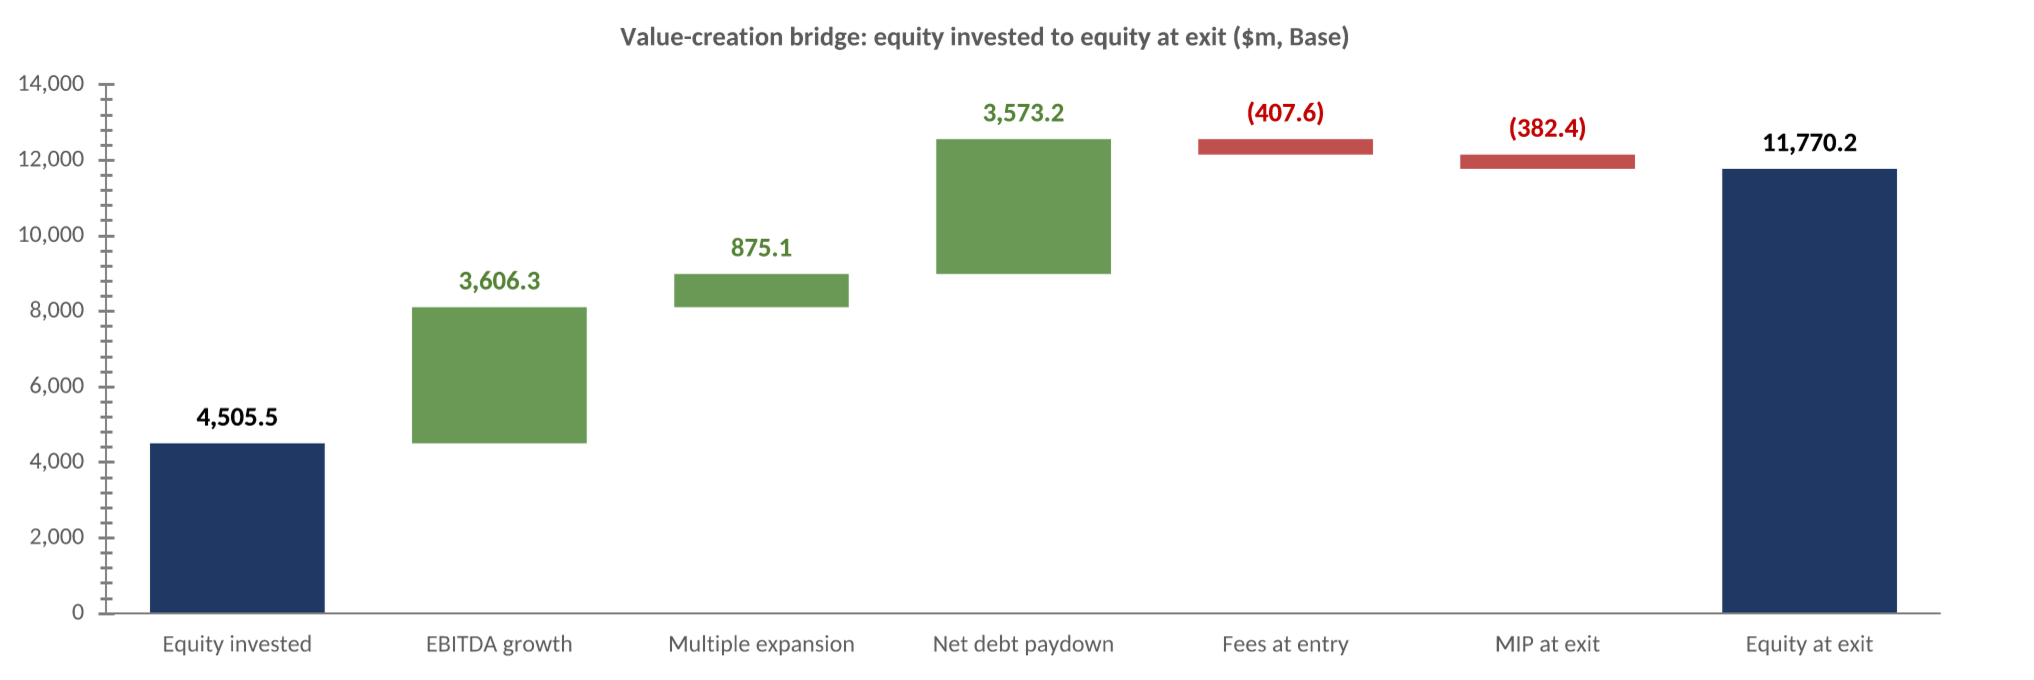
This is the bridge a partner asks for first, and on ADT it confirms what the multiples suggested. The 6.0x exit is only 0.3 turns above the 5.7x paid, which sounds modest. But the deal clears 20% by 1.2 points and those 0.3 turns are worth 1.8, so the pass rests on the re-rating. Debt paydown is the steadier leg: ADT’s subscriber base throws off cash, and $3.6 billion of net debt comes down over five years.
How the Downside gets there
The model’s Downside returns 3.2% and its Upside 27.6%. Adjusted SG&A explains 5.9 of the 18 points between Downside and Base, more than attrition at 3.9.
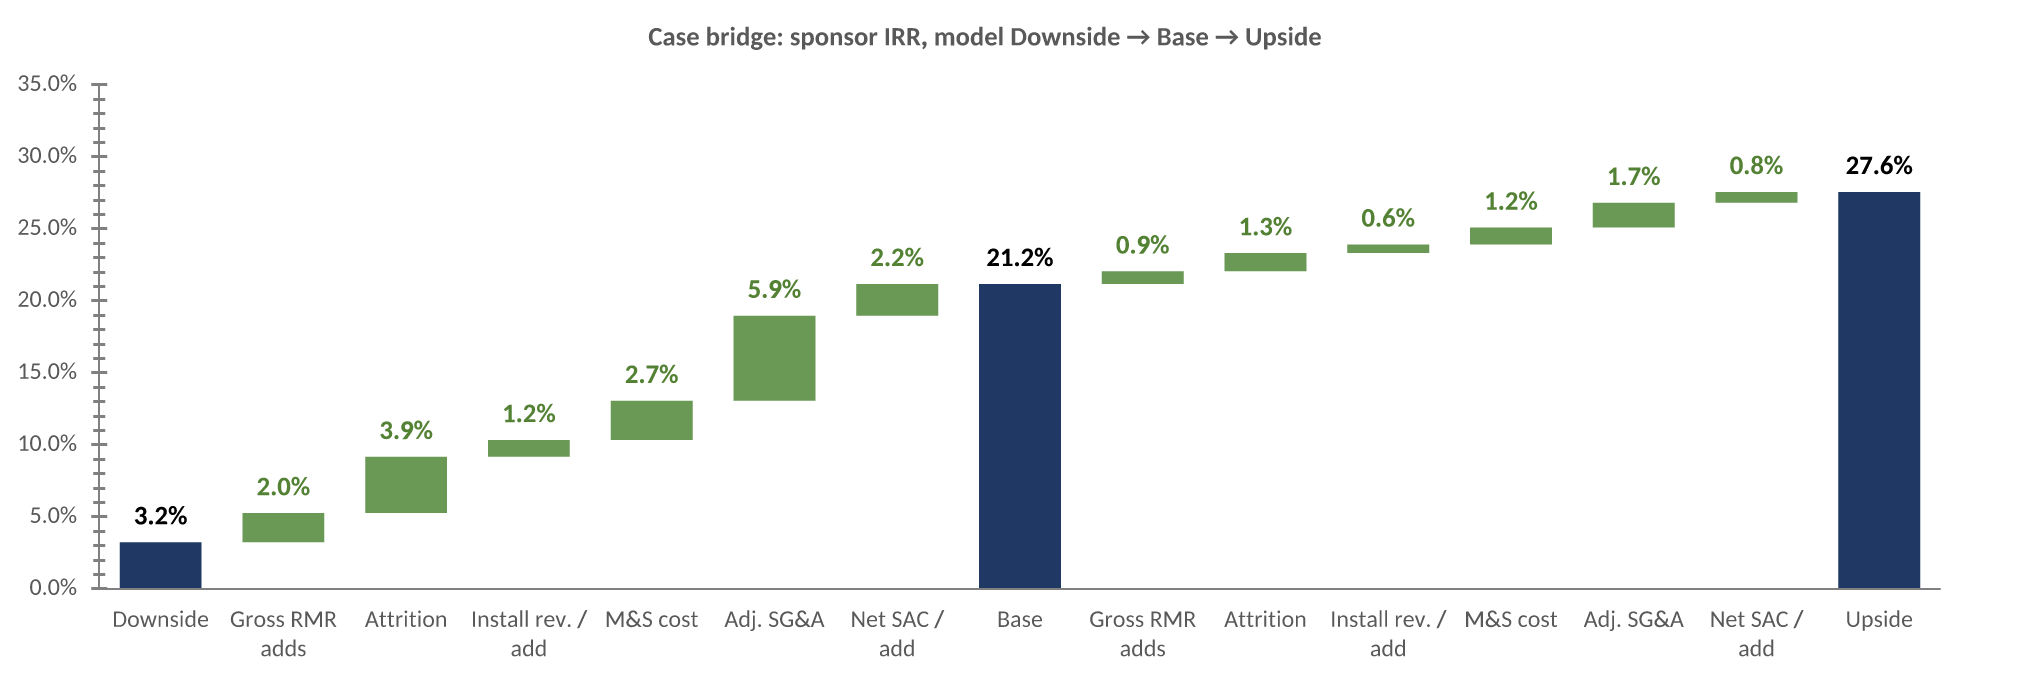
Each bar moves one driver from one of the model’s cases to the next, in points of sponsor IRR (Downside → Base, then Base → Upside):
- Gross RMR adds (+2.0, then +0.9): new recurring monthly revenue (RMR) won each year, as a share of the opening base. 12.9% falling to 12.3% in the Downside, 13.4% rising to 14.0% in the Base, 13.7% rising to 14.7% in the Upside.
- Attrition (+3.9, then +1.3): revenue lost to cancellations. 13.4% rising to 14.0% in the Downside, 12.8% falling to 11.5% in the Base, 12.4% falling to 10.8% in the Upside.
- Install rev. / add (+1.2, then +0.6): what ADT charges to install each new dollar of monthly revenue. Flat at 17.0x in the Downside, 18.5x rising to 20.5x in the Base, 19.5x rising to 22.5x in the Upside.
- M&S cost (+2.7, then +1.2): monitoring and service cost, which includes running the monitoring centres, as a % of monitoring and service revenue. Flat at 14.7% in the Downside, 14.0% falling to 12.0% in the Base, 13.5% falling to 10.5% in the Upside.
- Adj. SG&A (+5.9, then +1.7): overhead as a % of revenue. Flat at about 29% in the Downside, 27.5% falling to 24.2% in the Base, 26.5% falling to 22.5% in the Upside.
- Net SAC / add (+2.2, then +0.8): net subscriber acquisition cost, ADT’s net spend to win each new dollar of monthly revenue. 25.0x rising to 26.5x in the Downside, 23.5x falling to 22.2x in the Base, 22.5x falling to 20.5x in the Upside.
Each bar is the driver’s average contribution over every order in which the six could be switched, so the bars add up exactly to the gap between the cases.
A Downside case usually arrives as one number. Walking it driver by driver turns it into a list of what has to go wrong, and the order matters: switch attrition first and it looks bigger than if it is switched last, because the drivers compound. Averaging over every order removes the argument about whose bar is bigger.
Two things stand out on ADT. First, the case is lopsided: the Downside sits 18 points below Base and the Upside only 6.4 points above it, so the model’s authors drew far more room to fall than to rise. Second, the biggest single lever is overhead. The debate on X was about churn and AI-run monitoring centres, and both matter: attrition is worth 3.9 points and monitoring and service cost 2.7. But the Base case also takes adjusted SG&A from 27.5% of revenue in FY27 to 24.2% by FY31, against 29% held flat in the Downside, and that one line is worth 5.9 points, more than either.
How much room each input has
The exit multiple can fall 0.2 turns before the Base misses 20%. Attrition has 0.6 points, SG&A 0.8 points, and the offer can rise 30 cents.
| Headroom to a 20% IRR | Base | Model Downside | Misses 20% at | Cushion | Loses money at |
|---|---|---|---|---|---|
| Exit multiple | 6.0x | 4.9x | 5.8x | (0.2x) | 3.7x |
| Adjusted SG&A, % of revenue | 25.7% | 29.0% | 26.5% | +0.8pp | 36.1% |
| Attrition | 12.1% | 13.8% | 12.7% | +0.6pp | 20.8% |
| Monitoring and service cost, % | 13.0% | 14.7% | 13.9% | +0.9pp | Not reached |
| Gross recurring revenue adds | 13.7% | 12.6% | 13.0% | (0.7pp) | Not reached |
| Offer price | $10.00 | $10.50 | $10.30 | +$0.30 | Not reached |
| Net acquisition cost per add | 22.8x | 25.9x | 24.8x | +2.0x | Not reached |
| Installation revenue per add | 19.5x | 17.0x | 16.7x | (2.8x) | Not reached |
Each input moved on its own along the path to its Downside, and past it where needed (installation revenue misses 20% only beyond its Downside), everything else at Base; operating inputs are FY27–31 averages. The exit multiple’s Downside is ADT’s multiple at the unaffected price; the offer’s is a 5% topping bid.
The headroom table is the one we would put in front of a partner. It answers the question every grid implies but none states: how wrong can this assumption be? Sorted by cushion, it says the deal’s margin for error is thin almost everywhere that matters.
Attrition is the clearest case. ADT’s gross revenue attrition was 13.1% in the twelve months to June 2026, up from 12.8% a year earlier. The Base case averages 12.1% over the hold, and the deal misses 20% at an average of 12.7%. Attrition held where it is today would be enough on its own to take the Base below the hurdle. That suggests the Base attrition assumption is too lenient, and it should not be relied on until churn shows it is turning.
The price line matters this month. The merger agreement has a go-shop to 28 November. On this model a buyer paying more than $10.30 on the same plan and financing would underwrite below 20%, which is a useful number to have before a topping bid arrives. Every input loses money only far beyond its Downside, so the risk on ADT is a thin return, not a lost one.
When the exit itself is uncertain
Weighting three exit routes by our own assessment gives a 17.5% IRR and 2.33x, below the 21.2% Base: a strategic sale clears the hurdle comfortably, an IPO in no case.
Most models assume one exit: here, a sale in FY31 at 6.0x. On ADT that assumption deserves a second look. Thrive Holdings is permanent capital, the obvious strategic buyers are few, and a re-IPO would price off a public multiple that sat at 4.9x before the bid. When the route out is genuinely open, a small decision tree adds what the other views cannot.
Each leaf is the model itself, run on a stated case, exit year and multiple, so every number in the tree can be traced. The probabilities are a judgment, and we label them as one. A strategic sale is possible but the field is thin: ADT is the largest US alarm monitor, so a security consolidator would face antitrust limits. A sponsor sale is the deepest market and the model’s own route. The IPO is the fallback if no buyer pays 6x, and it is most likely precisely when the plan has disappointed, which is why its Downside carries the most weight.
The weighted 17.5% is not a better Base case, and it sits beside the Base, not in place of it. What it shows is where the return is fragile: the Base clears the hurdle only on the routes that pay at least the model’s 6.0x. The tree is supplementary. Where the exit is clear, the first four views are the analysis and the tree is left out.
What we would take to committee
Read together, the four views give a tighter story than the grid alone. The deal clears 20% on the model’s Base, but by less than the multiple expansion it assumes. The plan rests on two operating turns, overhead falling more than three points of revenue and attrition reversing a rising trend, with 0.8 and 0.6 points of room respectively. The price has 30 cents. Diligence time should go where the cushion is thinnest: the SG&A program, the evidence that churn is turning, and the exit routes a permanent-capital owner would actually use.
Two caveats from the source model. Financing is sized from the 8-K as first and second lien debt plus common equity; the preferred equity commitment from Apollo funds named in the 8-K is not modelled, so the sponsor equity check and IRR could move once its terms are known. And ADT reports third-quarter results on 3 November, after this model was built.
How it is built
None of this needs a new model. The analysis adds one Sensitivity tab to the existing LBO and runs the model’s own formulas at different values of a handful of driver cells:
- One extra case on the model’s case switch. Each driver row gets a sensitivity case beside Downside, Base and Upside. On any of the model’s own cases, nothing changes and nothing reads the new tab.
- Levels from the model’s case rows. Downside, Base and Upside come straight from the rows the model already has, and a per-year path keeps its shape when it moves.
- Excel data tables for every output. The grids, the case bridge, the headroom breakevens and the tree leaves are live data tables over the model’s own IRR and MOIC, so they update when an assumption changes.
- 2,796 recalculations of the model. 250 for the ten grids, 128 for the case bridge, 2,408 for the headroom sweeps (eight inputs, 301 steps each), 9 for the tree leaves and 1 for the exit at the entry multiple. Each one is deterministic: the model runs at fixed input values, with no random draws, so this is not a Monte Carlo simulation.
On the finished LBO, the request to Compound reads like this:
Run the sensitivity analysis on the ADT LBO: the grids, a value-creation bridge, a case bridge from Downside to Base to Upside, and the headroom to a 20% hurdle. The exit route is open for a permanent-capital owner, so add the decision tree on exit routes.
Download the model
ADT take-private LBO with sensitivity analysis (Excel)The LBO model with the Sensitivity tab: inputs linked to the model’s Downside, Base and Upside rows, ten IRR grids, the value-creation bridge, the case bridge, the headroom table and the exit-route decision tree, each a live Excel data table. Open it in Excel and press F9 to refresh the tables.Download · FreeThis is the advanced version of a sensitivity analysis. For the standard version, a driver ranking and two-variable data tables on Clearwater Analytics’ take-private, see our sensitivity analysis example.