Anthropic IPO Valuation: Bottom-Up Build and Bull/Bear Cases
What $74 a share buys, how we built Anthropic's revenue from the ground up, how that compares with four outside forecasts, and what to pay depending on which one you believe.
Insights · by Hugo Leo · November 12, 2026 · 13 min read
Anthropic, PBC (Nasdaq: ANT) is pricing its IPO at $70.00 to $78.00 a share. At the $74.00 midpoint, investors pay $1,333bn for the whole company. Our bottom-up model on the 10 November preliminary prospectus says the Base case is worth $96 to $101 a share, so we would buy at or below $74. The answer changes with the forecast you believe: on Damodaran’s numbers $74 is too much, and on the bank’s it is cheap.
This post walks through the 12-page deck in order: the price, the business today, how we built the forecast, how it compares with other views, what to pay under each view, and what to watch.
We asked Compound to value the IPO from the S-1 and the roadshow, priced at the 9 November close:
Build an IPO model and IC deck on Anthropic (ANT) in our template: what should an investor pay at the $70-78 range? Build revenue bottom-up from business counts by Anthropic’s customer tiers, penetration, self-serve and new verticals, then take it down to EBITDA, FCF and a DCF, with Upside, Base and Downside cases. Run Management (Goldman revenue) and the Jon Ma, SemiAnalysis and Damodaran forecasts from X through the same model and show where we differ. The deck needs AVP with IRR by case, a football field, an S-1 scorecard and the revenue build. Model and deck must tie.
It built a nine-tab model and the deck, with every page sourced to the prospectus, the roadshow or a model tab. Both are free to download below.
Step 1: what $74 a share actually buys
The prospectus sets a range of $70.00 to $78.00. The midpoint of $74.00 is a 25.6% premium to the last private round (Series H, $58.90 a share).
To get from a share price to a company value:
- Basic shares. 13,087m shares outstanding after the offering, so $74 x 13,087m = $968bn of basic equity value.
- Fully diluted shares. Add everything that can become a share: 1,705m options (net of the cash paid to exercise them), 1,074m RSUs, 1,564m shares from convertible notes and 584m for donation matching and an acquisition. That gives 18,013m shares and $1,333bn of fully diluted equity value.
- Enterprise value. Subtract net cash of $213.4bn expected at the end of Q4’26, including the IPO proceeds: $1,120bn. This is the price of the business itself, before its cash pile.
Next, set that price against revenue. The multiple depends on which revenue you use, because revenue is growing so fast:
| Measure of revenue | Revenue | EV / revenue at $74 |
|---|---|---|
| Last twelve months (LTM, to Q3’26) | $35.3bn | 31.7x |
| October run rate, annualized | ~$81bn | 13.8x |
| Next twelve months (NTM, Base case) | ~$109bn | 10.3x |
| Peer median, NTM (15 AI infrastructure, hyperscaler and software names) | – | 6.8x |
Source: Anthropic preliminary prospectus (10 November 2026); Compound model, Valuation tab; FactSet at the 9 November 2026 close.
The 31.7x LTM multiple overstates the price. LTM revenue adds four quarters that grew from $2.0bn to $17.0bn, so it understates what the business earns today. On next year’s revenue, Anthropic is 10.3x against 6.8x for peers. That premium is for growth: NTM revenue grows about 208% against 31% for peers. Adjusted for growth, Anthropic is cheaper than the peer group (0.05x against 0.21x).
On earnings it is expensive: 54.2x NTM adjusted EBITDA against 13.0x for peers. Profits are only starting, so value has to come from what the company earns in 2030, not in 2027.
Step 2: where the business stands today
The S-1 confirms the growth is real. The scorecard reads each area of the prospectus and roadshow for an IPO investor:
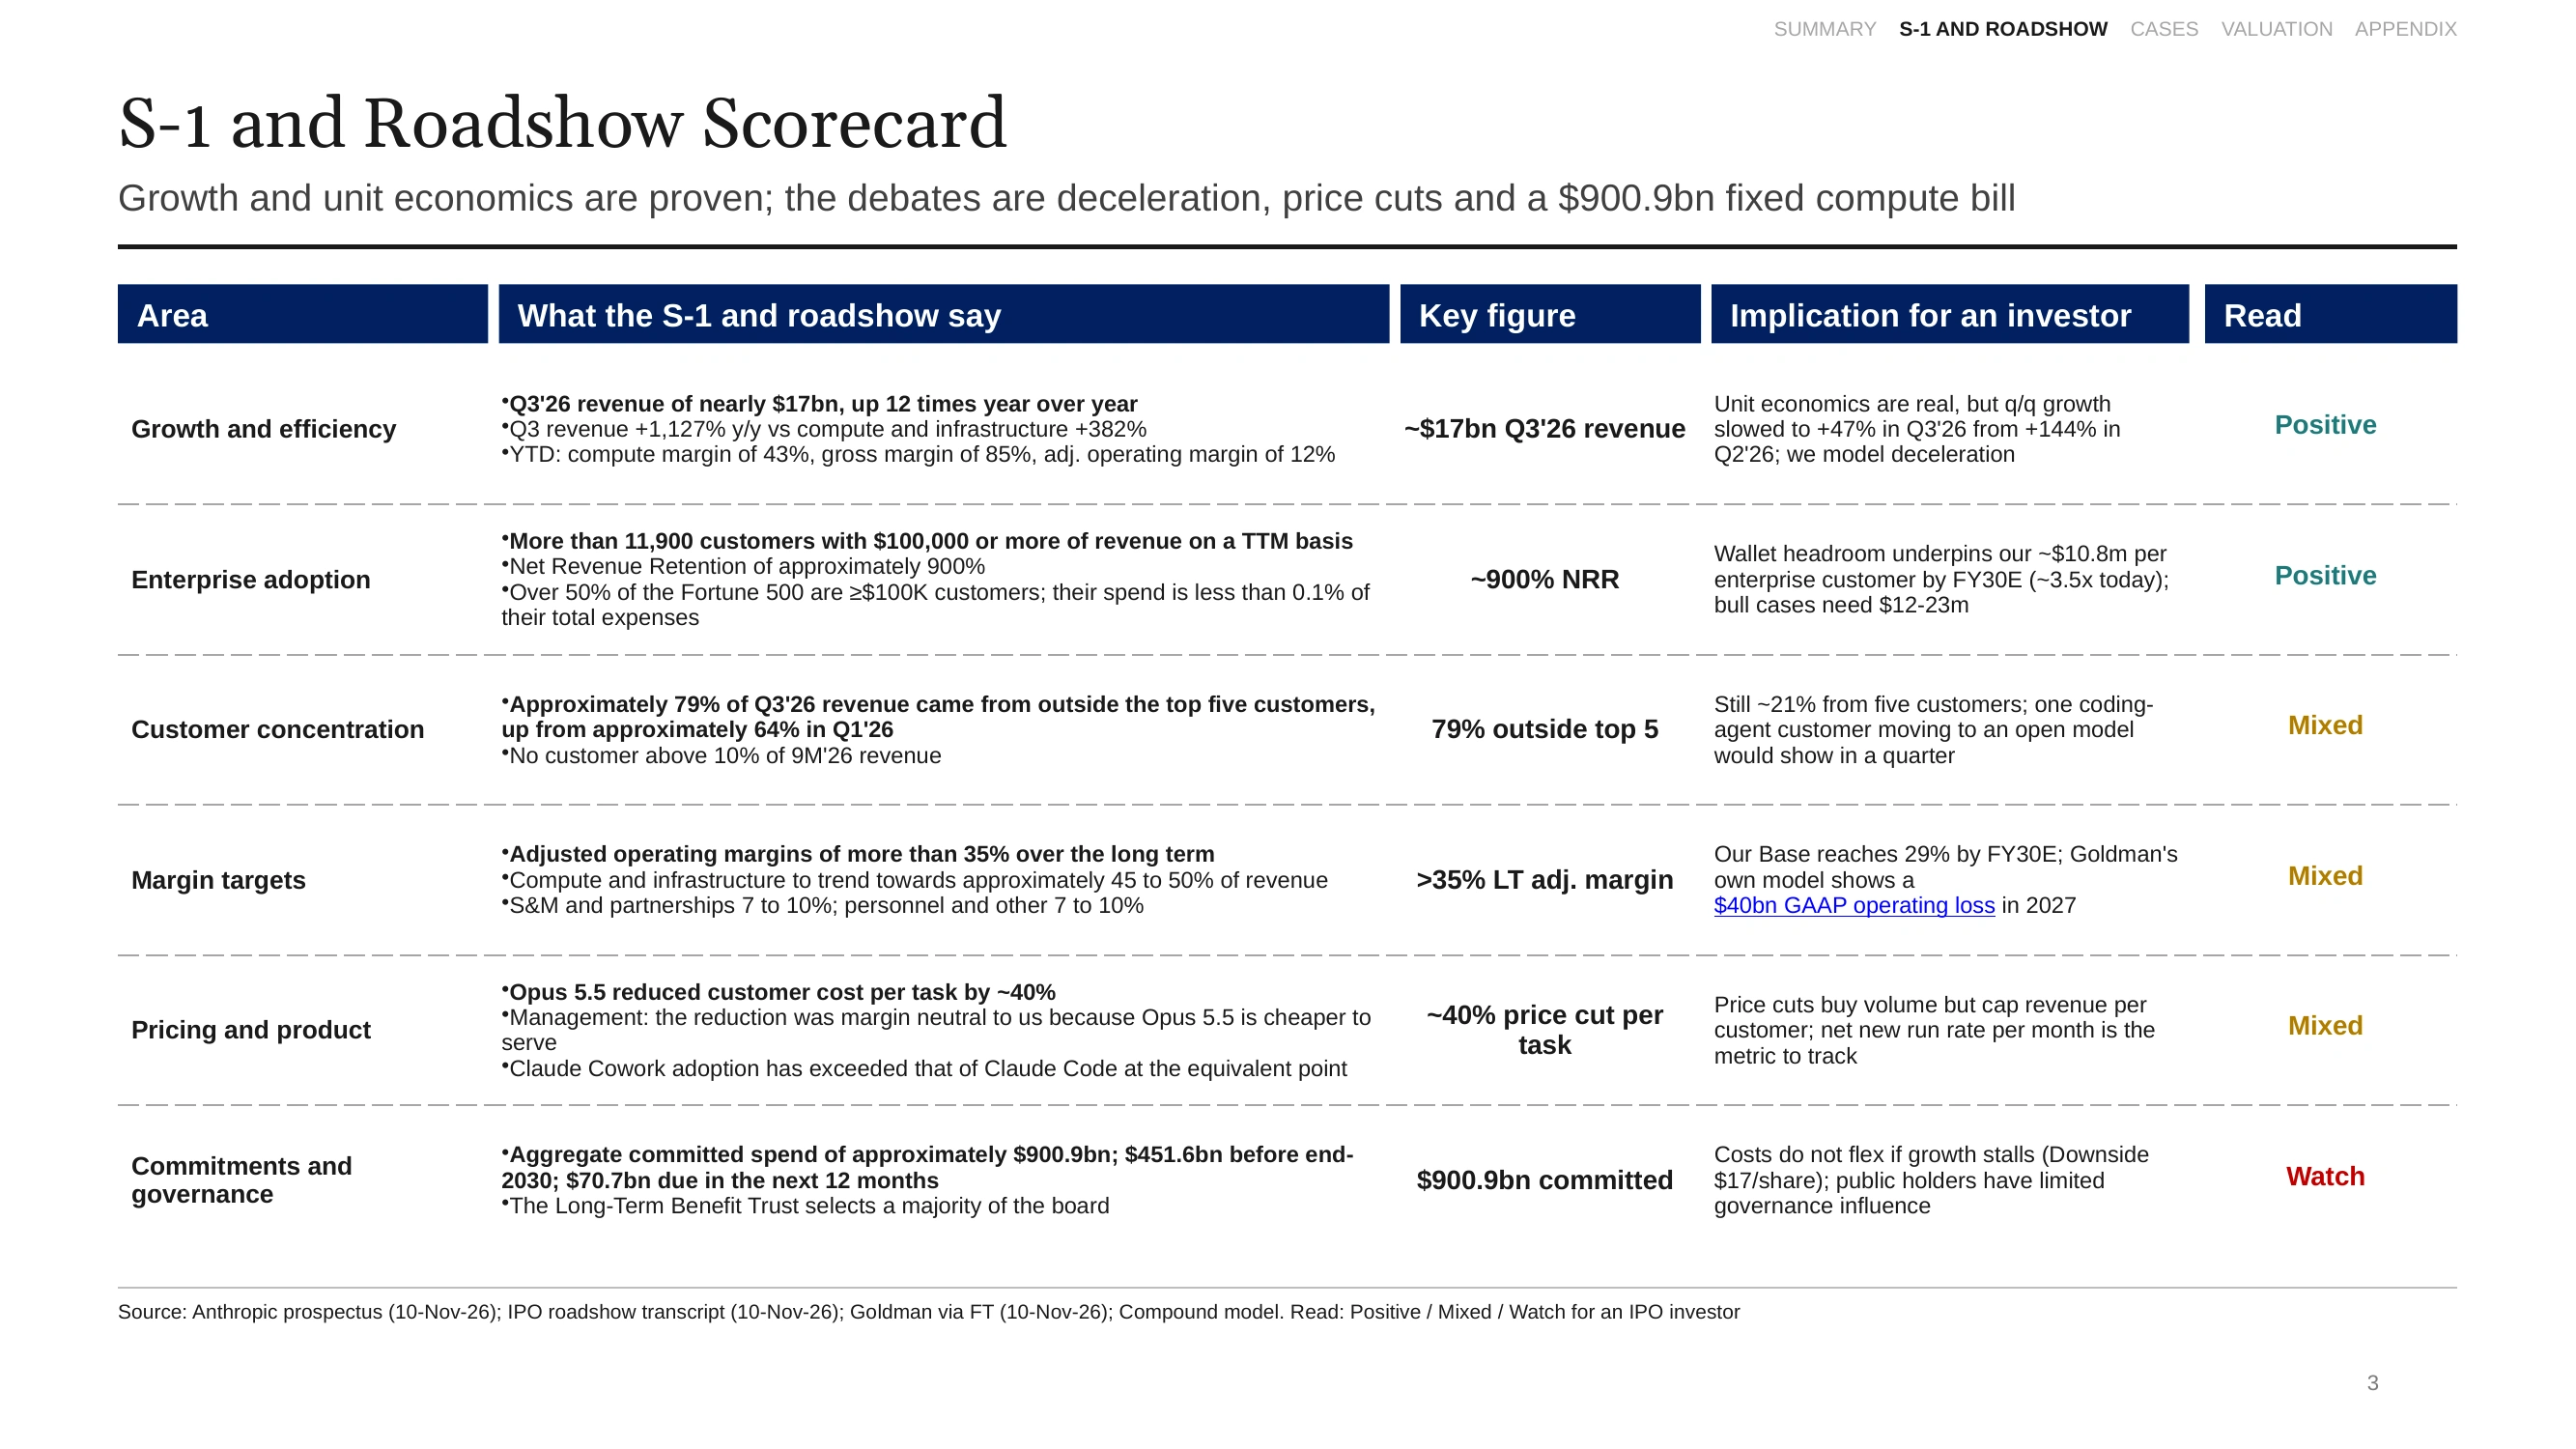
S-1 and roadshow scorecard: growth and adoption are proven; price cuts and fixed compute commitments are the debates.
- What’s proven. Q3’26 revenue of nearly $17bn, up 12 times year over year, at an 85% gross margin and a 12% adjusted operating margin year to date. More than 11,900 customers spend $100K+ a year, including over half the Fortune 500, who still spend less than 0.1% of their costs on Anthropic.
- What’s debated. Quarterly growth slowed to 47% in Q3 from 144% in Q2. Opus 5.5 cut customer cost per task by about 40%, which limits how much each customer pays.
- What to watch. About $900.9bn is committed to compute, $451.6bn of it before the end of 2030 and $70.7bn in the next 12 months. Those costs are due whether or not revenue grows. The Long-Term Benefit Trust also selects a majority of the board.
Everything after September is our estimate. That includes FY26E revenue of $53.7bn, which is nine reported months plus a modeled Q4.
Step 3: how we built the forecast, from the ground up
Most forecasts start from a growth rate. Ours starts from who the customers are and what they spend, then adds up three revenue lines. Revenue goes from $54bn in FY26E to $446bn in FY30E.
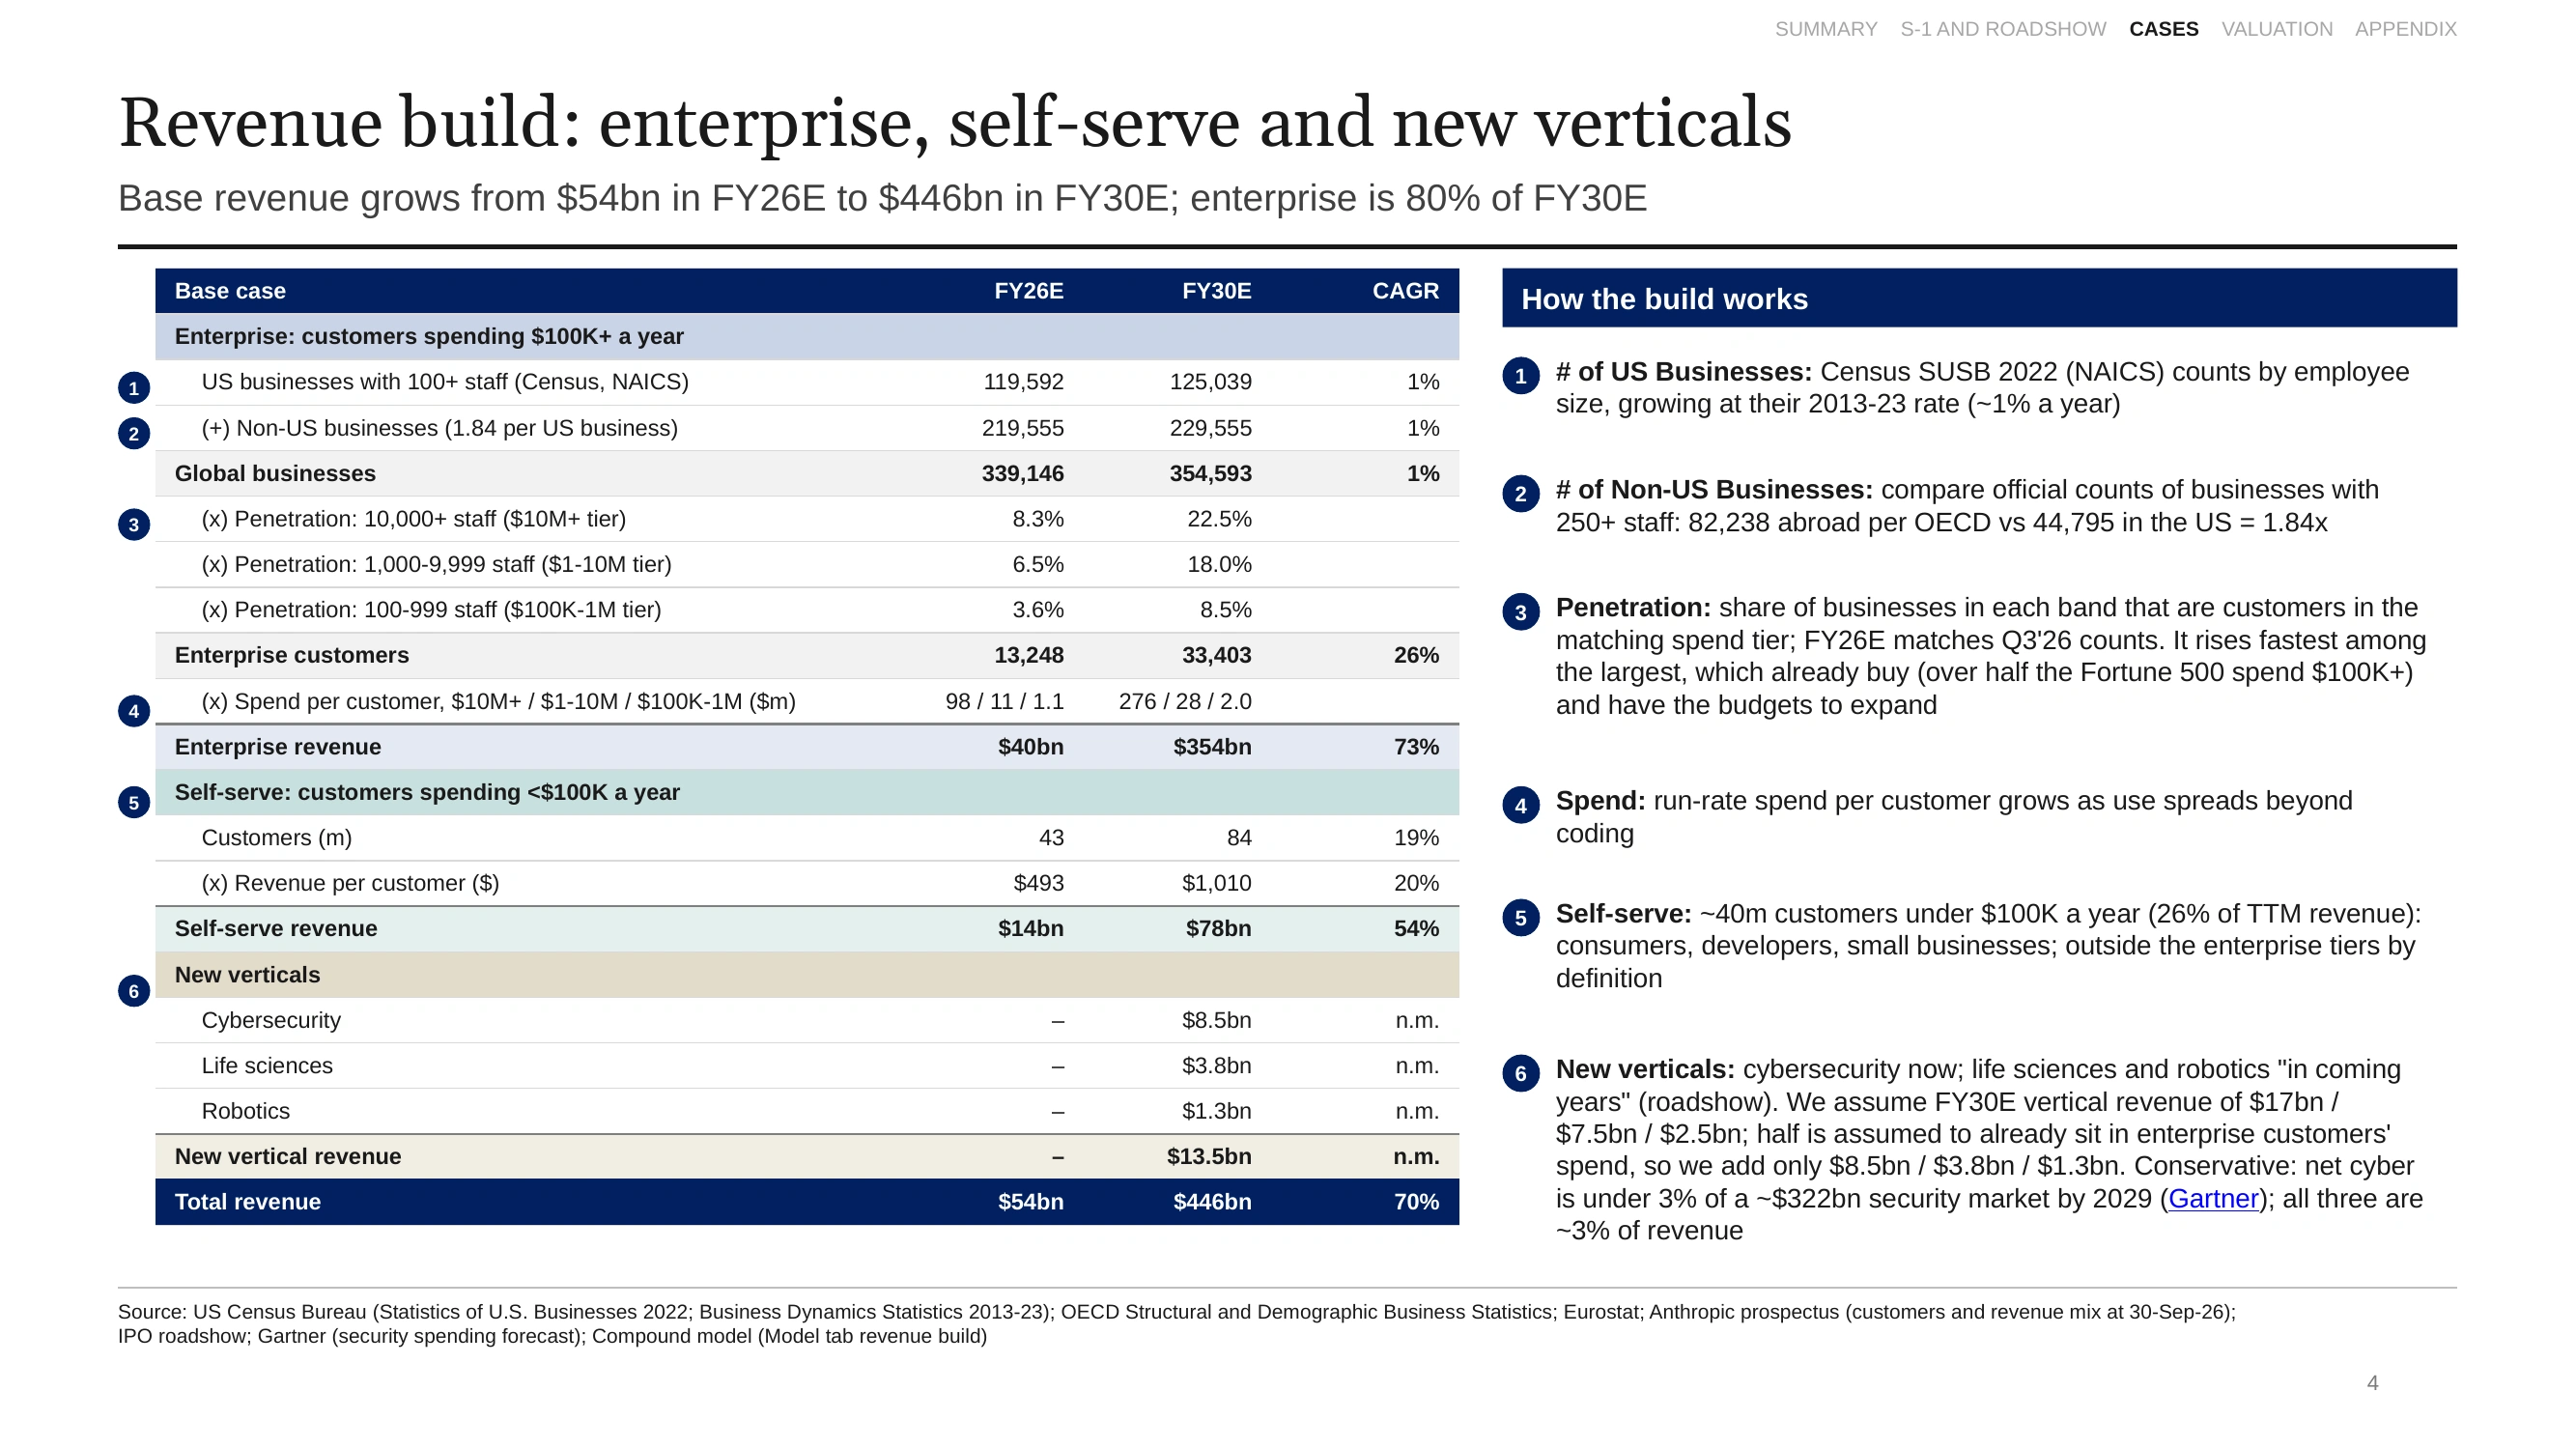
Revenue build, Base case: enterprise is 80% of FY30E revenue.
Line 1: Enterprise, customers spending $100K+ a year ($40bn to $354bn). The formula is businesses x share that become customers x spend per customer.
- Count the businesses. The US Census counts 119,592 US businesses with 100+ staff. The OECD counts 1.84 businesses abroad for every one in the US (82,238 against 44,795 with 250+ staff). That gives 339,146 businesses worldwide, growing about 1% a year.
- Split them by size. We assume the biggest businesses buy the most. Firms with 10,000+ staff go in the $10M+ spend tier, 1,000-9,999 staff in $1-10M, and 100-999 staff in $100K-1M.
- Apply penetration. This is the share of each size band that is a customer. Today it is 8.3%, 6.5% and 3.6%, which reproduces the Q3’26 customer counts. By FY30E it reaches 22.5%, 18.0% and 8.5%. It rises fastest among the largest firms, which already buy and have the budgets. Enterprise customers go from 13,248 to 33,403.
- Apply spend. Spend per customer rises from $98m, $11m and $1.1m by tier to $276m, $28m and $2.0m, as use spreads beyond coding. The average enterprise customer spends $10.8m in FY30E, about 3.5x today’s $3.1m.
Line 2: Self-serve, customers under $100K a year ($14bn to $78bn). These are consumers, developers and small businesses. About 40m customers produce 26% of revenue today. In the Base they double to 84m, and spend per customer roughly doubles to $1,010.
Line 3: New verticals ($13.5bn by FY30E). On the roadshow, management named cybersecurity now and life sciences and robotics in coming years. We size them at $17bn, $7.5bn and $2.5bn in FY30E. We assume half of that is already inside enterprise customers’ spend, so we add only $8.5bn, $3.8bn and $1.3bn. This is deliberately small: cyber is under 3% of a ~$322bn security market by 2029 (Gartner).
From revenue to profit. The largest cost is compute, the chips and data centers that run the models. We set it at 50% of revenue in FY30E, the top of management’s 45-50% range. With the other costs, the adjusted operating margin rises from 12.6% in FY26E to 29.0% in FY30E, below management’s long-term target of more than 35%. That gives $152bn of adjusted EBITDA in FY30E and $207bn of cumulative free cash flow over FY27-30E.
From profit to a share price. We value the company two ways:
- Exit multiple. Assume an investor sells at the end of FY29E at 15x the next year’s (FY30E) EBITDA, plus net cash. In the Base that is $136 a share. Discounted back at a 12% annual return, the return we require, $136 is worth $96 today. This is the most you can pay and still earn 12%.
- DCF. Discount every year’s cash flow, counting stock compensation as a cost and allowing a 10% chance the business fails: $101 a share.
Both methods agree within $5. Below operating income, the model works the same way for every case in this post: D&A, capex, tax, stock compensation, working capital, the exit and the DCF.
Step 4: how our forecast compares with four outside views
We ran four published forecasts through the same model. Their revenue and operating margins come from the source, and everything below operating income is ours. That way the values differ only because the forecasts differ.
- Management. Anthropic gives no revenue forecast, so this uses the revenue of Goldman, the lead-left bank (via the FT), with management’s margin targets.
- Jon Ma (Artemis), Damodaran and SemiAnalysis (via Jon Ma’s September model): revenue and margins as posted on X.
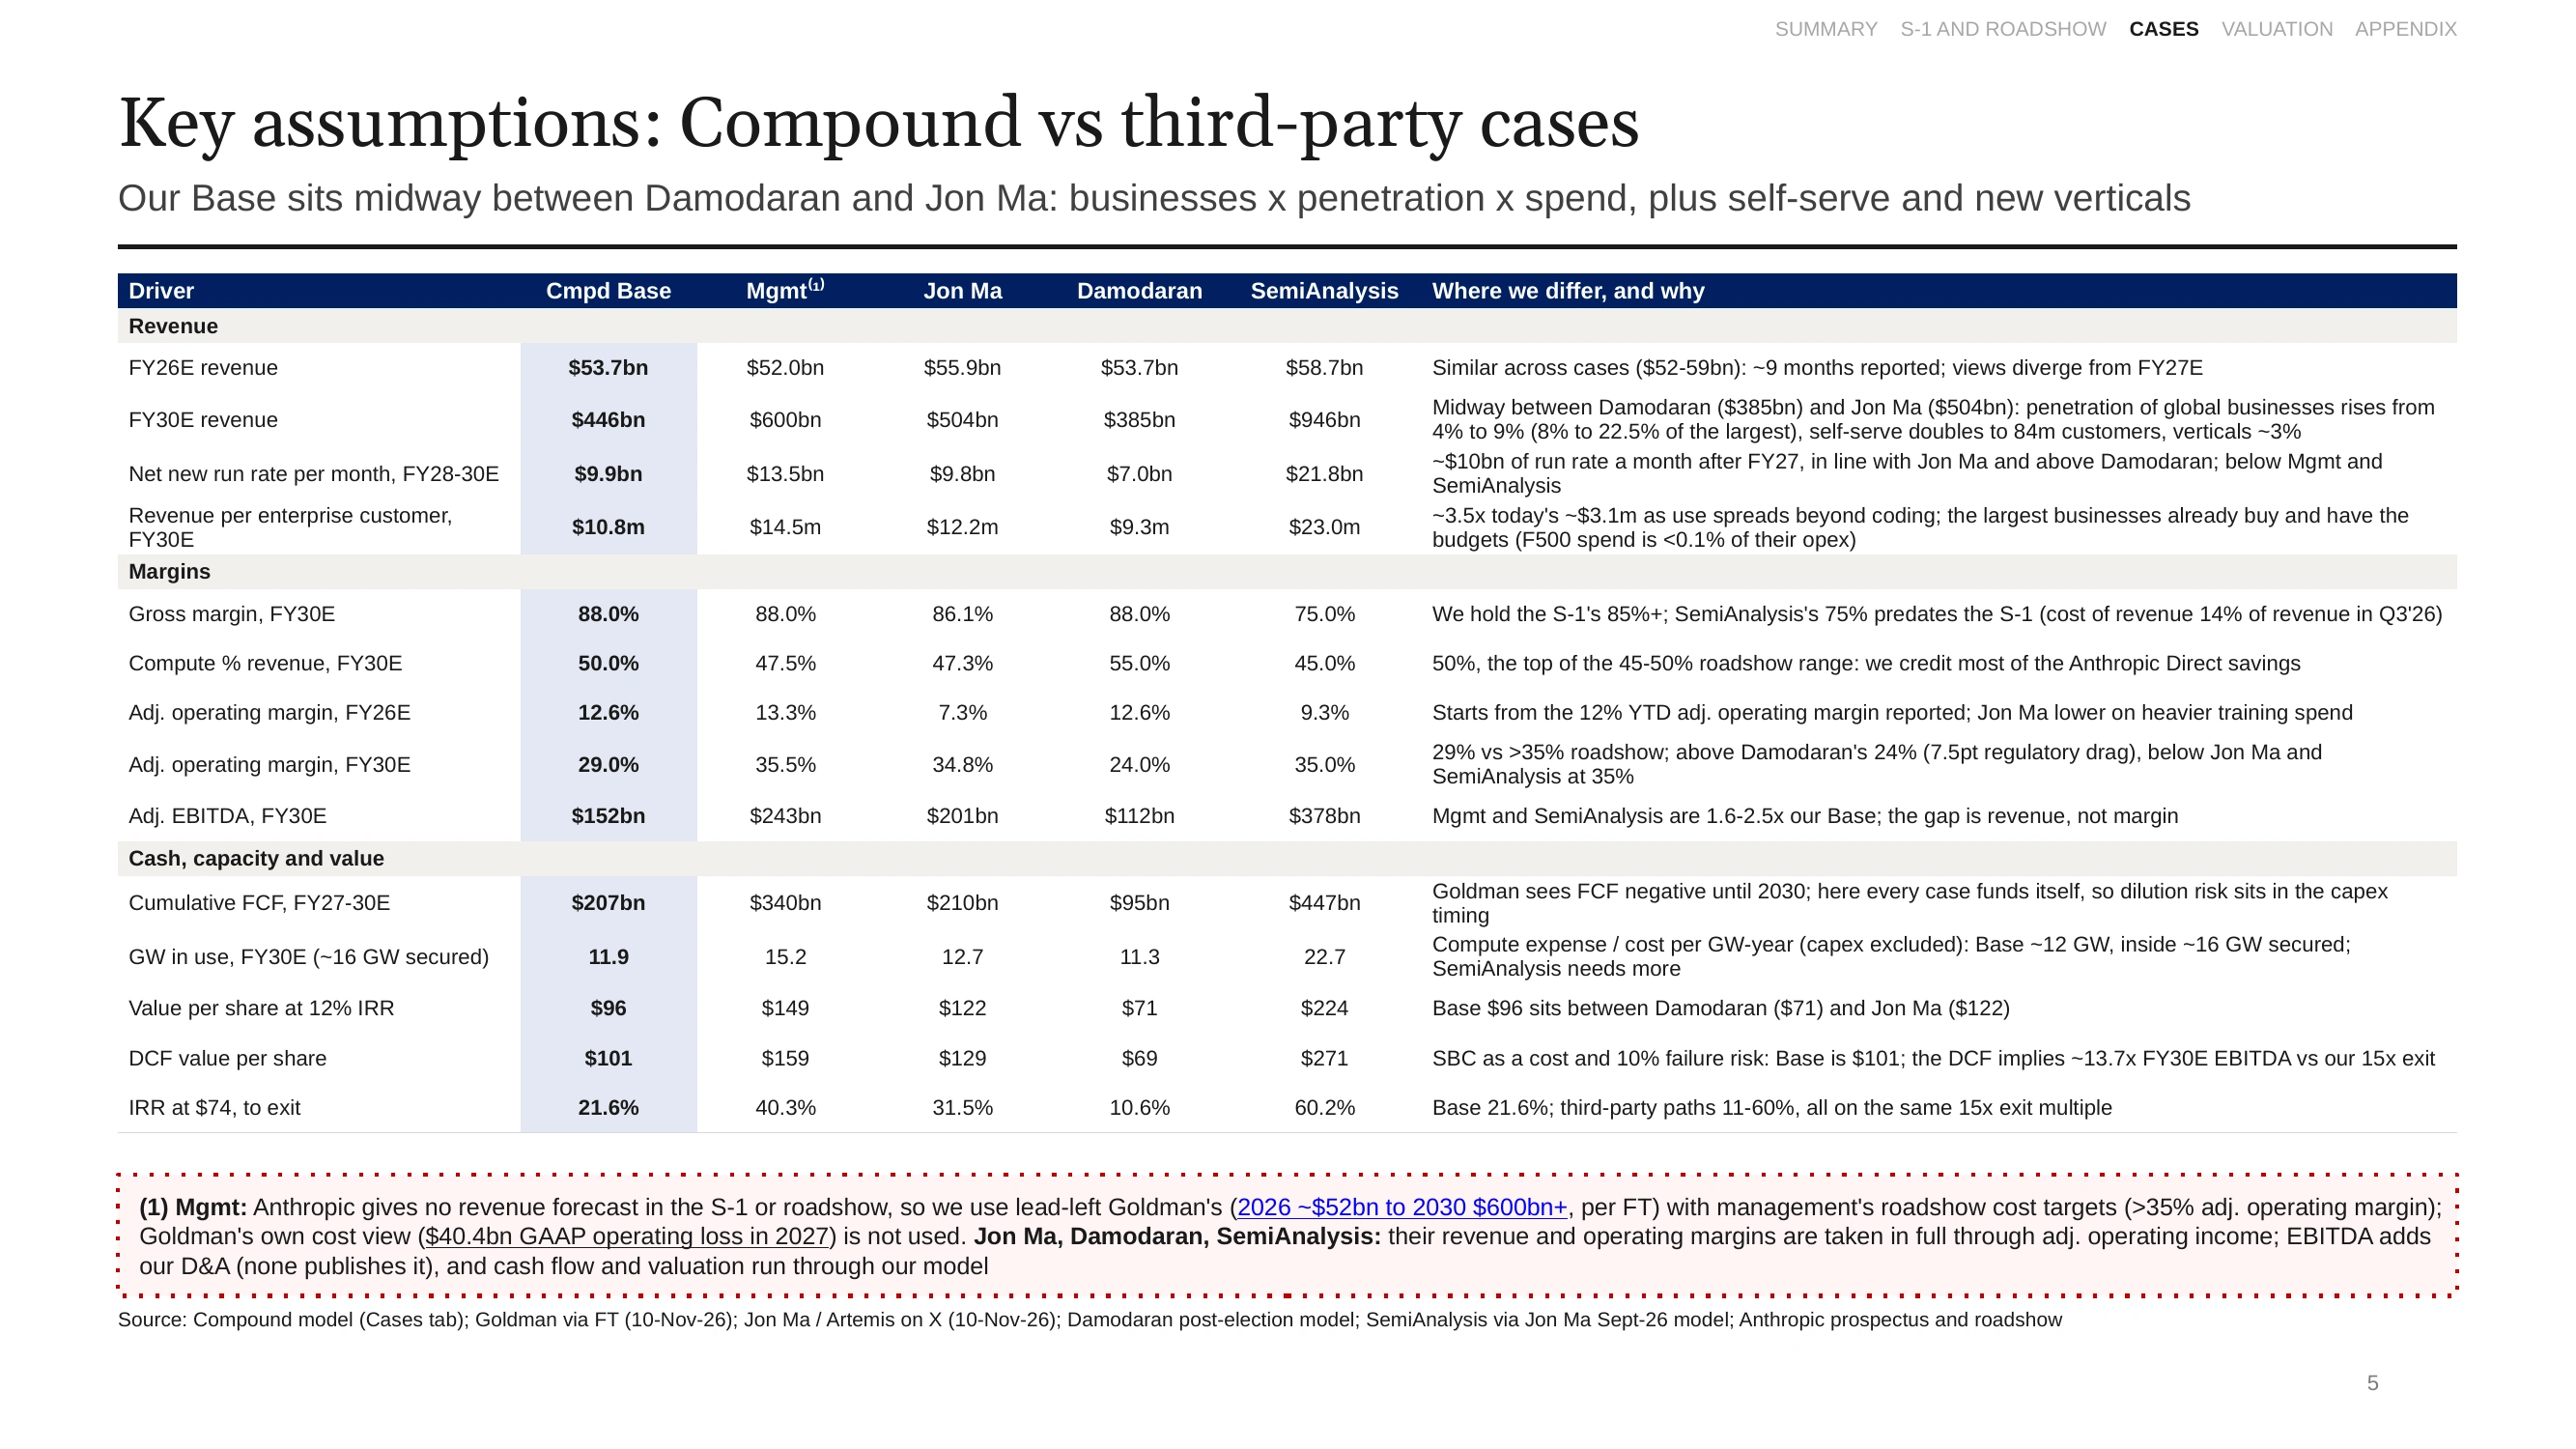
Key assumptions by case: every view agrees on FY26E ($52-59bn); they split from FY27E.
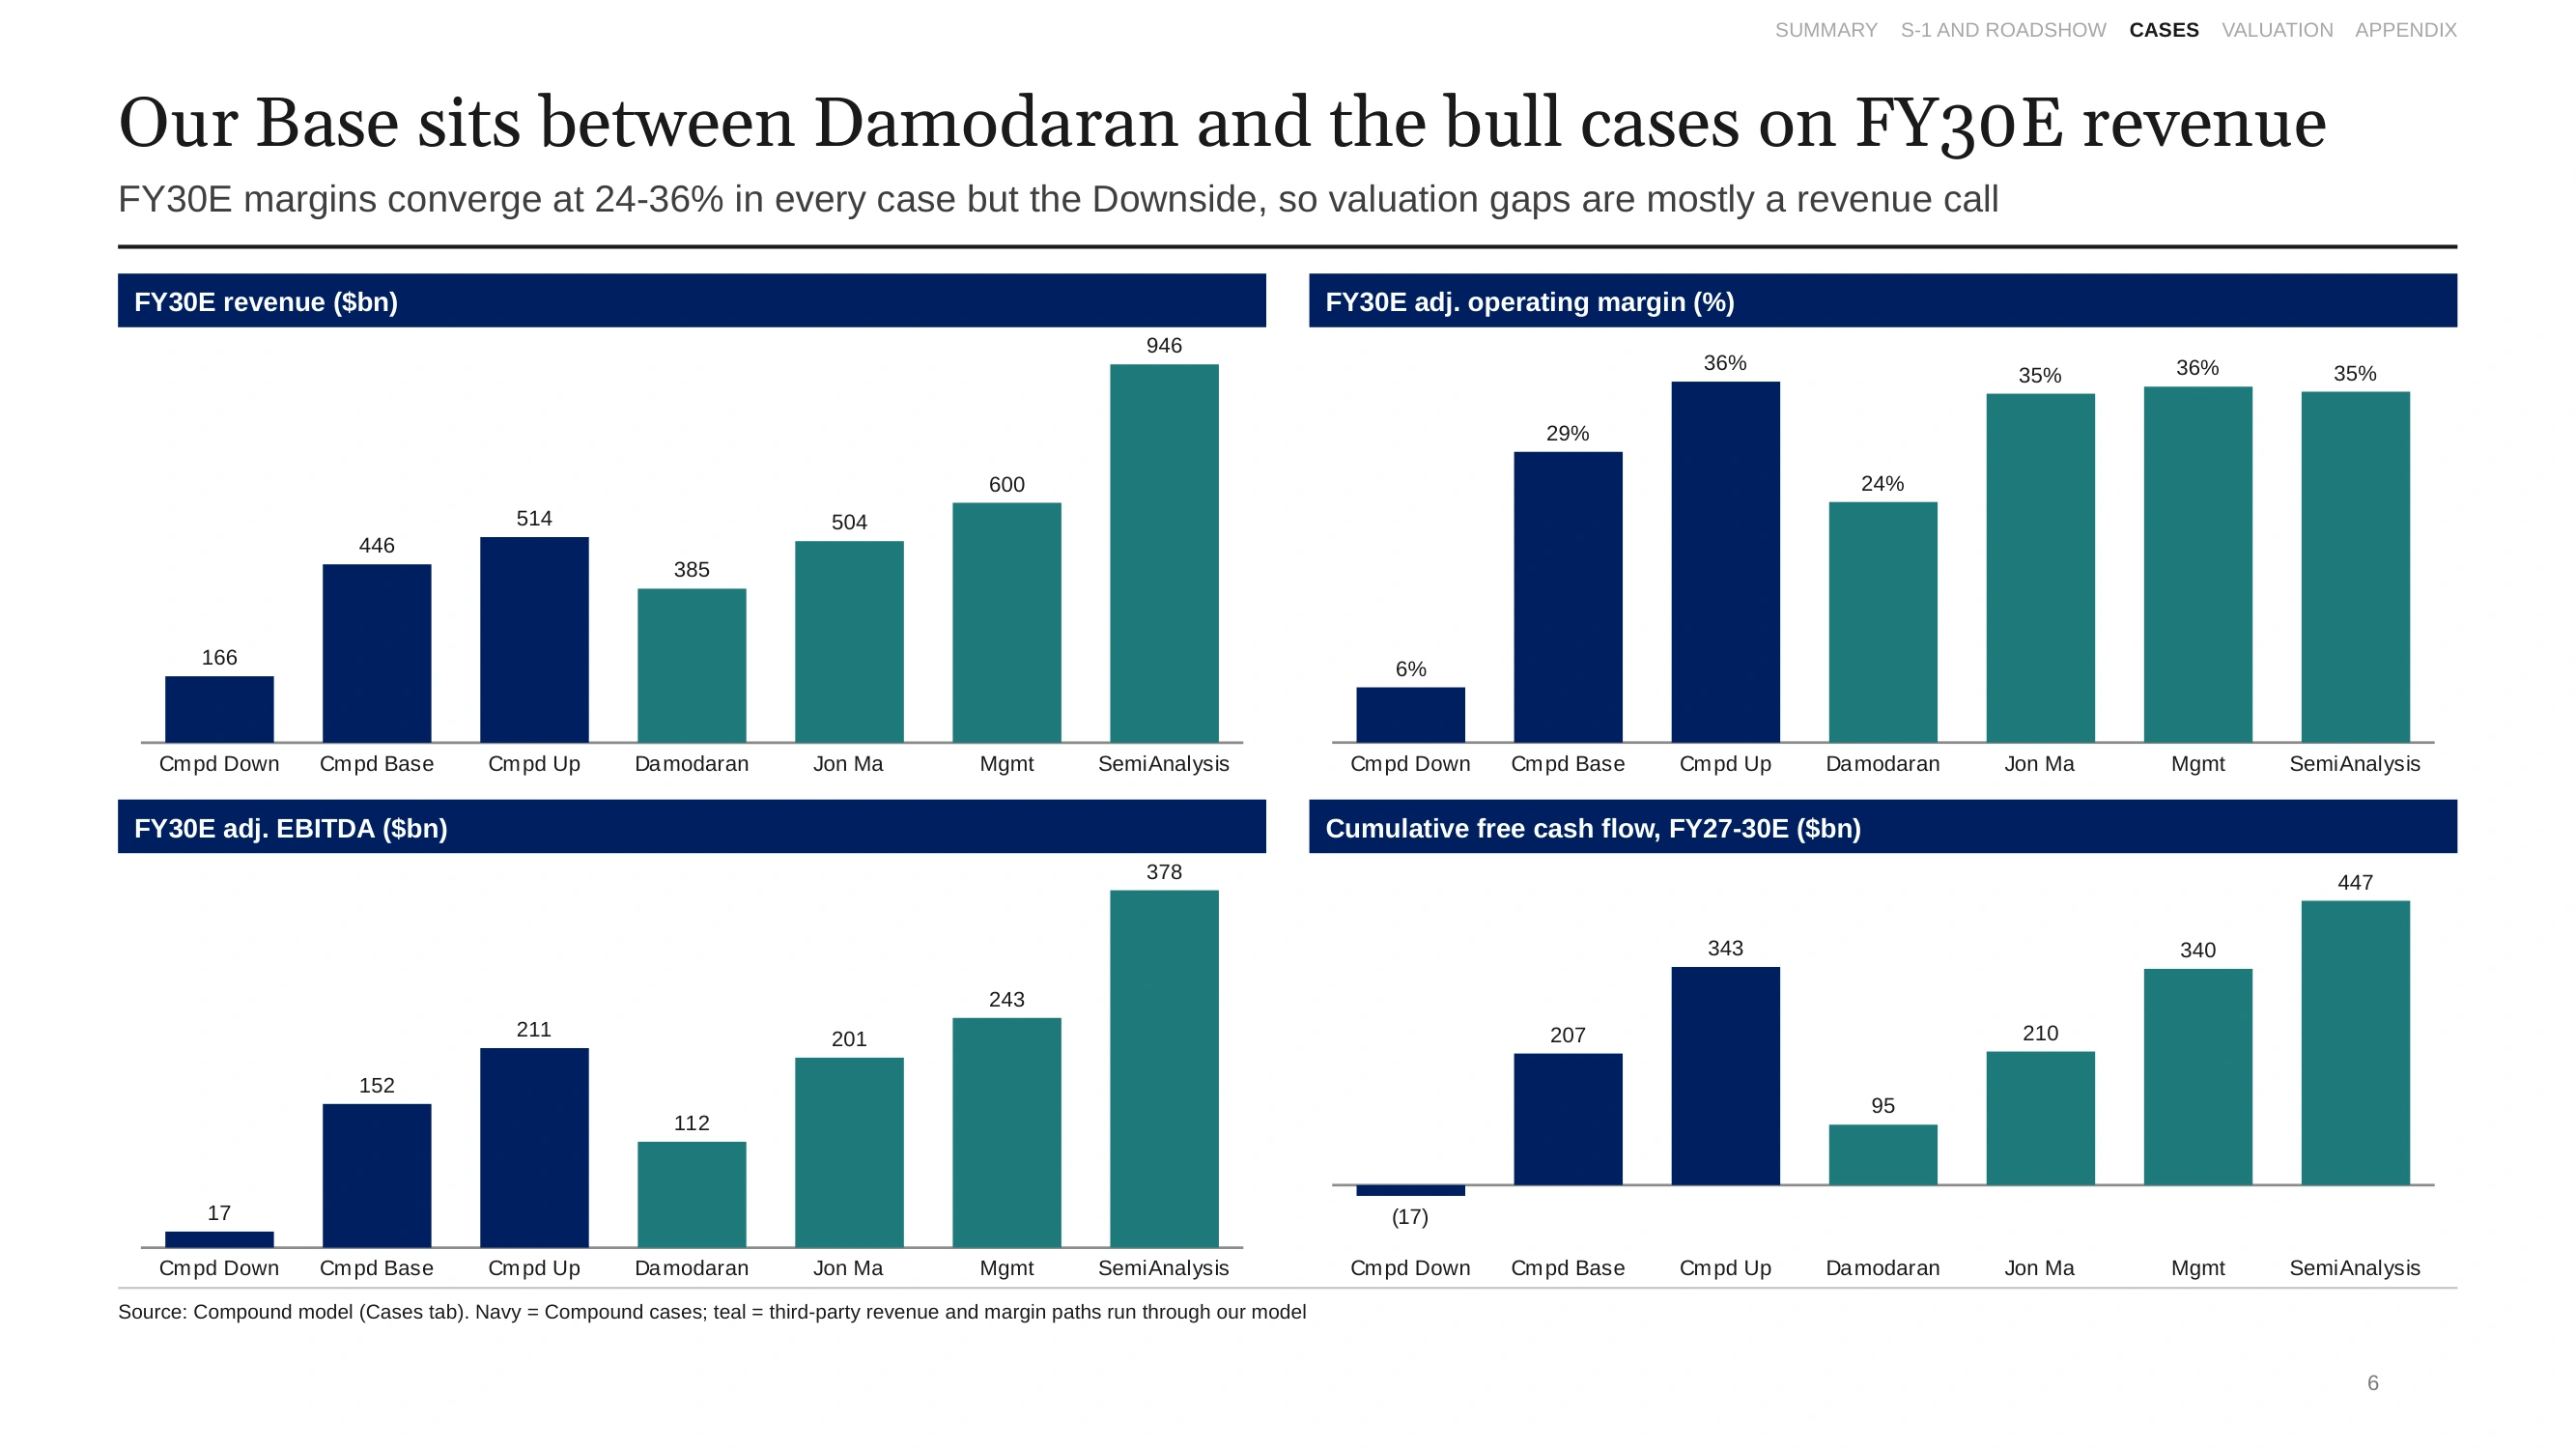
FY30E revenue varies 2.5x across the outside views; margins barely move.
The two numbers behind the revenue gap:
| Damodaran | Compound Base | Jon Ma | Management | SemiAnalysis | |
|---|---|---|---|---|---|
| Run rate added per month, FY28-30E | $7.0bn | $9.9bn | $9.8bn | $13.5bn | $21.8bn |
| Spend per enterprise customer, FY30E | $9.3m | $10.8m | $12.2m | $14.5m | $23.0m |
Source: Compound model, Cases tab; Goldman via FT; Jon Ma / Artemis, Damodaran and SemiAnalysis (via Jon Ma) on X; Anthropic prospectus and roadshow.
Our Base sits between Damodaran and Jon Ma. Here is where we differ, and why:
- Revenue is the real disagreement. Outside our Downside, every FY30E margin lands between 24% and 36%. The gap in value comes from revenue, and the clearest way to see it is run rate added per month after FY27. We need about $10bn a month, in line with Jon Ma. Damodaran needs $7.0bn, the bank $13.5bn and SemiAnalysis $21.8bn.
- Against the bank and SemiAnalysis: we assume less spend per customer. At $10.8m, ours is already 3.5x today’s level after a 40% price cut per task. The bull cases need $14.5-23.0m.
- Against Damodaran: we assume a higher margin. He takes 7.5 points off for regulation and lands at 24%. We hold the S-1’s gross margin of 85%+ and reach 29%.
- Against SemiAnalysis on cost: its 75% gross margin predates the S-1, where cost of revenue was 14% of revenue in Q3’26.
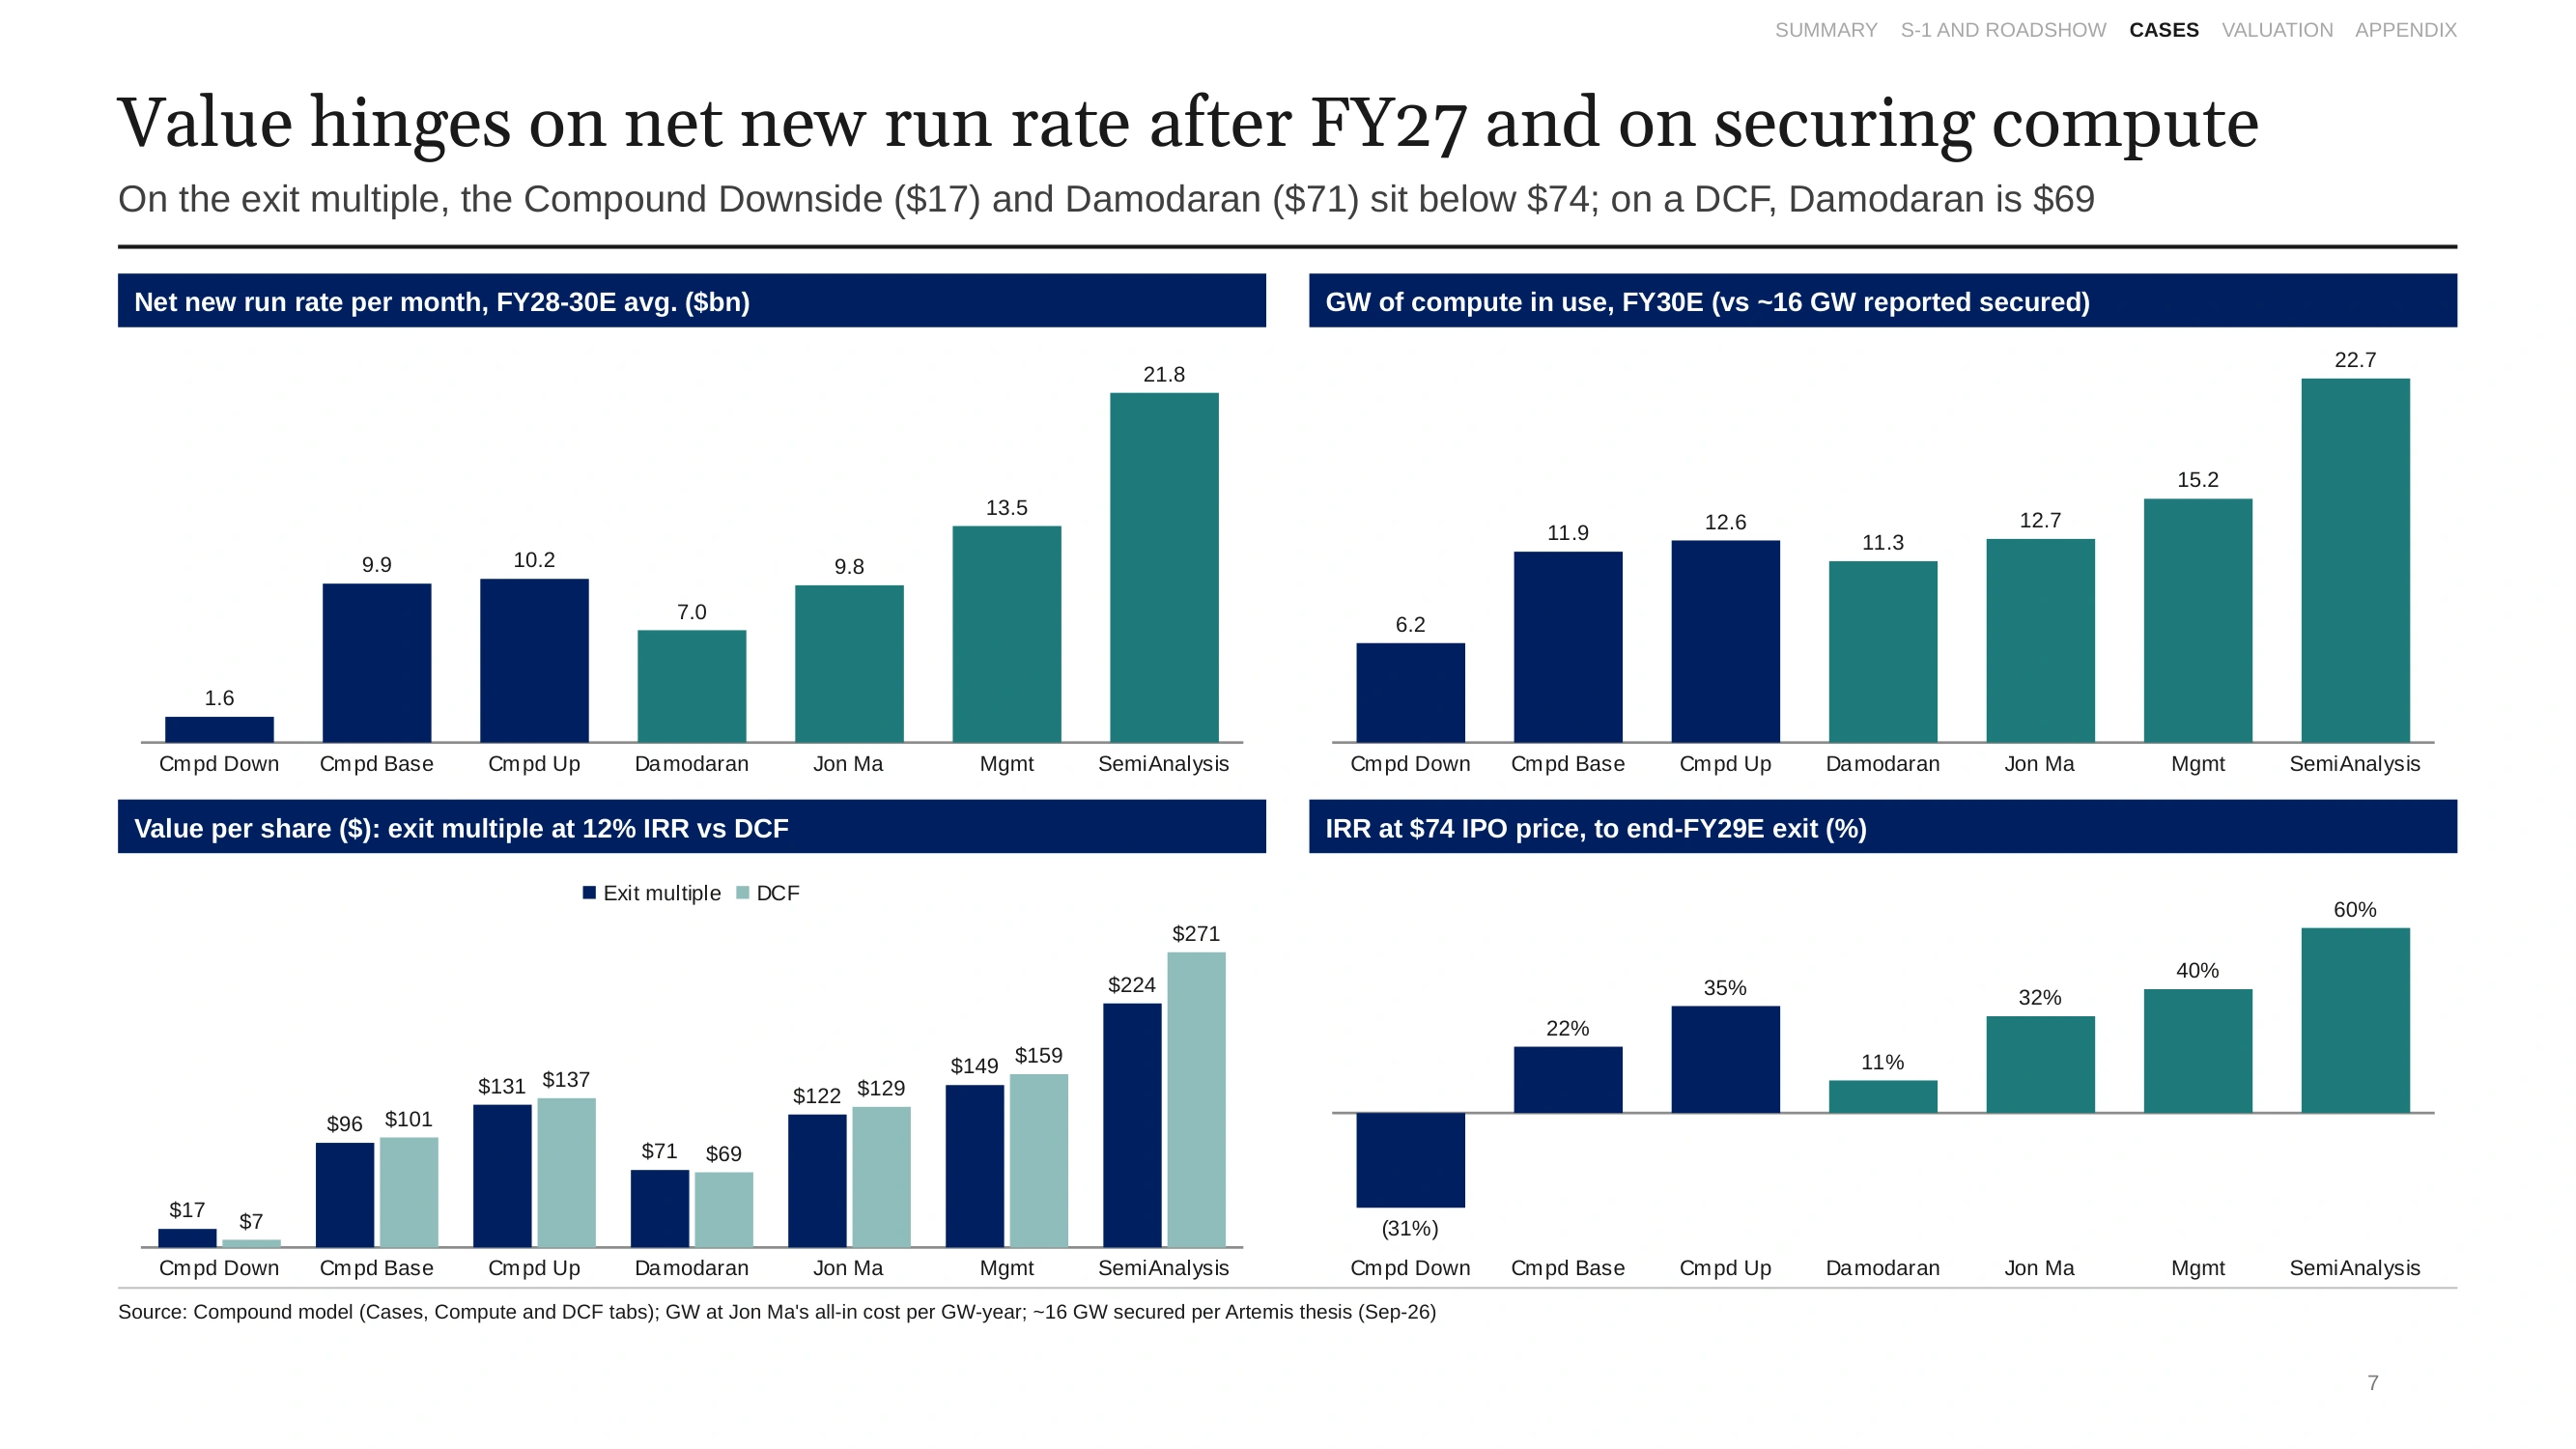
The two tests: run rate added per month, and whether there is enough compute to serve it.
Is there enough compute? We convert each case’s compute spend into gigawatts in use. The Base needs about 12 GW in FY30E, inside the ~16 GW reported secured. SemiAnalysis needs 22.7 GW, more than has been secured.
Step 5: what to pay, depending on which forecast you believe
The analysis-at-various-prices (AVP) table holds the forecasts fixed and changes the IPO price. A higher price does not change what the business earns; it only lowers your return.
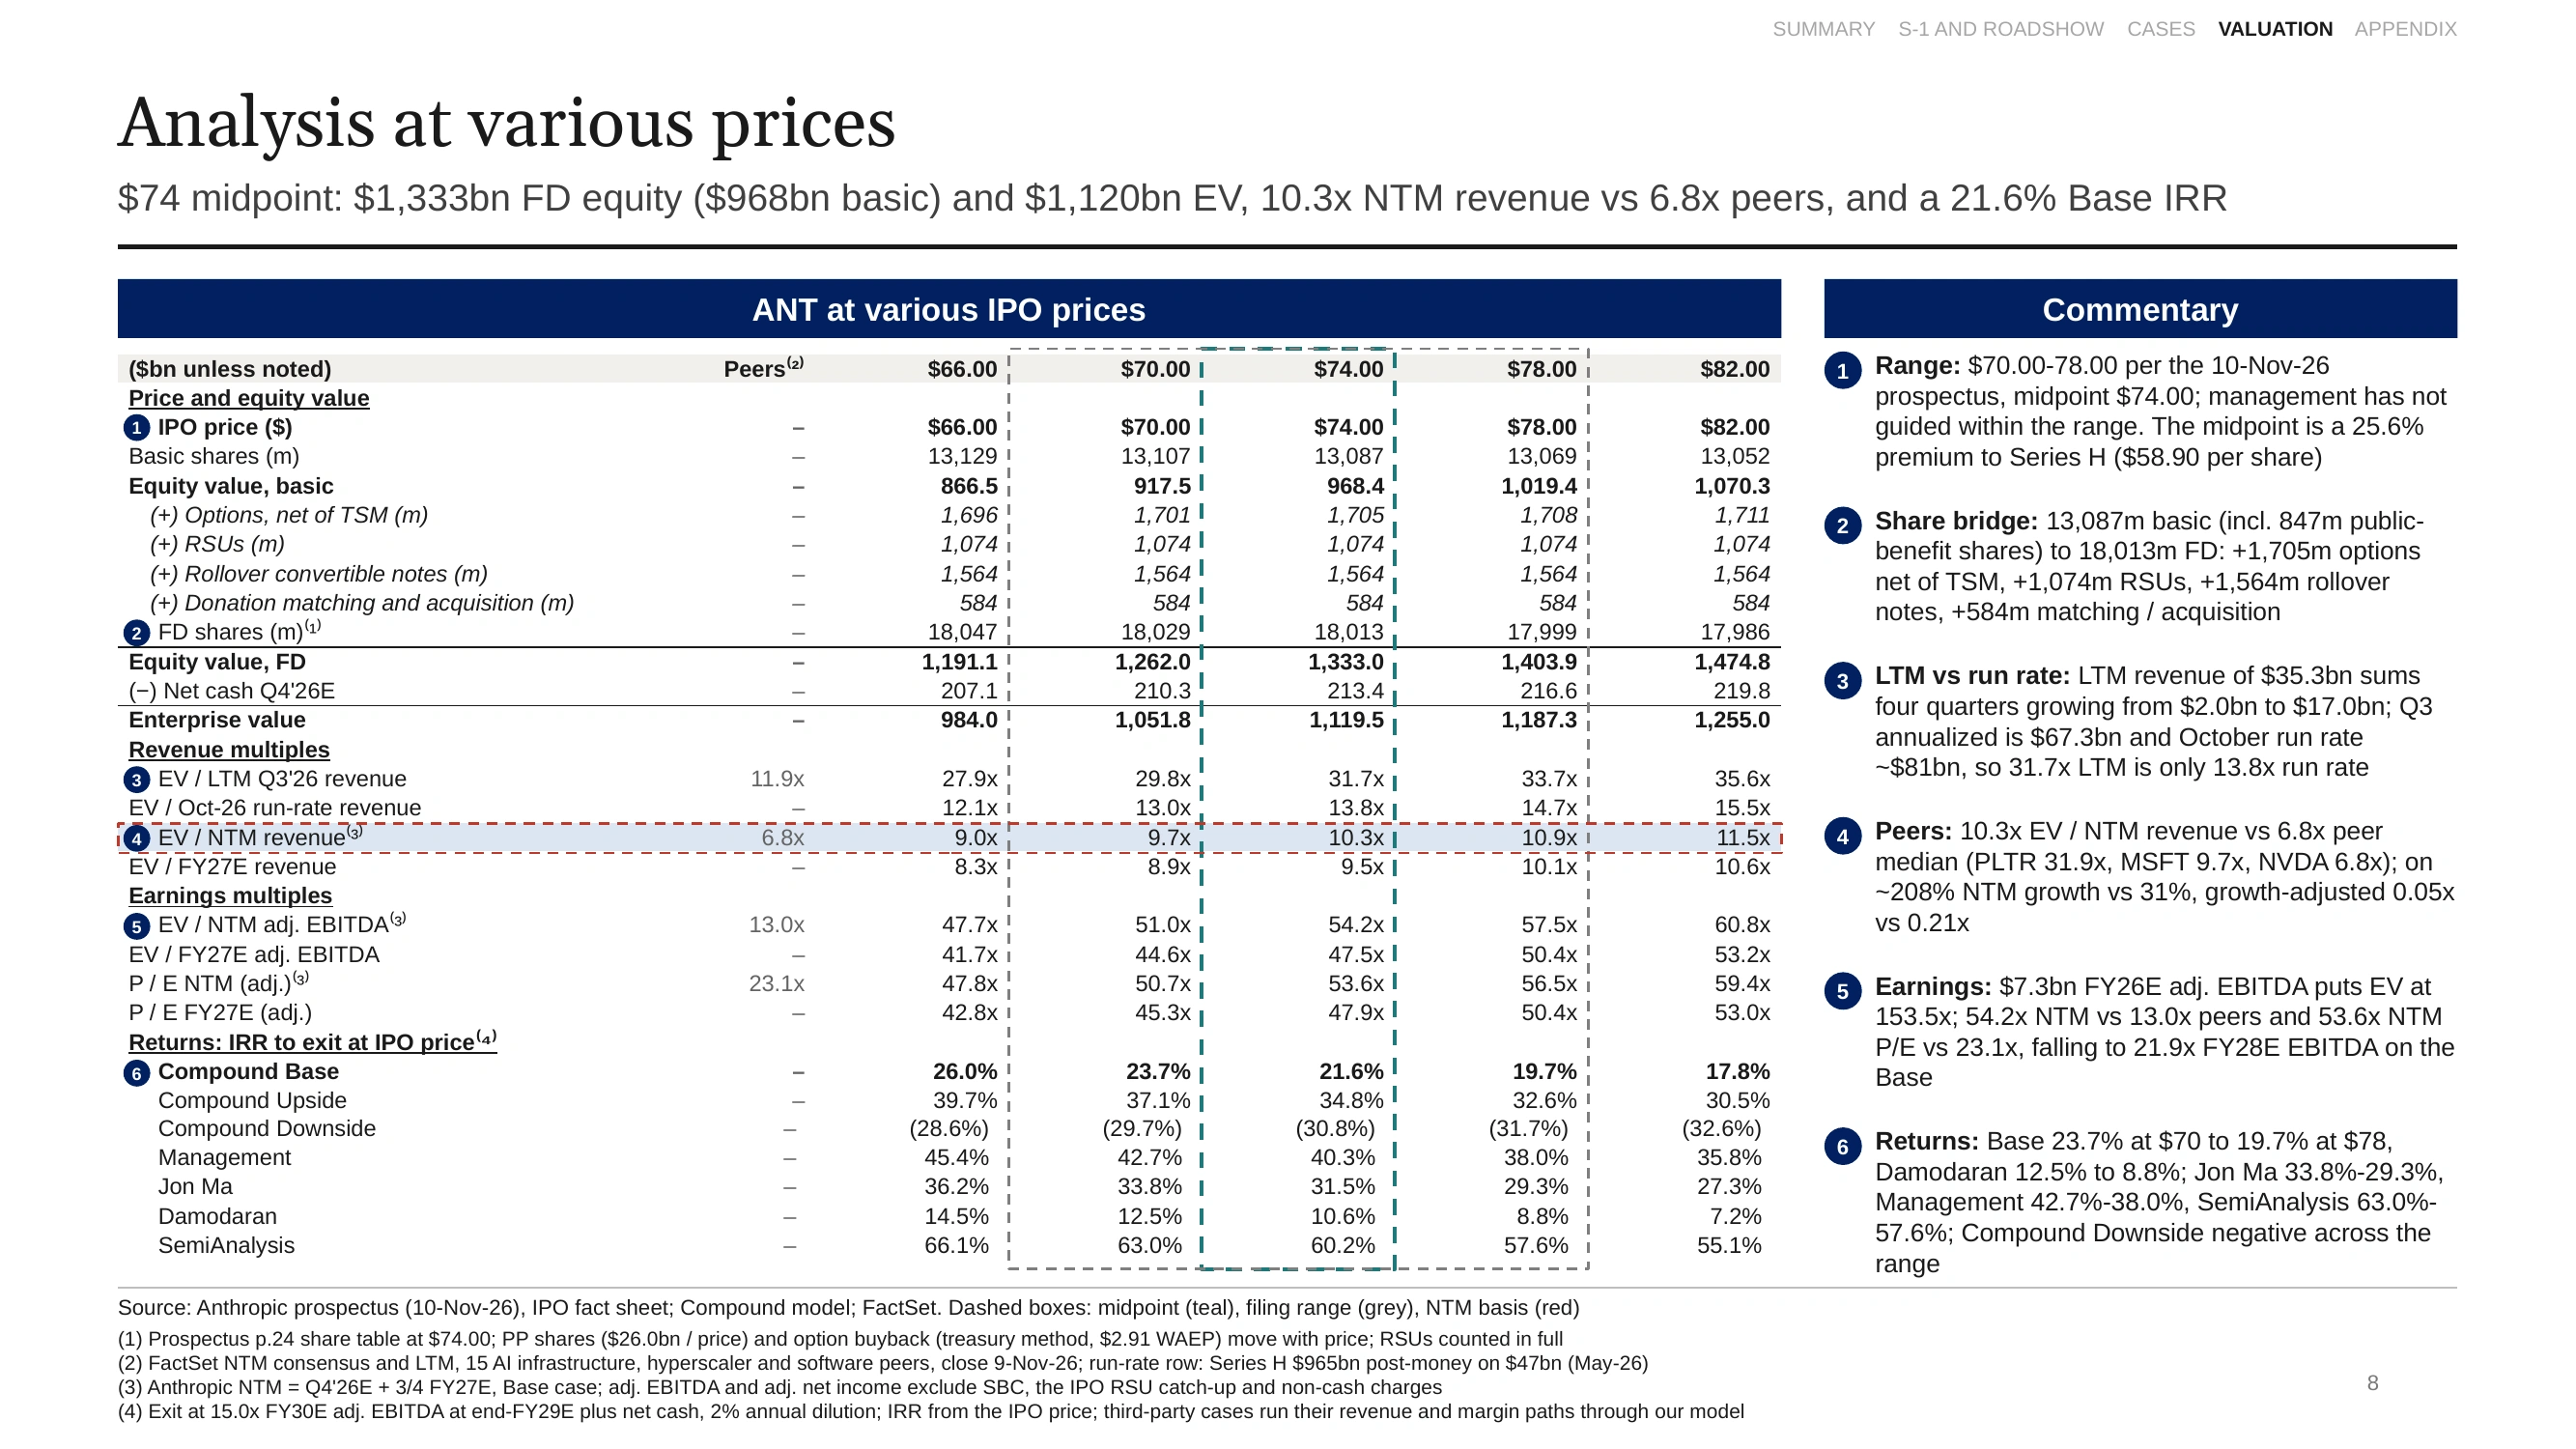
Analysis at various prices: valuation, multiples and the annual return under each forecast.
Read it by picking a row:
| If you believe… | Most you can pay for a 12% return | IRR at $70 | IRR at $74 | IRR at $78 | At the range |
|---|---|---|---|---|---|
| Compound Downside | $17 | (29.7%) | (30.8%) | (31.7%) | Don’t buy |
| Damodaran | $71 | 12.5% | 10.6% | 8.8% | Buy only at $70 |
| Compound Base | $96 | 23.7% | 21.6% | 19.7% | Buy anywhere in the range |
| Jon Ma | $122 | 33.8% | 31.5% | 29.3% | Buy |
| Compound Upside | $131 | 37.1% | 34.8% | 32.6% | Buy |
| Management (Goldman revenue) | $149 | 42.7% | 40.3% | 38.0% | Buy |
| SemiAnalysis | $224 | 63.0% | 60.2% | 57.6% | Buy |
Source: Compound model, Valuation and Cases tabs. IRR to an end-FY29E exit at 15x FY30E adj. EBITDA plus net cash, with 2% annual dilution.
Within the range, each $4 on the price costs about two points of return in the Base. A higher price also slightly lowers the share count, because the fixed $26.0bn placement buys fewer shares. RSUs, the convertible notes, the forecasts and the 15x exit stay fixed.
Step 6: the football field
The football field puts every view on one chart against the IPO range. Each bar runs from the DCF value to the exit-multiple value, so a short bar means the two methods agree.
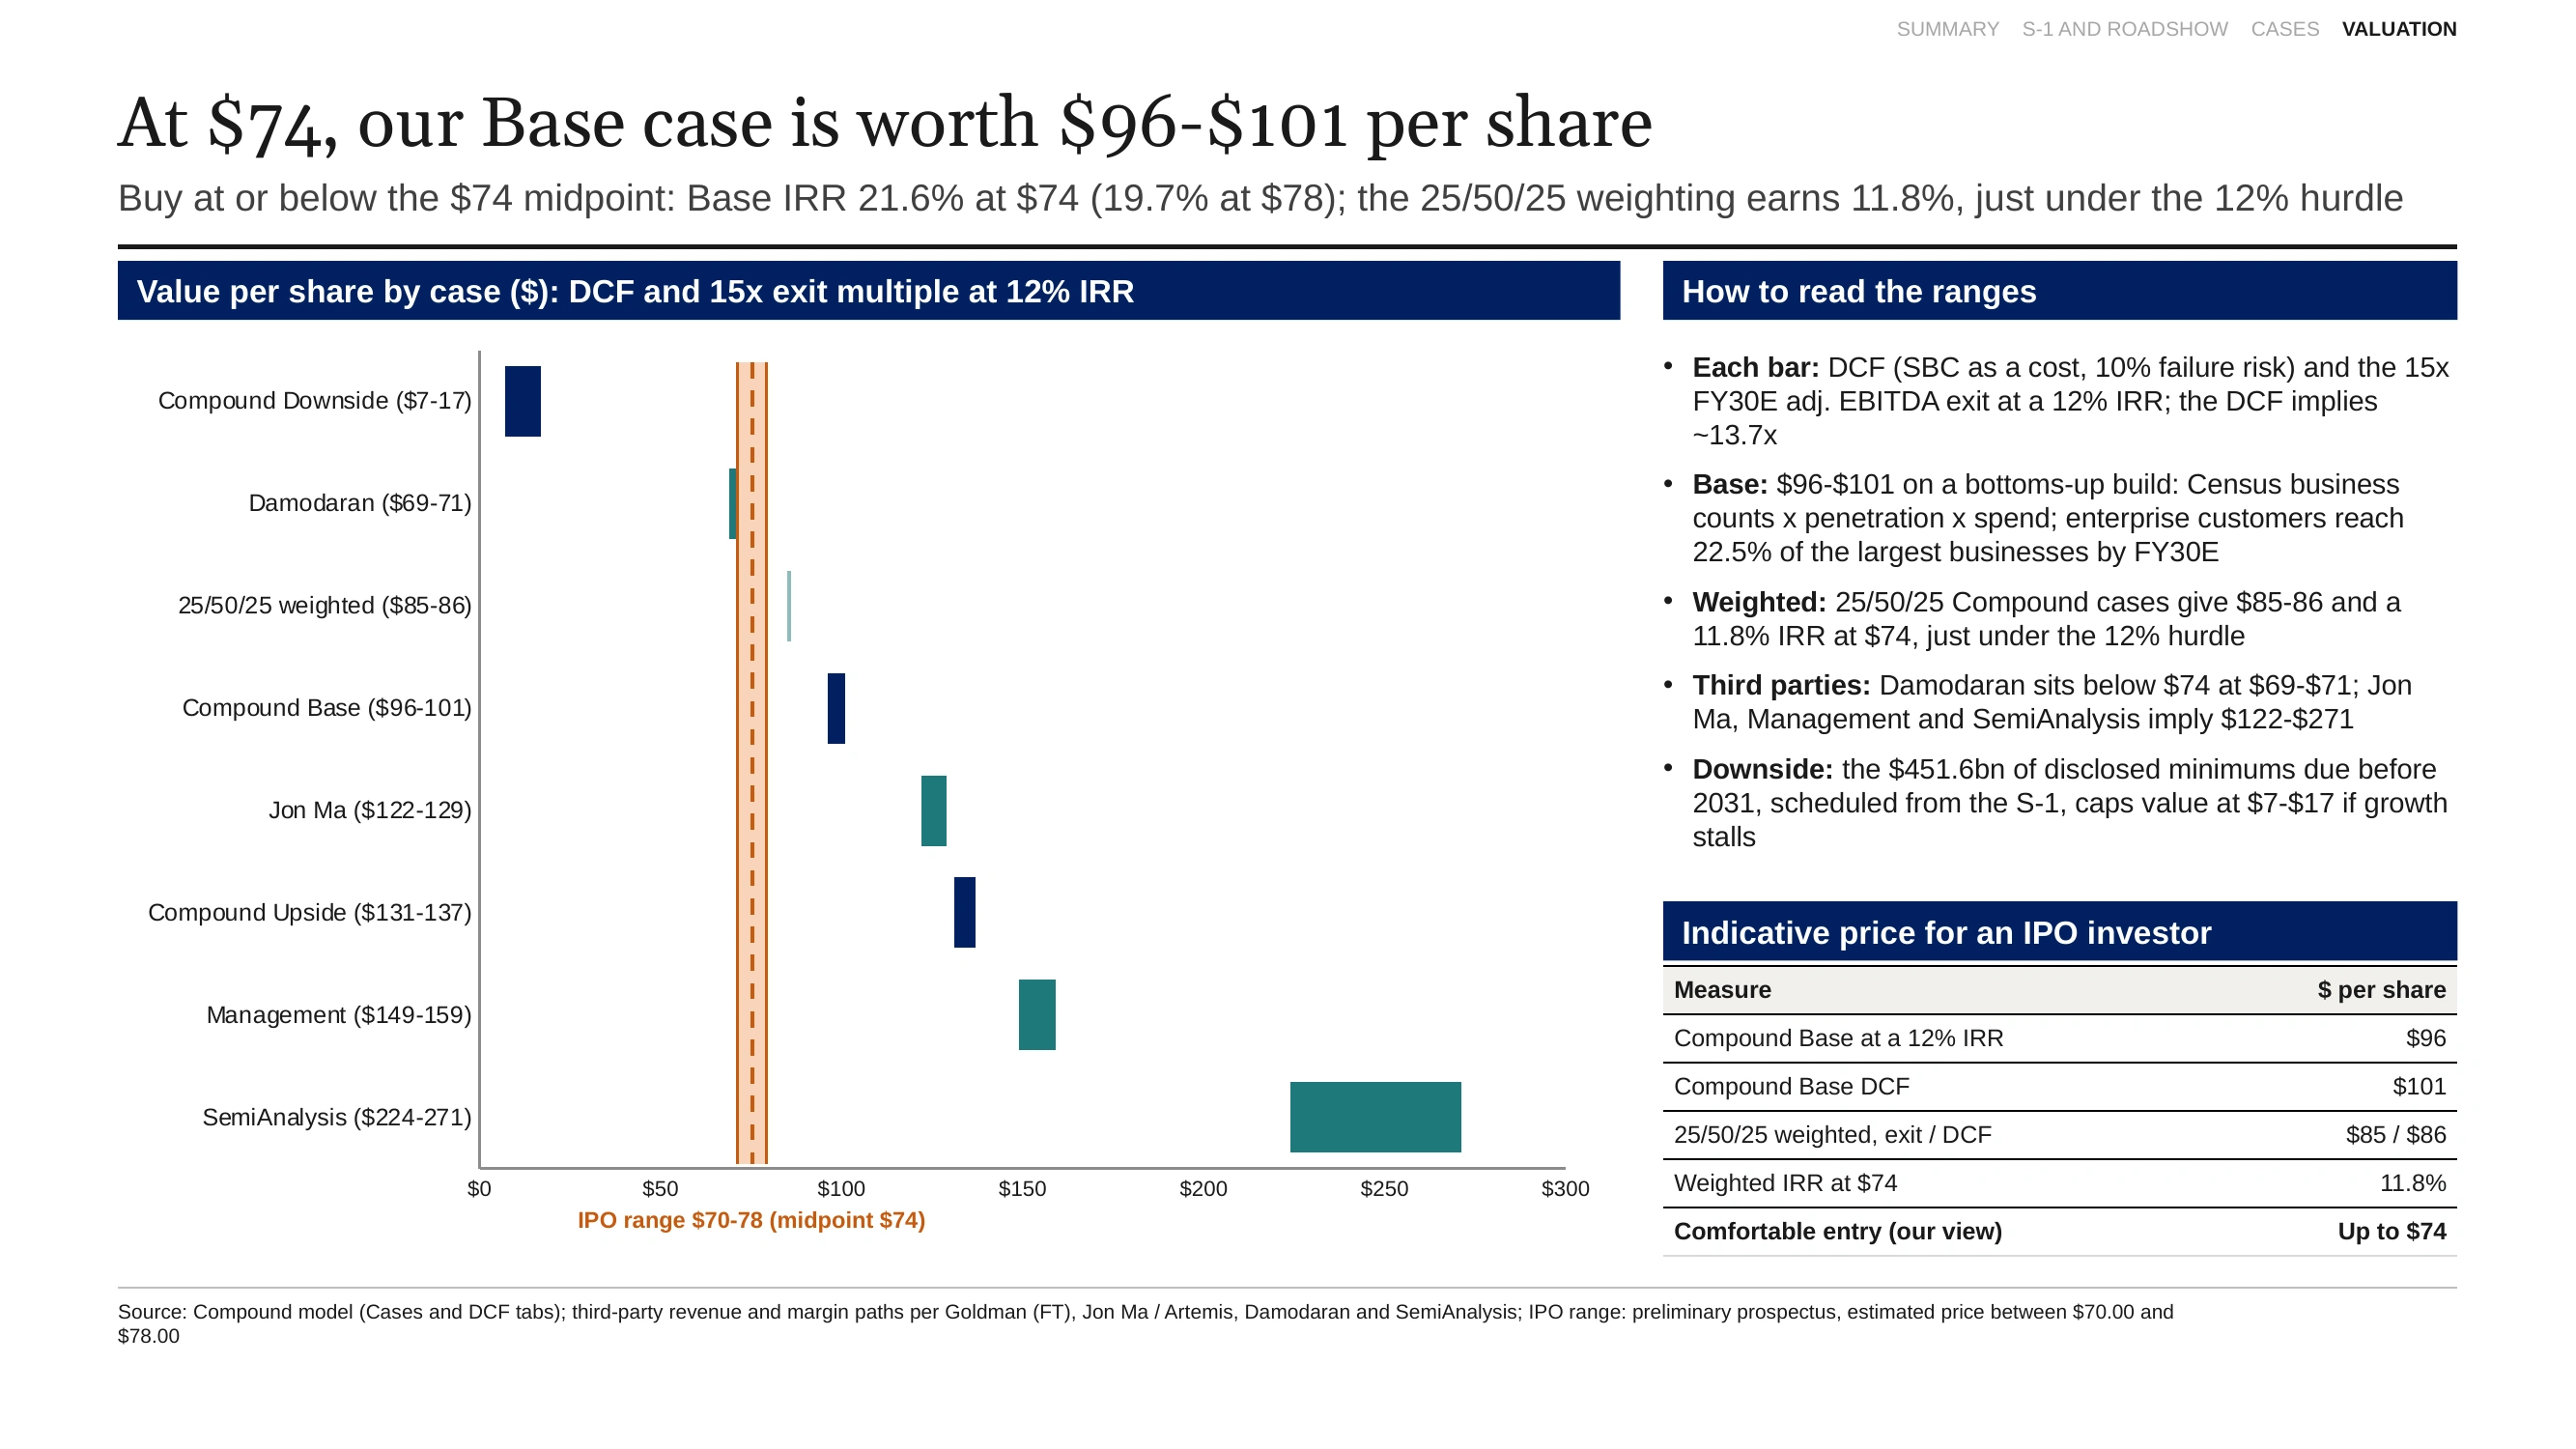
Value per share by case against the $70-78 IPO range (shaded).
- Below the range: our Downside ($7-17) and Damodaran ($69-71).
- Just above it: the probability-weighted value of our three cases ($85-86).
- Clearly above it: our Base ($96-101), Jon Ma ($122-129), our Upside ($131-137), Management ($149-159) and SemiAnalysis ($224-271).
Six of the eight views sit above $78. For $74 to be too high, you have to believe growth fades at Damodaran’s pace or stalls entirely.
Step 7: our three cases, and why the weighted return misses 12%
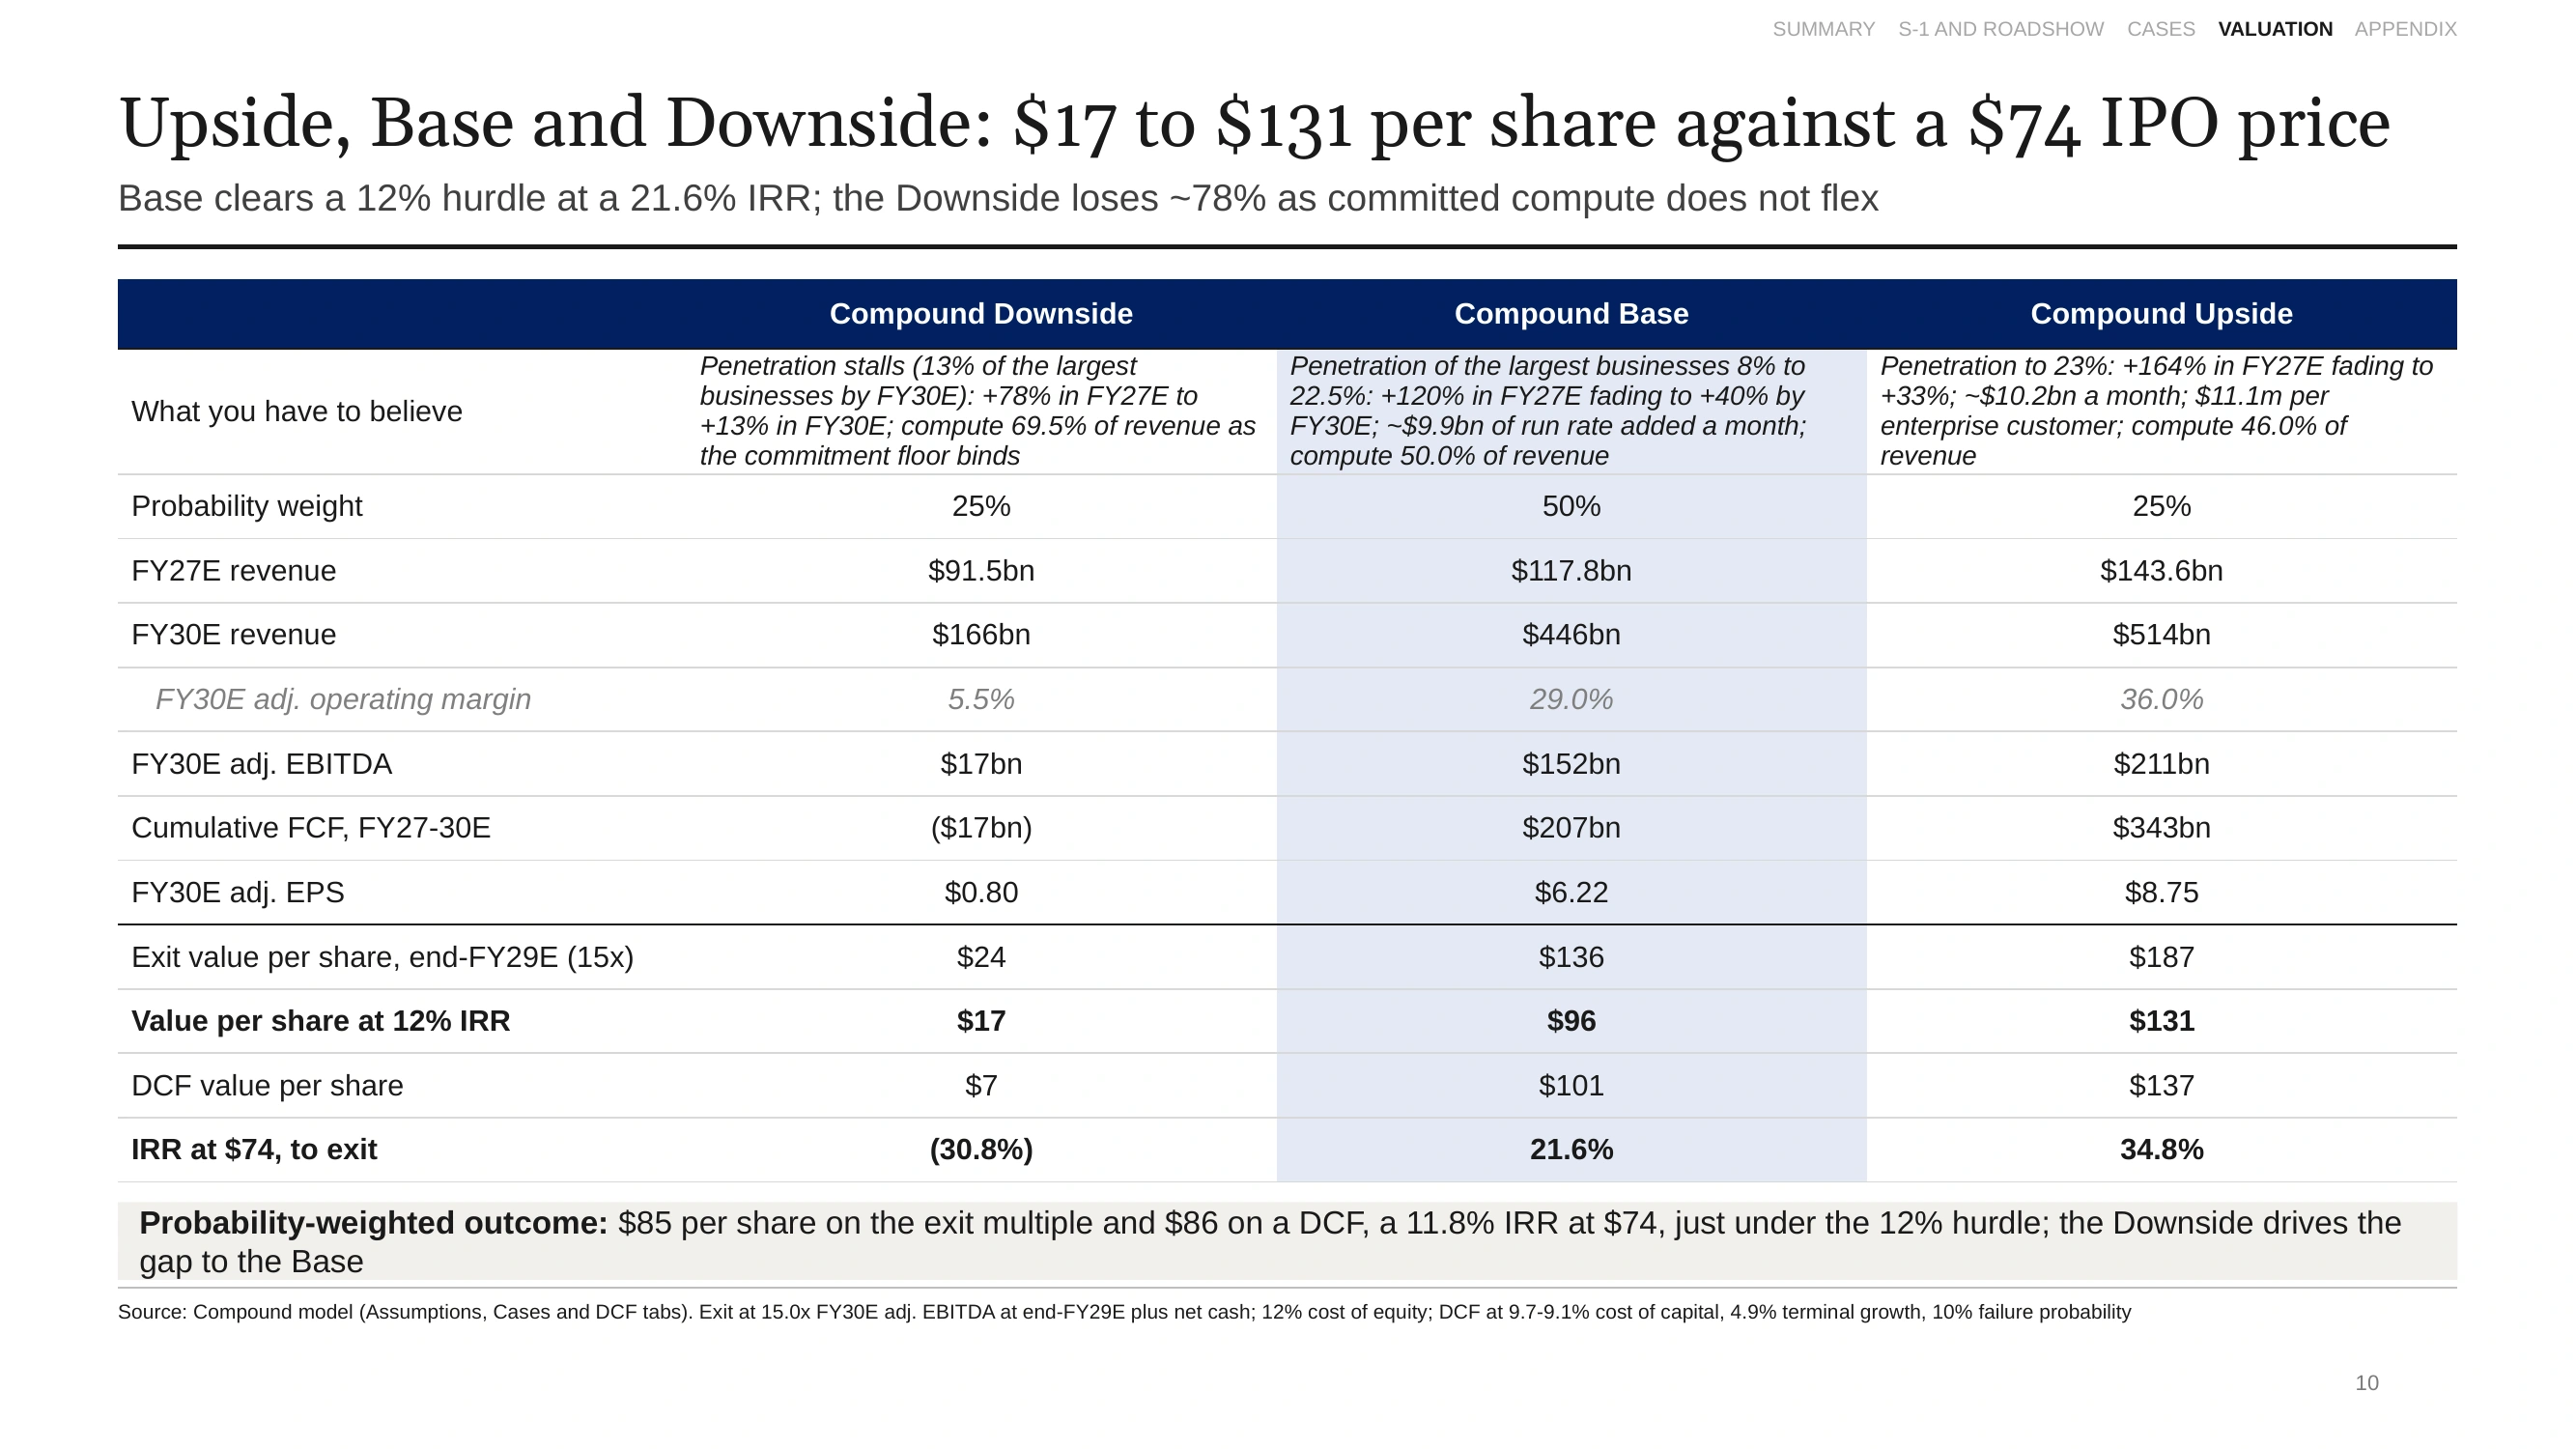
Our three cases: what you have to believe, and what each is worth.
- Base (50% weight). Penetration of the largest businesses rises from 8% to 22.5%. Growth is 120% in FY27E and fades to 40% by FY30E. Compute is 50% of revenue. Worth $96, a 21.6% IRR at $74.
- Upside (25%). Penetration reaches 23%, with $11.1m per enterprise customer and compute at 46%. Worth $131, a 34.8% IRR.
- Downside (25%). Penetration stalls at 13%, and growth falls from 78% in FY27E to 13% in FY30E. The compute commitments still have to be paid, so compute rises to 69.5% of revenue and the margin falls to 5.5%. Worth $17, a loss of about 78% at $74.
Weighted 25/50/25, the value is $85 a share, above $74. The weighted IRR is 11.8%, just under the 12% hurdle. The two disagree because returns don’t average the way values do: a quarter weight on a 30.8% annual loss pulls the average return down more than it pulls down the average value.
The Downside rests on one assumption: that the $451.6bn of commitments due before 2031 must be paid as scheduled. The S-1 gives the total but not how much can be deferred or resized. If some of it can flex, the Downside rises and the weighted return clears 12%. Until the commitments reconcile to the S-1 lease accounting, the call to buy at or below $74 is provisional.
What to watch after the IPO
| What to track | Supports the Base | Revisit the thesis |
|---|---|---|
| Run rate added per month | About $10bn a month after FY27 | Adds near Damodaran’s $7.0bn |
| $100K+ customers and spend | Counts rising toward 33,403 at $10.8m each | Penetration of the largest businesses stalling near 13% |
| Pricing | Price cuts that stay margin neutral | Another cut without matching volume |
| Compute cost | At or below 50% of revenue | Moving toward 69.5% |
| Compute commitments | Commitments that can be deferred or resized | Confirmed fixed, with $70.7bn due in the next 12 months |
Source: Compound model, Cases and Compute tabs; Anthropic preliminary prospectus and roadshow (10 November 2026).
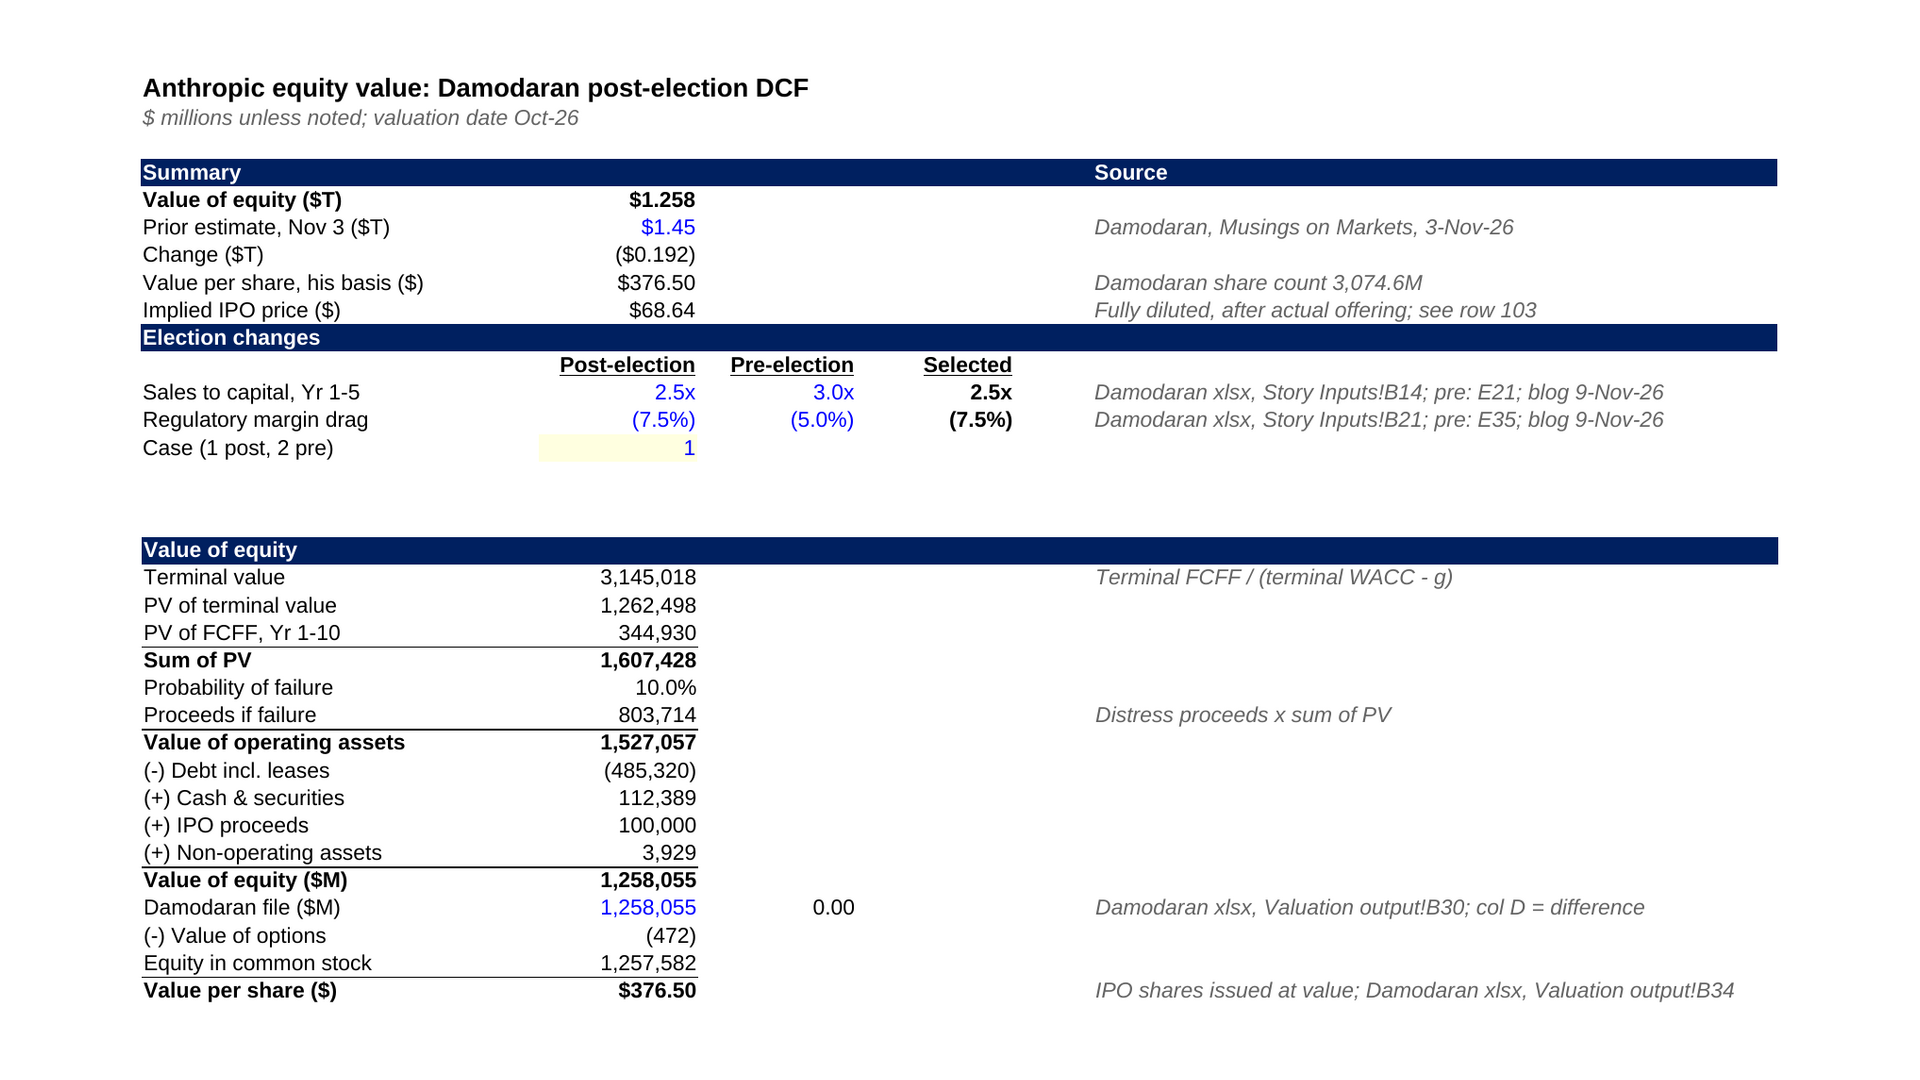
The first public quarterly report tests the run-rate line, and its commitments footnote tests the Downside. For a top-down view of the same question, Damodaran’s own DCF, rebuilt in Excel in a separate post, lands at $68.64 a share.
Anthropic IPO valuation deck
12 slides: S-1 scorecard, revenue build, third-party comparison, analysis at various prices, football field and the three cases.
Download · Free Anthropic IPO valuation deck (PDF)
The same 12 slides as a PDF, ready to read or share.
Download · Free Anthropic IPO valuation model
Nine tabs from Assumptions to Precedents: the Census-based revenue build, the 18,013m fully diluted share bridge and every case on one basis.
Download · FreeMethodology and limits
- Exit. 15.0x FY30E adjusted EBITDA at end-FY29E plus net cash, 2% annual dilution and a 12% required return. The DCF implies about 13.7x.
- Weights. 25/50/25 is a judgment, and the weighted IRR sits 0.2 points under the hurdle.
- Non-US proxy. The 1.84x ratio comes from counts of businesses with 250+ staff and is applied to those with 100+.
- Size bands. Mapping employee bands to spend tiers is an assumption.
- Vertical overlap. The half overlap with enterprise spend is assumed.
- Commitments. The $900.9bn committed, and the $451.6bn due before end-2030, are not yet reconciled to the S-1 lease liabilities.