Anthropic Valuation: Damodaran's $1.25 Trillion DCF in Excel
Aswath Damodaran cut his Anthropic valuation to $1.25 trillion after the election. We forwarded his post to Compound and got his DCF back as a one-tab Excel model that matches his number exactly.
by Compound Team · November 10, 2026 · 9 min read
On 9 November Aswath Damodaran, who teaches valuation to MBA students at NYU Stern, cut his estimate of Anthropic’s equity value from $1.45 trillion to $1.25 trillion. His post, The AI Trade Deconstructed, gives the change in one paragraph: two inputs moved after the US election, and the value fell by about $200 billion.
We wanted to see the arithmetic, so we forwarded the post to our Compound agent by email with one line:
show in excel how aswath got to 1.25T price
Under five minutes later the agent replied with an Excel workbook. It rebuilds his DCF model on one tab with live formulas, ties each input to the cell it came from in his spreadsheet, and arrives at an equity value of $1,258,055 million. That is the figure in his own file, with a difference of 0.00. The workbook is at the end of this post.
What changed in Damodaran’s Anthropic valuation
Two inputs changed. The revenue path, the cost of capital and the failure risk did not.
| Input | Before the election | After the election |
|---|---|---|
| Sales to capital, years 1 to 5 | 3.0x | 2.5x |
| Regulatory drag on the target operating margin | 5.0% | 7.5% |
| Target operating margin | 27.5% | 25.0% |
| Revenue in year 10 | $1,004.5bn | $1,004.5bn |
| Value of equity | $1,450,951M | $1,258,055M |
Source: Damodaran, Musings on Markets, 3 and 9 November 2026, and his spreadsheet AnthropicIPOPostElection.xlsx; equity values from the rebuilt workbook.
His reasoning for each is short. A lower sales to capital ratio means Anthropic has to invest more for each dollar of new revenue, because compute capacity becomes harder and more expensive to add. A larger regulatory drag reflects the chance that the new Congress writes tighter rules for AI, which shows up as higher costs and a lower margin. He kept his view that Anthropic reaches about $1 trillion of revenue in ten years.
From a forwarded email to a working model
Damodaran links the spreadsheet behind his number. It has 18 tabs: the inputs, the valuation, and converters for R&D and leases, alongside cost of capital worksheets and industry data. Reading a valuation across that many tabs is slow, and it is hard to see which few cells do the work.
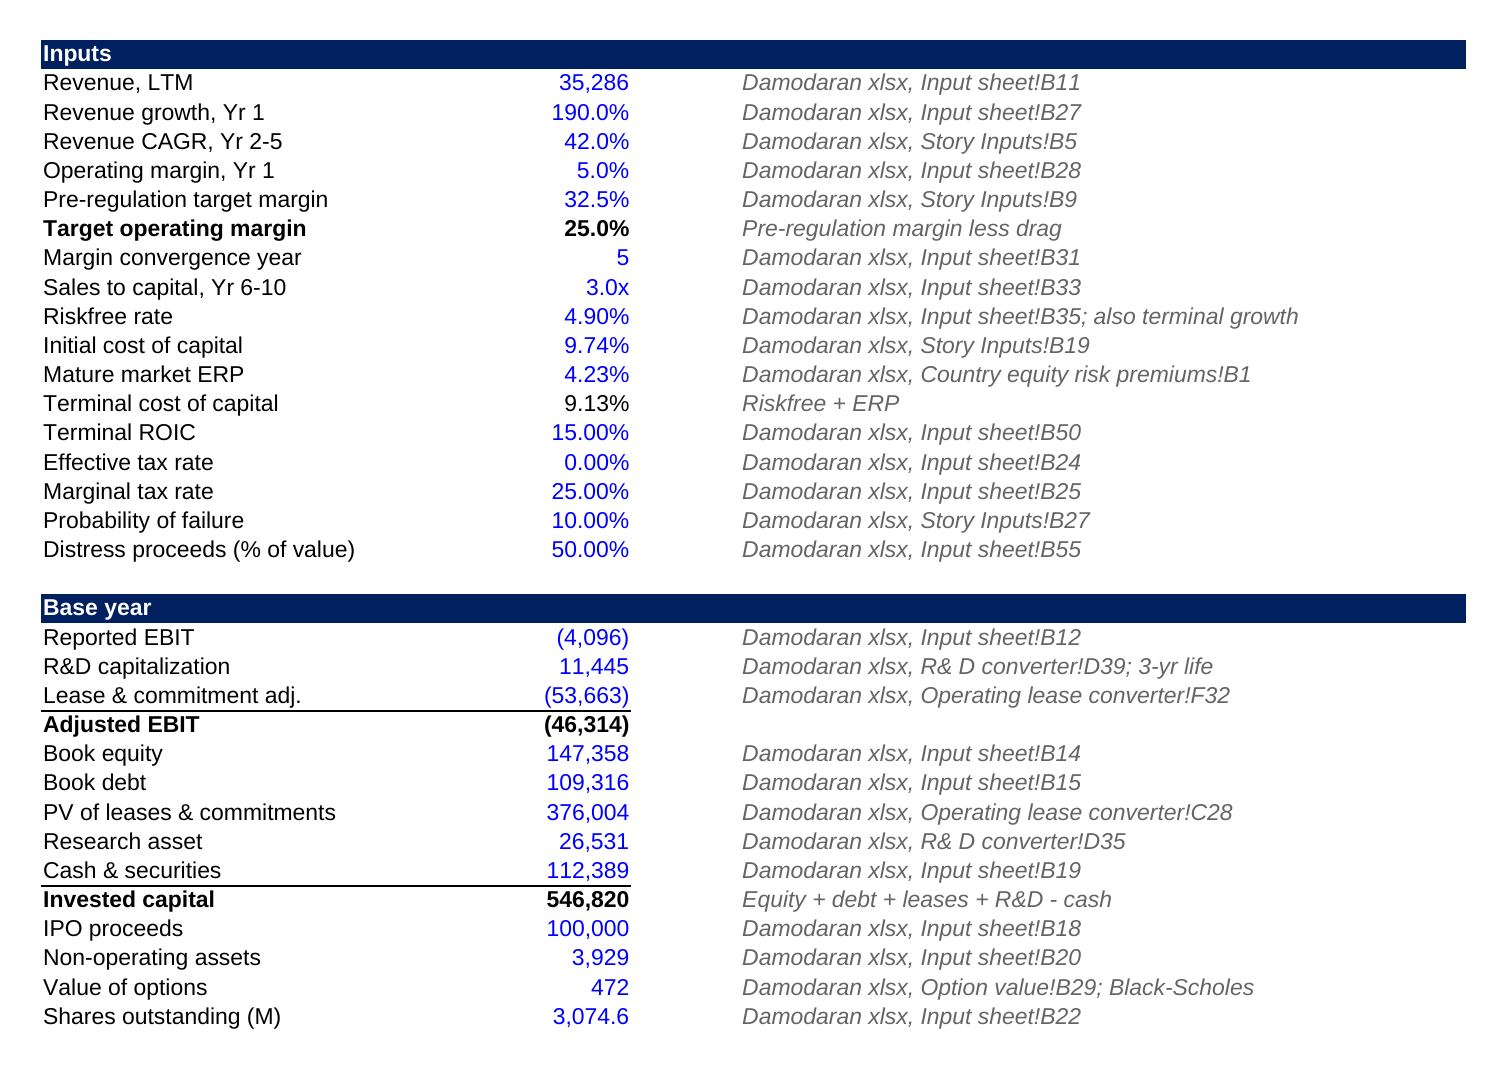
The agent read the post, downloaded the spreadsheet he links, and rebuilt the valuation as a single tab that runs top to bottom: the two election inputs with a switch between them, the other inputs, the ten-year forecast, the terminal value and the bridge to equity. Every input is a blue hard-coded cell with the sheet and cell it came from written beside it, and everything else is a formula.
How the DCF gets to $1.25 trillion
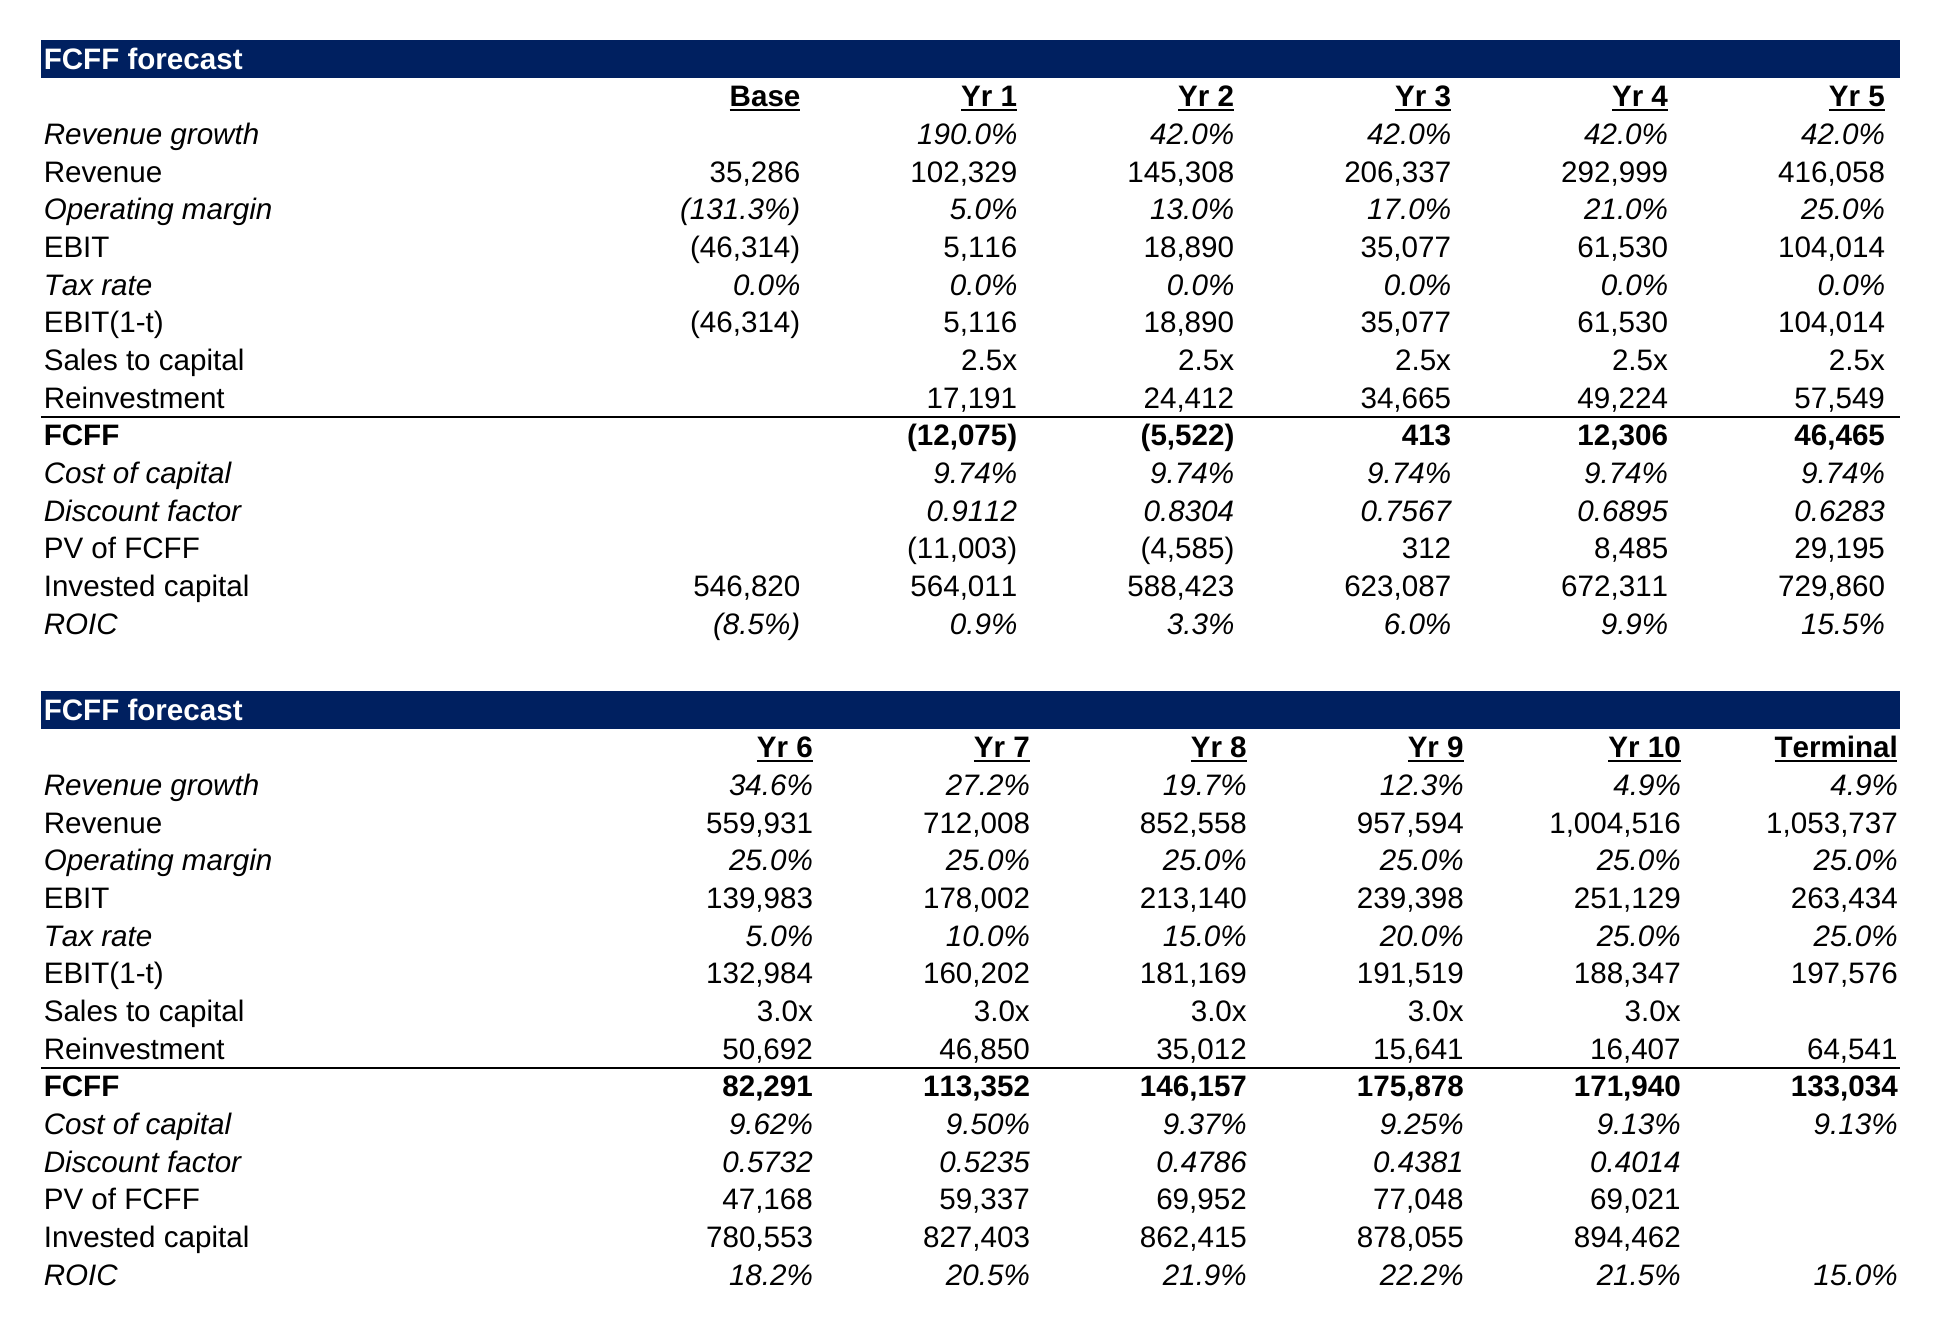
Revenue grows from $35.3 billion to $1.0 trillion in ten years, the operating margin reaches 25% by year 5, and 79% of the present value sits in the terminal value.
- Revenue. Trailing twelve-month revenue of $35,286 million grows 190% in year 1 and 42% a year in years 2 to 5, to $416,058 million. Growth then fades in a straight line to the 4.90% riskfree rate, which puts year 10 revenue at $1,004,516 million.
- Margin. The operating margin starts at 5% in year 1 and rises in a straight line to 25% in year 5: his 32.5% target before regulation, less the 7.5% drag.
- Reinvestment. Each year’s reinvestment is the next year’s revenue increase divided by the sales to capital ratio: 2.5x in years 1 to 5 and 3.0x in years 6 to 10. Free cash flow to the firm is negative in years 1 and 2 and turns positive in year 3.
- Taxes. The tax rate is 0% through year 5 and rises to the 25% marginal rate by year 10.
- Discounting. The cost of capital is 9.74% for five years and fades to 9.13%, the riskfree rate plus a 4.23% equity risk premium. In the terminal year Anthropic grows at 4.90% and earns a 15% return on new capital.
The cash flows then become an equity value in a few lines:
| Step | $ millions |
|---|---|
| Present value of the terminal value | 1,262,498 |
| Present value of free cash flow, years 1 to 10 | 344,930 |
| Sum of present values | 1,607,428 |
| Value of operating assets, after a 10% chance of failure at 50% of value | 1,527,057 |
| Less debt, including $376,004 million of lease and compute commitments | (485,320) |
| Plus cash and securities | 112,389 |
| Plus IPO proceeds | 100,000 |
| Plus non-operating assets | 3,929 |
| Value of equity | 1,258,055 |
Source: rebuilt workbook, Valuation tab, rows 70 to 81; inputs from Damodaran’s AnthropicIPOPostElection.xlsx.
Two lines in that bridge are easy to miss in a headline number. Damodaran treats Anthropic’s lease and compute commitments as debt, which takes $376,004 million off the value on top of $109,316 million of book debt. And he adds the $100,000 million he expected the IPO to raise, so the $1.25 trillion is a value after the offering.
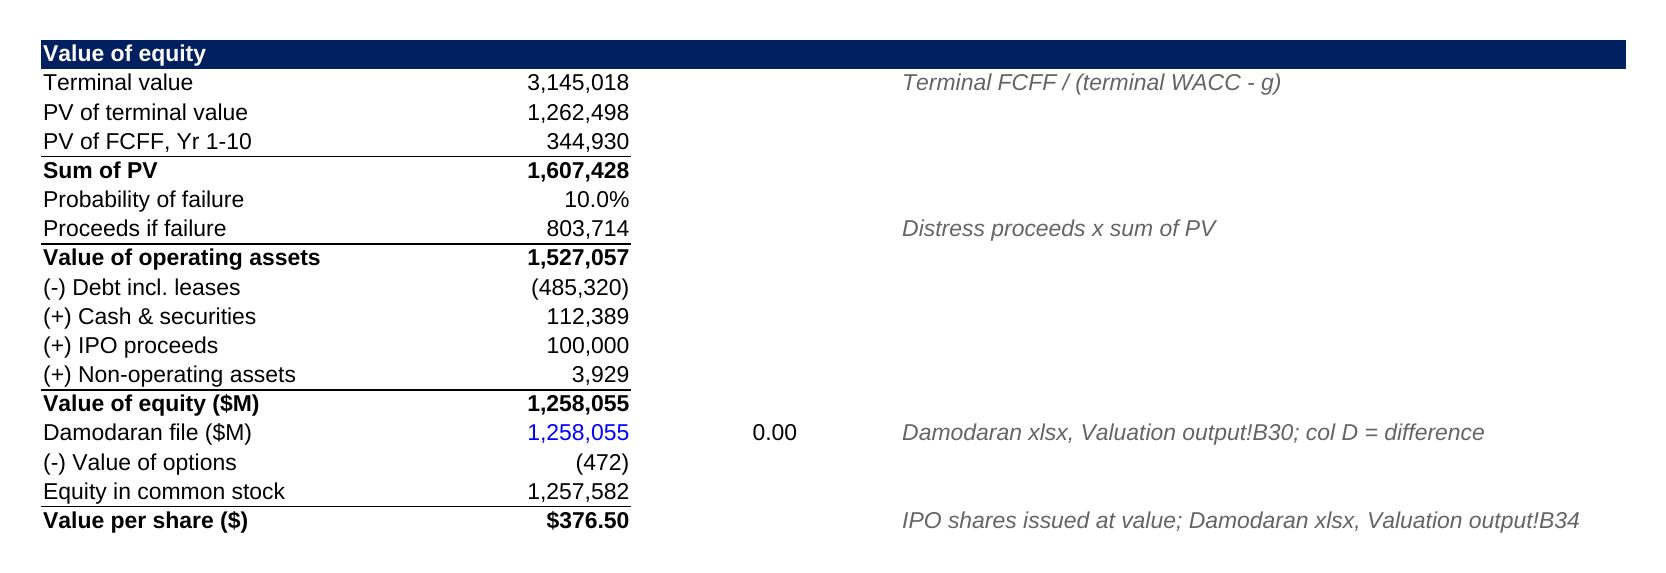
The row under the equity value is the check. It holds the figure from the Valuation output tab of his file, $1,258,054.72 million, and the cell beside it shows the difference from the rebuilt model: 0.00.
The walk from $1.45 trillion to $1.25 trillion
The margin change accounts for $172 billion of the $193 billion fall. The reinvestment change accounts for $21 billion.
Because the two election inputs sit behind one case cell, the workbook also answers a question the post leaves open: how much of the fall comes from each change. Setting the case to pre-election returns $1,450,951 million, his 3 November estimate. Changing one input at a time from there:
| Step | $ millions |
|---|---|
| Value of equity, pre-election inputs | 1,450,951 |
| Regulatory margin drag from 5.0% to 7.5% | (171,954) |
| Sales to capital from 3.0x to 2.5x | (20,942) |
| Value of equity, post-election inputs | 1,258,055 |
Source: rebuilt workbook, each input changed on its own from the pre-election case.
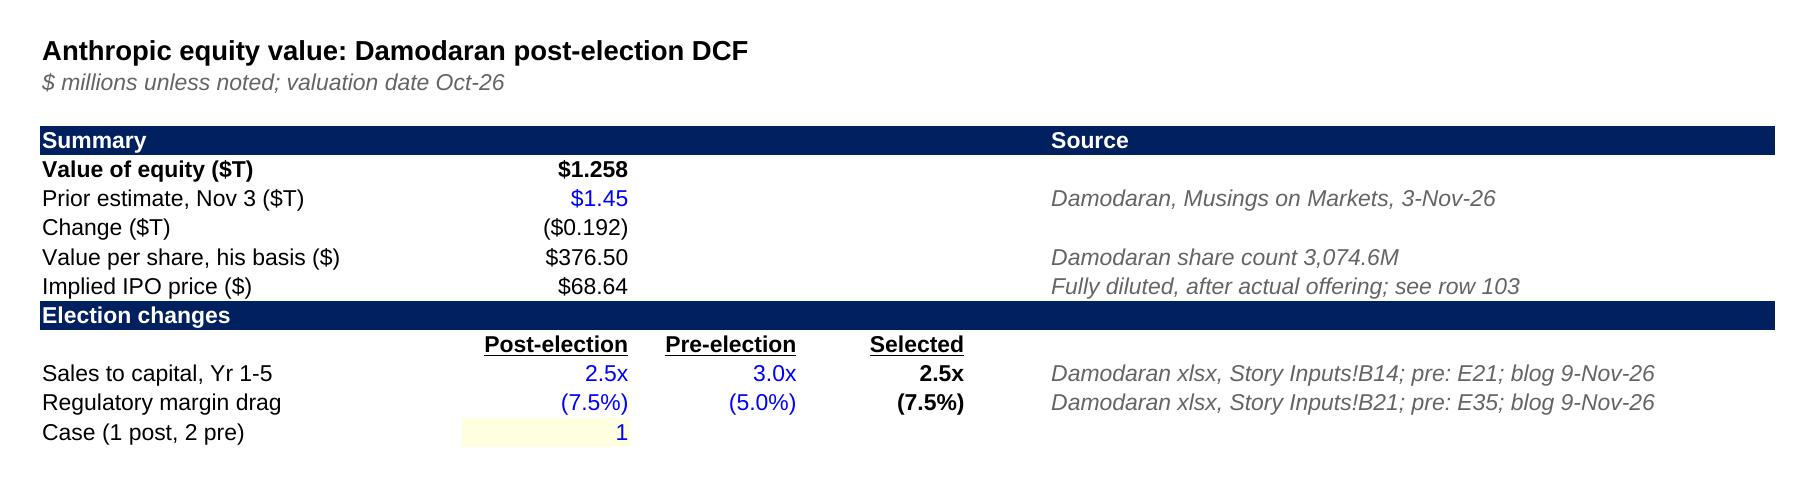
Two and a half points of margin are worth eight times as much as half a turn of capital efficiency. The margin applies to every dollar of revenue for good, including the terminal year, while the lower sales to capital ratio only raises reinvestment in the first five years.
What $1.25 trillion means for the IPO price
On the share count in Anthropic’s 10 November filing, Damodaran’s value works out to $68.64 a share, just under the bottom of the $70 to $78 range.
The day after his post, Anthropic set a price range of $70 to $78 a share. We asked the agent a follow-up on the same email thread: what IPO price does $1.25 trillion imply? It added a block to the same tab.
- Share count. The amended S-1 of 10 November shows 18,013 million fully diluted shares after the offering: 7,430 million Class A, 7,805 million Class N, 1,705 million options on the treasury method and 1,074 million restricted stock units. On that count the range values the equity at $1,260,910 million to $1,405,013 million.
- Headline price. $1,258,055 million divided by 18,013 million shares is $69.84.
- Adjusted for the actual raise. Damodaran assumed $100 billion of IPO cash. The filing has Anthropic selling 801.4 million shares in the offering and 351.4 million in a concurrent private placement, for about $84.6 billion of net proceeds at the $74 midpoint. Taking out his $100 billion and selling the new shares at the IPO price gives $68.64.
- Pre-election inputs. The case switch gives $80.55 on the headline basis and $80.08 after the actual raise, just above the top of the range.
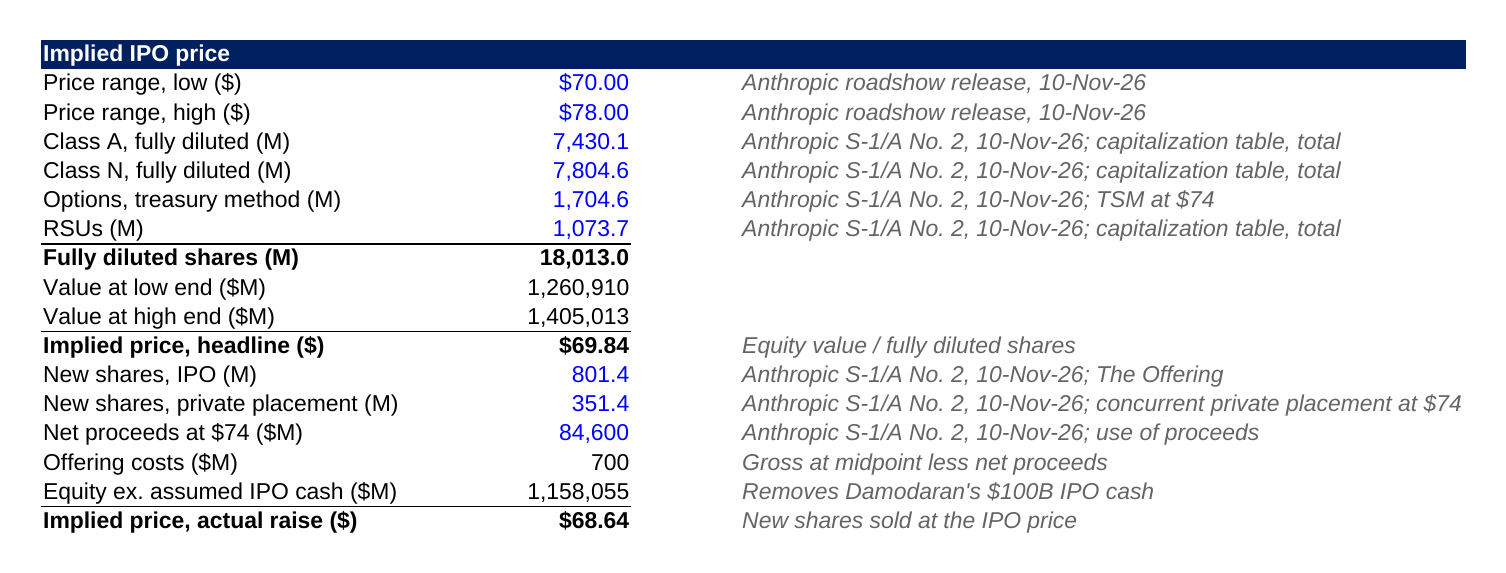
The $376.50 a share in Damodaran’s own spreadsheet is not comparable with the range. It takes the $1,257,582 million of equity in common stock, removes the $100,000 million of assumed IPO proceeds and divides by the 3,074.6 million shares on his input sheet. That is the same as issuing about 265.6 million new shares at $376.50 and dividing by 3,340.2 million. The amended S-1 counts 18,013 million fully diluted shares, and his file notes that he will revisit the share count after the next prospectus filing.
So the range brackets his two cases. His post-election value sits just below the bottom of it and his pre-election value just above the top.
What the rebuild is for
A published valuation is only as useful as a reader’s ability to check it and change it. The one-tab version does both:
- Checked. The model reproduces the author’s own figure exactly, and the check cell stays in the file.
- Traceable. Every input names its source cell, and the IPO block names the filing section each share count came from.
- Editable. The workbook is a normal Excel file with live formulas. Change the regulatory drag, the year 10 revenue path or the IPO proceeds and the equity value and the implied price move with it.
The request took one forwarded email. Any agent in Compound has its own email address, so a newsletter, a broker note or a filing alert can be sent to it with a question, and the reply comes back on the same thread with the file attached.
Download the model
Anthropic DCF valuation model (Excel): Damodaran's $1.25 trillion, rebuiltThe one-tab rebuild of Damodaran’s post-election Anthropic valuation: inputs with their source cells, a switch between the post-election and pre-election cases, the ten-year FCFF forecast, the terminal value, the failure adjustment, the bridge to a $1,258,055 million equity value with a check against his file, and the implied IPO price on the amended S-1 share count, formulas intact.Download · Free
The inputs and the method are Aswath Damodaran’s, from his post and the spreadsheet he publishes with it; the one-tab layout, the case switch, the walk and the implied IPO price are ours.