| B | E | I | J | |
|---|---|---|---|---|
| 4 | MANAGEMENT FINANCIAL FORECASTS (DEFM14A) | |||
| 5 | ($M) | 2026E | 2030E | CAGR 25–30 / total |
| 6 | Revenue ($M) | 940.0 | 1,807.0 | 19.9%1 |
| 8 | Adj. EBITDA, pre-SBC ($M) | 338.0 | 763.0 | 2,671.0 |
| 52 | IC CASE | 2026E | 2030E | CAGR 26–30 / total |
| 53 | Revenue, IC case ($M) | 931.8 | 1,672.7 | 15.7%2 |
| 57 | Adj. EBITDA, IC case ($M) | 335.1 | 672.8 | 2,468.9 |
| 59 | Adj. EBITDA, IC case vs plan | 99.1% | 88.2%3 | 92.4% |
- 1From 2025, a year with only part of Enfusion in it. From 2026, the IC case's basis, the plan's revenue CAGR is 17.7%.
- 2About what the combined business grew in 2025: 15.4% pro forma.
- 3The record supports 88% of management's 2030 EBITDA.
Permira and Warburg Pincus agreed on December 20, 2025 to take Clearwater Analytics (NYSE: CWAN) private at $24.55 a share, $8.4 billion of enterprise value. The price rests on management’s plan in the merger proxy: revenue reaching $1,807 million in 2030, growing 17% to 18% a year from 2027, and adjusted EBITDA margin rising from 34% to 42%. The DCF model page values that plan at $19.78 a share with stock pay as a cost. The question before any model is whether this management team delivered what it said on its calls.
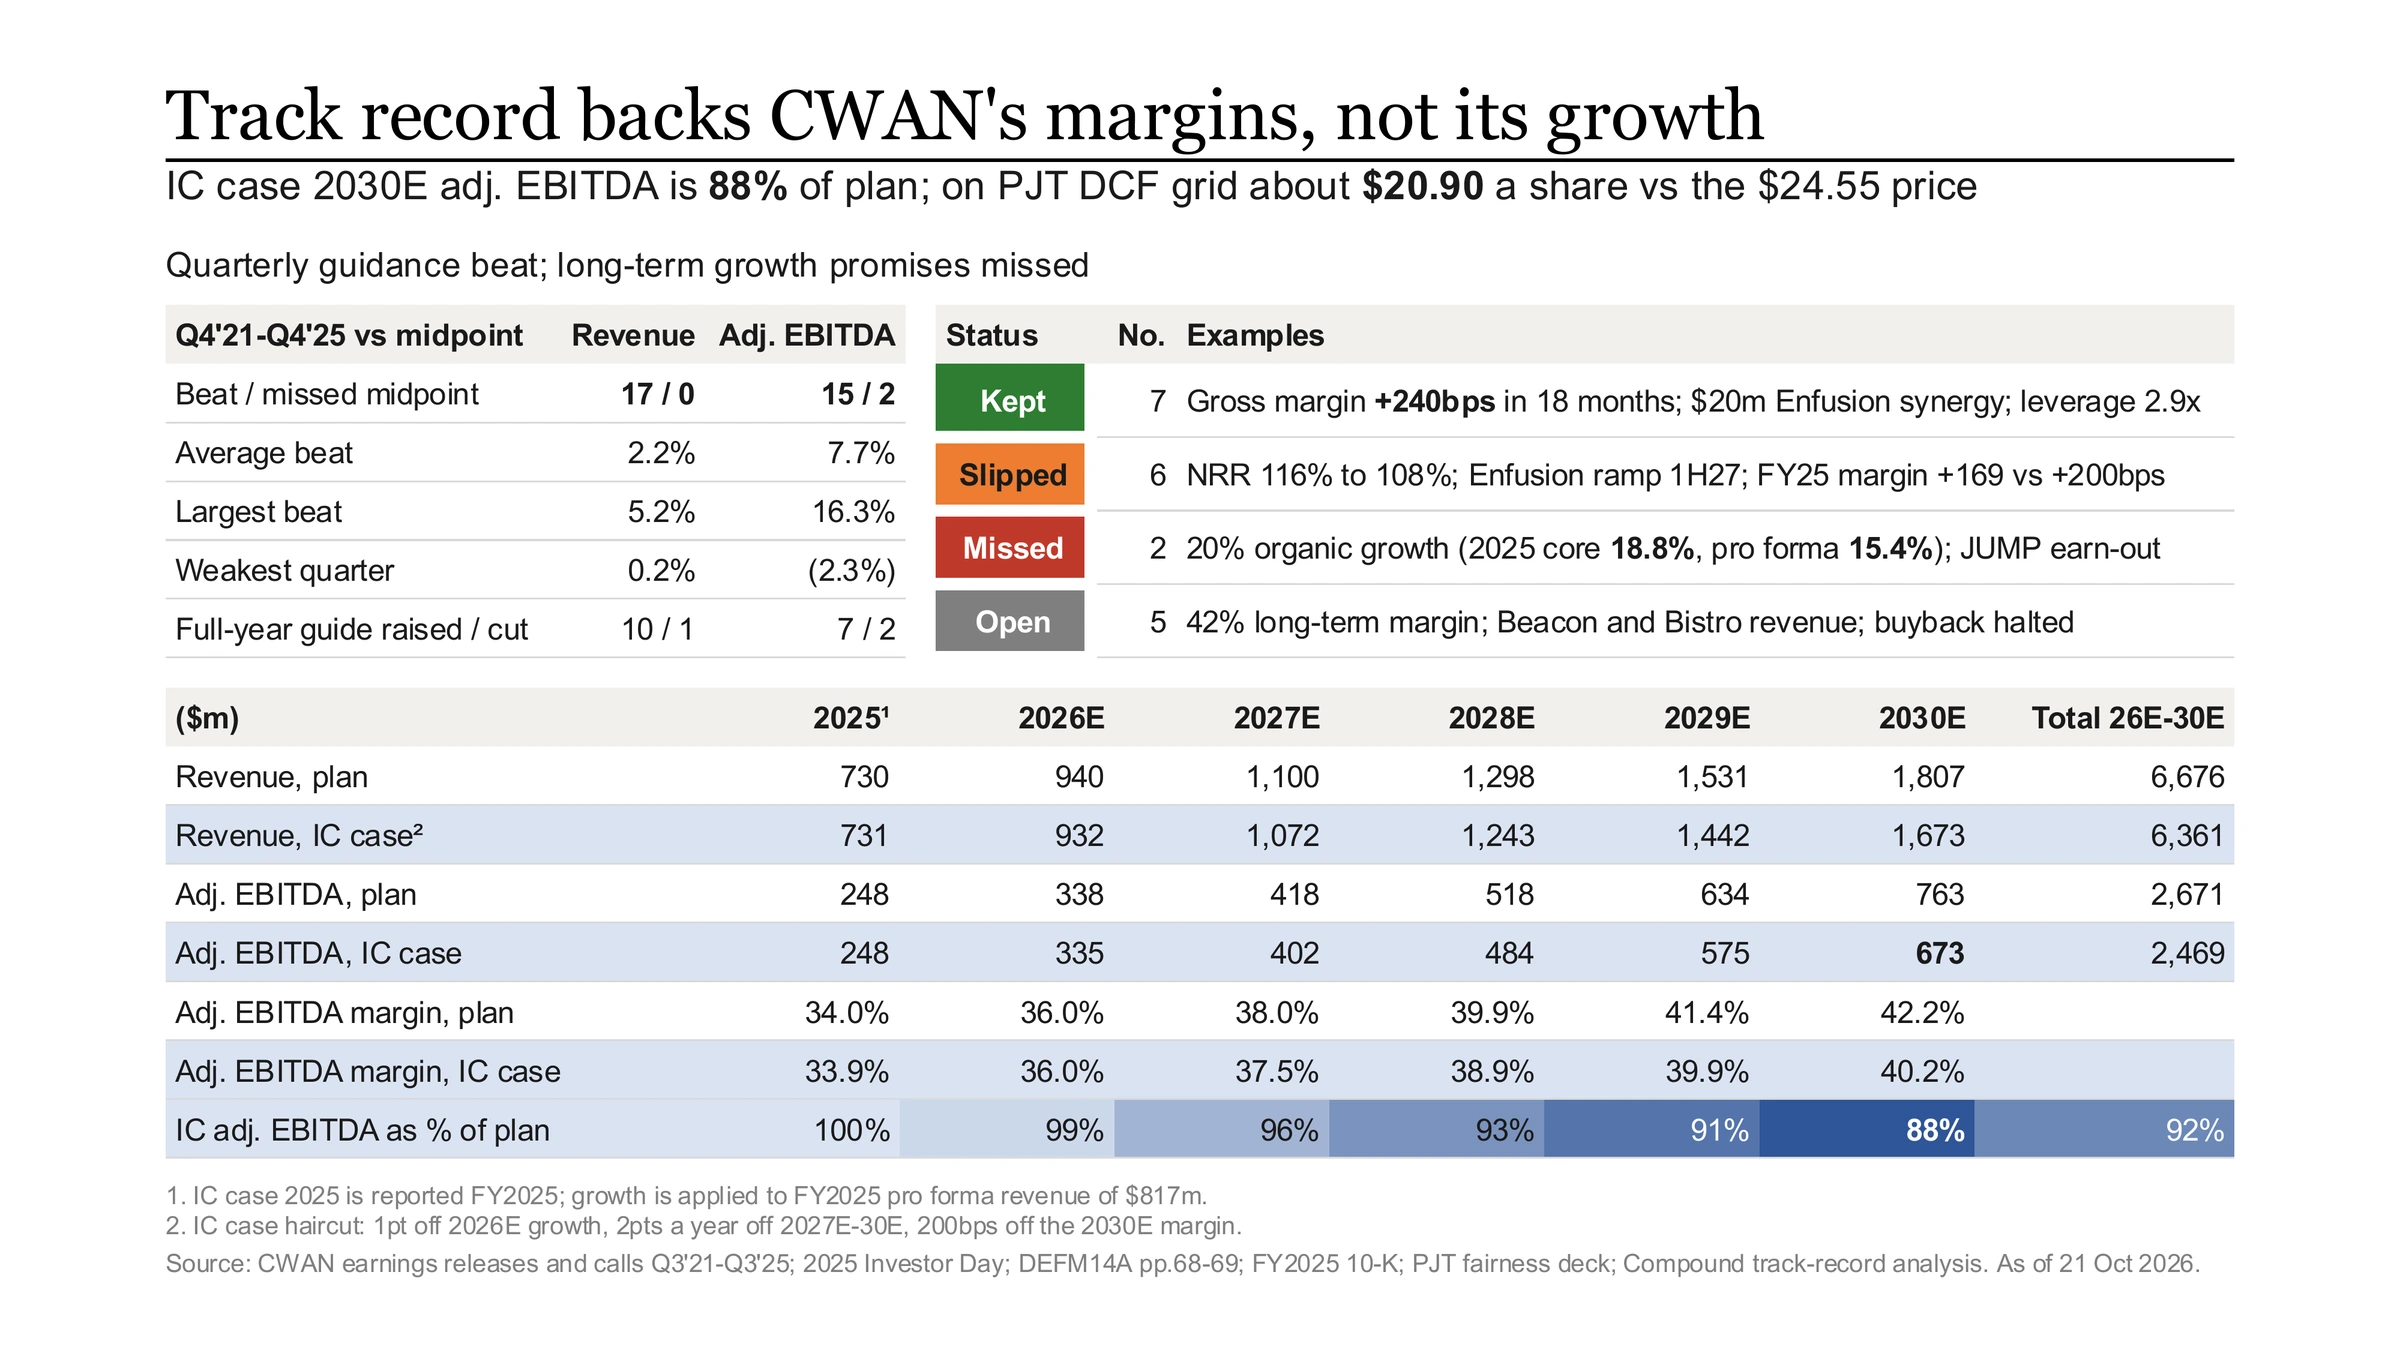
We gave Compound every call transcript, earnings release and filing since the IPO, and the merger proxy. Its answer: management kept its margin promises and missed its growth promises, and its quarterly beats came from guidance set to be beaten. Compound’s IC case keeps most of the plan’s margin and cuts its growth, which leaves 88% of management’s 2030 EBITDA and about $20.90 a share on PJT’s DCF grid, against the $24.55 paid.
An earnings call is the quarterly call where management walks through results and guidance, then takes analysts’ questions. The earnings call transcript records both, word for word. Clearwater held 17 earnings calls between its September 2021 IPO and the sale, plus an investor day in September 2025. Compound read all of them with the earnings releases, 10-Qs, 10-Ks and the merger proxy, and built one workbook, the call record, over five steps.
Guidance track record: 17 quarters scored against the release
Revenue beat the guidance midpoint in every quarter, and management said why.
“Read every [company] earnings call transcript since its IPO, with the earnings releases, 10-Qs and 10-Ks. For every quarter, take the revenue and adjusted EBITDA guidance given on the prior call and what was delivered, with the beat or miss in dollars and percent against the midpoint, and how the full-year guide moved through each year. Cite every cell to its call or filing and page.”
A guidance track record is the simplest test of a management team: what they said next quarter would be, against what the quarterly earnings report then showed. Compound took each guide from the release that carried it and each actual from the next release, and noted where a call and a release disagree. On the Q4’23 call the transcript reads $105 million for the next quarter and the release says $100.5 million. The scorecard uses the release.
| B | F | G | I | M | N | P | |
|---|---|---|---|---|---|---|---|
| 5 | Revenue ($M) | Adj. EBITDA ($M) | |||||
| 6 | Quarter | Mid | Actual | Beat % | Mid | Actual | Beat % |
| 7 | Q4'21 | 66.5 | 69.8 | 5.0% | 17.31 | 20.1 | 16.3% |
| 8 | Q1'22 | 70.0 | 70.8 | 1.1% | 17.5 | 18.9 | 8.0% |
| 9 | Q2'22 | 73.3 | 73.4 | 0.2% | 19.5 | 19.1 | (2.1%) |
| 10 | Q3'22 | 74.8 | 76.6 | 2.5% | 19.3 | 18.8 | (2.3%)2 |
| 11 | Q4'22 | 80.3 | 82.7 | 3.0% | 22.7 | 24.3 | 7.0% |
| 12 | Q1'23 | 83.0 | 84.6 | 1.9% | 20.0 | 22.5 | 12.5% |
| 13 | Q2'23 | 87.5 | 89.9 | 2.7% | 22.8 | 24.8 | 8.8% |
| 14 | Q3'23 | 92.0 | 94.7 | 2.9% | 25.5 | 28.6 | 12.2% |
| 15 | Q4'23 | 98.5 | 99.0 | 0.5% | 28.0 | 30.0 | 7.1% |
| 16 | Q1'24 | 100.5 | 102.7 | 2.2% | 28.8 | 32.2 | 11.8% |
| 17 | Q2'24 | 105.5 | 106.8 | 1.2% | 31.0 | 33.4 | 7.7% |
| 18 | Q3'24 | 113.5 | 115.8 | 2.0% | 36.0 | 38.3 | 6.4% |
| 19 | Q4'24 | 120.2 | 126.5 | 5.2%3 | 38.5 | 41.7 | 8.3% |
| 20 | Q1'25 | 125.0 | 126.9 | 1.5% | 41.5 | 45.1 | 8.7% |
| 21 | Q2'25 | 174.04 | 181.9 | 4.5% | 53.0 | 58.3 | 10.0% |
| 22 | Q3'25 | 203.5 | 205.1 | 0.8% | 65.0 | 70.7 | 8.8% |
| 23 | Q4'25 | 216.5 | 217.5 | 0.5% | 73.0 | 74.1 | 1.5% |
- 1The first guide gave a margin of about 26%, so the EBITDA guide is that margin times the revenue midpoint.
- 2The only quarter below the bottom of an EBITDA range. The guide assumed June 2022 asset prices.
- 3Includes about $3M pulled forward from a regulatory filing season (Q4'24 call p.6).
- 4The first guide after the Enfusion and Beacon deals closed: core $129M plus acquired $45M, with nine days of Enfusion revenue held back.
Revenue beat the midpoint in 17 of 17 quarters, by 2.2% on average, and landed above the top of the range in 16. Adjusted EBITDA beat in 15 of 17, by 7.7%. The only full-year revenue cut came on the Q2’22 call, when falling asset prices took $5 million off the year. The full-year EBITDA guide was cut twice, by $1 million on that call and by $0.5 million on the Q3’22 call. Every later revenue update was a raise, apart from the re-basing for the acquisitions in April 2025.
Clearwater's beat against the guidance midpoint, by quarter
Actual as a percentage above or below the midpoint of the guide given on the prior call
Source: Clearwater earnings releases, Q3'21 to Q4'25. Compound's Guidance scorecard tab.
A perfect record reads as strength, and management told analysts how it was built. “We do feel we should be conservative on a quarterly level, while feeling really confident at an annual level” Q1’24 call, May 1, 2024, p.8. In the first quarter after the Enfusion deal closed, “we had kept the nine days of April revenue of the Enfusion business as a hedge against any unanticipated surprises” Q2’25 call, Aug 6, 2025, p.4. The beats measure a cushion. They say little about a five-year plan, which is what a buyer is paying for, and the plan rests on things management said in words.
By hand
In Compound
The promise ledger: margins kept, growth slipped
Management delivered the promises it controlled and missed the ones the market decided.
Compound read the prepared remarks and the answers for commitments, then followed each one forward through later calls, the 10-K and the proxy. The ledger has 20 promises. The pattern across them is plain: management delivered what it controlled and missed what the market decided.
| Promise | Made | What happened | Verdict |
|---|---|---|---|
| “+200 basis points” of EBITDA margin in 2024 and again in 2025 | Q4’23 call, Feb 28, 2024, p.5 | +349 bps in 2024, and +169 bps in 2025 on a base diluted by the acquisitions | Kept 2024, short 2025 |
| “50 bips of gross margin improvement, kind of year over year” to 80% | Q2’24 call, Jul 31, 2024, p.12 | 240 bps better in 18 months (Q1’25 call, p.6) | Kept early |
| About $20M of Enfusion cost savings “over the first two and a half years after close” | Enfusion deal release, Jan 13, 2025, p.2 | Realized in the first days, then restated as the year-one target (Q2’25 call, p.3) | Kept early |
| Net debt below 4x EBITDA by end-2025, 3x by end-2026 | Investor Day, Sep 3, 2025, p.24 | 2.9x at end-2025 on 2025 EBITDA (3.2x on net debt at the unaffected date) | Kept early |
| “We’ve always said Clearwater grows 20%. We’re committed to that rate.” | Q1’25 call, Apr 30, 2025, p.8 | Core revenue +18.8% in 2025, organic ARR +17.0% at Q3’25, pro forma revenue +15.4% | Not kept |
| Enfusion from “about 13%” to 20% in two years, with “real acceleration” in 2026 | Q1’25 call, Apr 30, 2025, p.9 | 12% expected for 2025, with full re-acceleration moved to the first half of 2027 (Q3’25 call, p.11) | Slipping |
| “Growing NRR to 115” | Q1’24 call, May 1, 2024, p.2 | 116% standalone at Q4’24, then 108% to 110% consolidated after the deals | Kept, then lost |
| “We see stock-based compensation as a percentage of revenue going down over time” | Q2’22 call, Aug 3, 2022, p.10 | 22% of revenue in 2022, 29% in 2023, 25% in 2024, 18% in 2025 ($134.5M with payroll taxes) | Broken 2023, kept since |
The growth anchor
20% vs 15.4%
Rule of 40, as management framed it
47.1 and 49.3
The first acquisition
JUMP earn-out missed
That split decides how to read the plan. Its margin path, 34% to 42%, is the kind of promise this team has kept. Its growth path, 17% to 18% a year from 2027 to 2030, is the kind it has not. The analysts on the calls were asking about the same gap.
Management tone in the Q&A: the questions that stopped getting answers
In 2025 management stopped answering questions about organic growth.
Most AI earnings call analysis tools reduce management tone and sentiment to a score. A score cannot go in a memo or be checked against the transcript. Compound logged all 288 analyst questions on the 17 calls and the investor day, tagged each by theme, and returned the passages where the answers changed.
| B | V | W | X | Y | |
|---|---|---|---|---|---|
| 6 | Call | Total | Share | First asked | Last asked |
| 11 | Integrations | 65 | 23% | Q3'21 | Q3'25 |
| 12 | NRR / pricing | 62 | 22% | Q3'21 | Q3'25 |
| 13 | Guidance / outlook | 44 | 15% | Q4'21 | Q3'25 |
| 14 | Macro / rates / AUM | 37 | 13% | Q3'21 | Q2'25 |
| 8 | Organic vs acquired | 261 | 9% | Q3'21 | Q3'25 |
| 15 | GenAI | 21 | 7% | Q4'21 | Q3'25 |
| 10 | Margins | 18 | 6% | Q4'21 | Q3'25 |
| 16 | Capital / M&A | 15 | 5% | Q3'21 | ID'25 |
| 9 | SBC / dilution | 32 | 1% | Q4'21 | Q4'22 |
- 1Six questions on the last call, the most of any call, after management stopped giving the split.
- 2No analyst asked about SBC on a call after it peaked at 29% of 2023 revenue.
Three answers changed in 2025, each in the same direction.
Organic growth. Q2’24 call, Jul 31, 2024, p.10: “we’re still growing ARR organically north of 20% in Q2.” Q2’25 call, Aug 6, 2025, p.9, asked for the split: “We’re not going to give you the specific details for that.”
Core retention. Q2’25 call, p.2: “Core NRR stands at 114%, with consolidated NRR at 110%.” Q3’25 call, Nov 5, 2025, p.12: “As far as the core Clearwater, all of those metrics we’ve given are across the entirety of the business.”
Organic ARR. Deferred on the Q3’25 call to a February 2026 call. The Q4’25 release came on February 18, 2026 with no call and no outlook.
Margins went the other way. In March 2022 management said of its 80% gross margin, “that’s not the priority” (Q4’21 call, p.19). By the 2025 Investor Day it was capping EBITDA margin: “We don’t want to deliver more EBITDA, frankly. The 200 bps is good enough” (p.28). Read together, the Q&A tells you which number management was managing to. The calls do not say why disclosure narrowed in 2025. The merger proxy shows what was happening at the same time.
The calls against the sale process
The plan given to bidders grew more slowly than the target management repeated in public while the sale was being run.
The proxy’s Background of the Merger is the one public document that dates a sale process. Set against the call calendar, it shows what management said in public while the board was talking to buyers. Deal teams rarely run this check, because the proxy and the transcripts never sit in the same binder.
Clearwater's calls against the sale process
Public statements (top) and the proxy's sale-process dates (bottom)
Source: Clearwater earnings calls, 2025 Investor Day transcript and DEFM14A, Background of the Merger, pp.41-61. Compound's Calls vs process timeline tab.
The proxy dates four things the calls did not say.
- The 2023 market check. In the fall of 2023 the company asked eight potential acquirers for indications of interest and received none (DEFM14A p.41). On the Q3’23 call that November, management said “we will be aggressive on M&A” (p.11). No disclosure was required. It does tell you the public posture of a buyer ran alongside a quiet test of a sale.
- The Investor Day and the buyback. Permira raised a take-private with the CEO on August 1, 2025. Two weeks later the CEO told the board he planned an investor day and roadshow “to support the trading price” (DEFM14A p.42), and the $100 million buyback announced there was “in an effort to support the price” (p.43). The long-term 42% EBITDA and 82% gross margin targets were set at that event.
- The last call. The consortium bid $24.50 on October 23. On November 5, the day after the consortium’s confidentiality agreements were signed, the Q3’25 call said “we entered Q4 with the best pipeline we have had in our history” (p.3). Twelve days later the CEO told the special committee year-end was “a critical period for client bookings” and clients might defer (DEFM14A p.51). Q4 revenue then beat its guide, so the record shows no miss being hidden.
- The plan against the public numbers. Set side by side on the same basis, the plan given to bidders is at or below what management said in public. The clearest difference is growth: management kept its 20% target in public, and the plan grows 17% to 18%.
| D | H | I | L | |
|---|---|---|---|---|
| 40 | Topic | Public figure | Board figure | Gap |
| 41 | Medium-term growth | 20.0% | 17.0%1 | (3.0%) |
| 44 | Long-term gross margin | 82.0% | 80.7%2 | (1.3%) |
| 45 | Long-term adj. EBITDA margin | 42.0% | 42.2% | 0.2% |
- 1The plan grows 17% in 2027 and 18% a year from 2028, 2 to 3 points below the public 20%.
- 2The plan's 2030 gross margin is below the 82% target set at the Investor Day.
Two other figures look like gaps and are not. At the Investor Day in September, the CFO quoted the Street’s 2026 EBITDA as $317 million. By signing in December, PJT’s deck put the Street at $333 million, $5 million below the plan’s $338 million. Stock pay differs only in what it counts. The $135 million to $140 million guided in public includes the payroll taxes on vesting, as did the $134.5 million Clearwater reported for 2025. The plan’s $127 million is the expense alone.
None of this is a finding about conduct. Compared like for like, the plan bidders saw is the more cautious of the two on growth and gross margin, and in line on EBITDA margin and stock pay. On December 16, Warburg Pincus itself questioned “the growth assumptions underlying the Financial Forecasts” (DEFM14A p.60), and the special committee defended them.
Compound’s IC case: 88% of management’s 2030 EBITDA
Compound kept most of the plan’s margin and cut its growth.
Compound built its IC case from what the calls support. Margins are mostly kept, because this team delivers them. Growth is cut, because it does not.
- 2026E: one point off growth. Net revenue retention was 108% and gross retention 97% in Q1’26, and the plan needs Q2 to Q4 revenue averaging $239.6 million, 8.3% above Q1’s $221.2 million.
- 2027E to 2030E: two points a year off growth, leaving 15% to 16%, about what the combined business delivered in 2025.
- Margin: 200 basis points off by 2030, phased in from 2027, for less operating leverage at lower growth.
2030E adjusted EBITDA: plan against the IC case
Management's Financial Forecasts (DEFM14A pp. 68–69) and Compound's IC case
Source: DEFM14A pp. 68–69; Compound's Plan vs record tab.
The IC case reaches 2030 revenue of $1,673 million and adjusted EBITDA of $673 million, 93% and 88% of the plan, and 92% of the plan’s cumulative 2026 to 2030 EBITDA. To put a value on it, Compound used a grid in PJT’s fairness opinion deck that prices the plan at different 2030 margins and 2027 to 2030 growth rates. The IC case’s 16.0% growth and 40.2% margin fall between the grid’s points, and interpolating between them gives about $20.90 a share, against $23.75 on the plan and the $24.55 paid.
| B | C | D | E | F | G | |
|---|---|---|---|---|---|---|
| 62 | VALUE READ-ACROSS: PJT DCF SENSITIVITY ($ PER SHARE) | |||||
| 63 | 2030E margin / 2027E-2030E revenue CAGR | 20.0% | 18.0% | 16.0% | 14.0% | |
| 64 | 42.2% | $25.25 | $23.751 | $22.25 | $21.00 | |
| 65 | 40.0% | $23.50 | $22.25 | $20.75 | $19.50 | |
| 66 | 38.0% | $22.00 | $20.75 | $19.50 | $18.25 | |
| 67 | 36.0% | $20.50 | $19.25 | $18.00 | $17.00 | |
| 69 | IC 2027E-2030E revenue CAGR | 16.0% | ||||
| 70 | IC 2030E adj. EBITDA margin | 40.2% | ||||
| 75 | Implied value per share, IC case ($) | $20.902 | ||||
| 76 | Implied value per share, plan case ($) | $23.75 | ||||
| 77 | Deal price ($) | $24.55 | ||||
| 78 | IC value vs plan value | (12.0%) | ||||
| 79 | IC value vs deal price | (14.9%) |
- 1Management's plan, 42.2% and 18%: PJT's $23.75.
- 2The IC case's 16.0% growth and 40.2% margin, interpolated between the grid's rows and columns.
That read-across flatters the case, since PJT’s grid holds 2026 and 2027 at plan. The $20.90 is also on PJT’s basis: a 10.5% WACC and 6.0% growth forever after 2030. The DCF model page, at a 10.87% WACC and 2.5% growth after 2035, values the plan at $19.78 and Compound’s own case at $14.68, so the two pages differ on the discount rate and terminal growth as well as the forecast. Each further point of growth haircut costs about three points of 2030 EBITDA.
What 17 earnings calls mean for the price
The call record says what the $24.55 price assumes.
The deal closed on June 25, 2026 at $24.55. This team beat its revenue guide in all 17 quarters because it set the guides to be beaten, beat its EBITDA guide in 15 of 17, and kept its margin promises. The price assumes it also delivers the growth it stopped quantifying in the months it was talking to buyers. The first plan-period release, for Q1’26, showed 108% net retention and 97% gross retention, below the “98% or better” management had cited for 26 of the previous 27 quarters. An IC memo should say which case the fund underwrote, and the 17 calls are the best evidence for that choice, because they are management’s own words checked against management’s own filings.
The same signs show up on other companies before a sale: quarterly beats that hide a growth anchor slipping, disclosure narrowing to consolidated numbers, a buyback announced to support the stock. The deal sourcing page searches other companies’ calls for them.