Analog Devices Q4 Earnings Preview: $3.97 EPS vs $3.88 Consensus
Analog Devices reports fiscal fourth-quarter results before the open on Tuesday, Nov. 24. Our model puts revenue at $4.39 billion and adjusted EPS at $3.97, against FactSet consensus of $4.32 billion and $3.88, and expects a first-quarter revenue guide of about $4.4 billion.
Analog Devices reports results for its fiscal fourth quarter, which ended Oct. 31, at 7:00 a.m. ET on Tuesday, Nov. 24, the company said in an Oct. 22 release. The call starts at 10:00 a.m. ET. In August, ADI guided fourth-quarter revenue to $4.3 billion, plus or minus $100 million, with an adjusted operating margin of about 52% and adjusted EPS of $3.86, plus or minus $0.15.
Compound's model forecasts revenue of $4.39 billion, 2.2% above the guidance midpoint and 1.7% above the FactSet consensus of $4.32 billion. We forecast adjusted EPS of $3.97, 2.2% above the $3.88 consensus, on an adjusted gross margin of 74.2% and an adjusted operating margin of 52.5%. We expect ADI to guide first-quarter revenue to about $4.4 billion, above the $4.35 billion consensus.
ADI shares closed at $383.67 on Nov. 17, up 66.9% from a year earlier and 11.4% below the Oct. 29 close of $433.28, according to FactSet. They fell on the day of each of the last two reports, by 3.9% in May and 0.9% in August, although revenue and EPS beat consensus both times.
We built an 11-page earnings preview deck on the model. The slides below come from it, and the deck and the Excel model are free to download at the end.
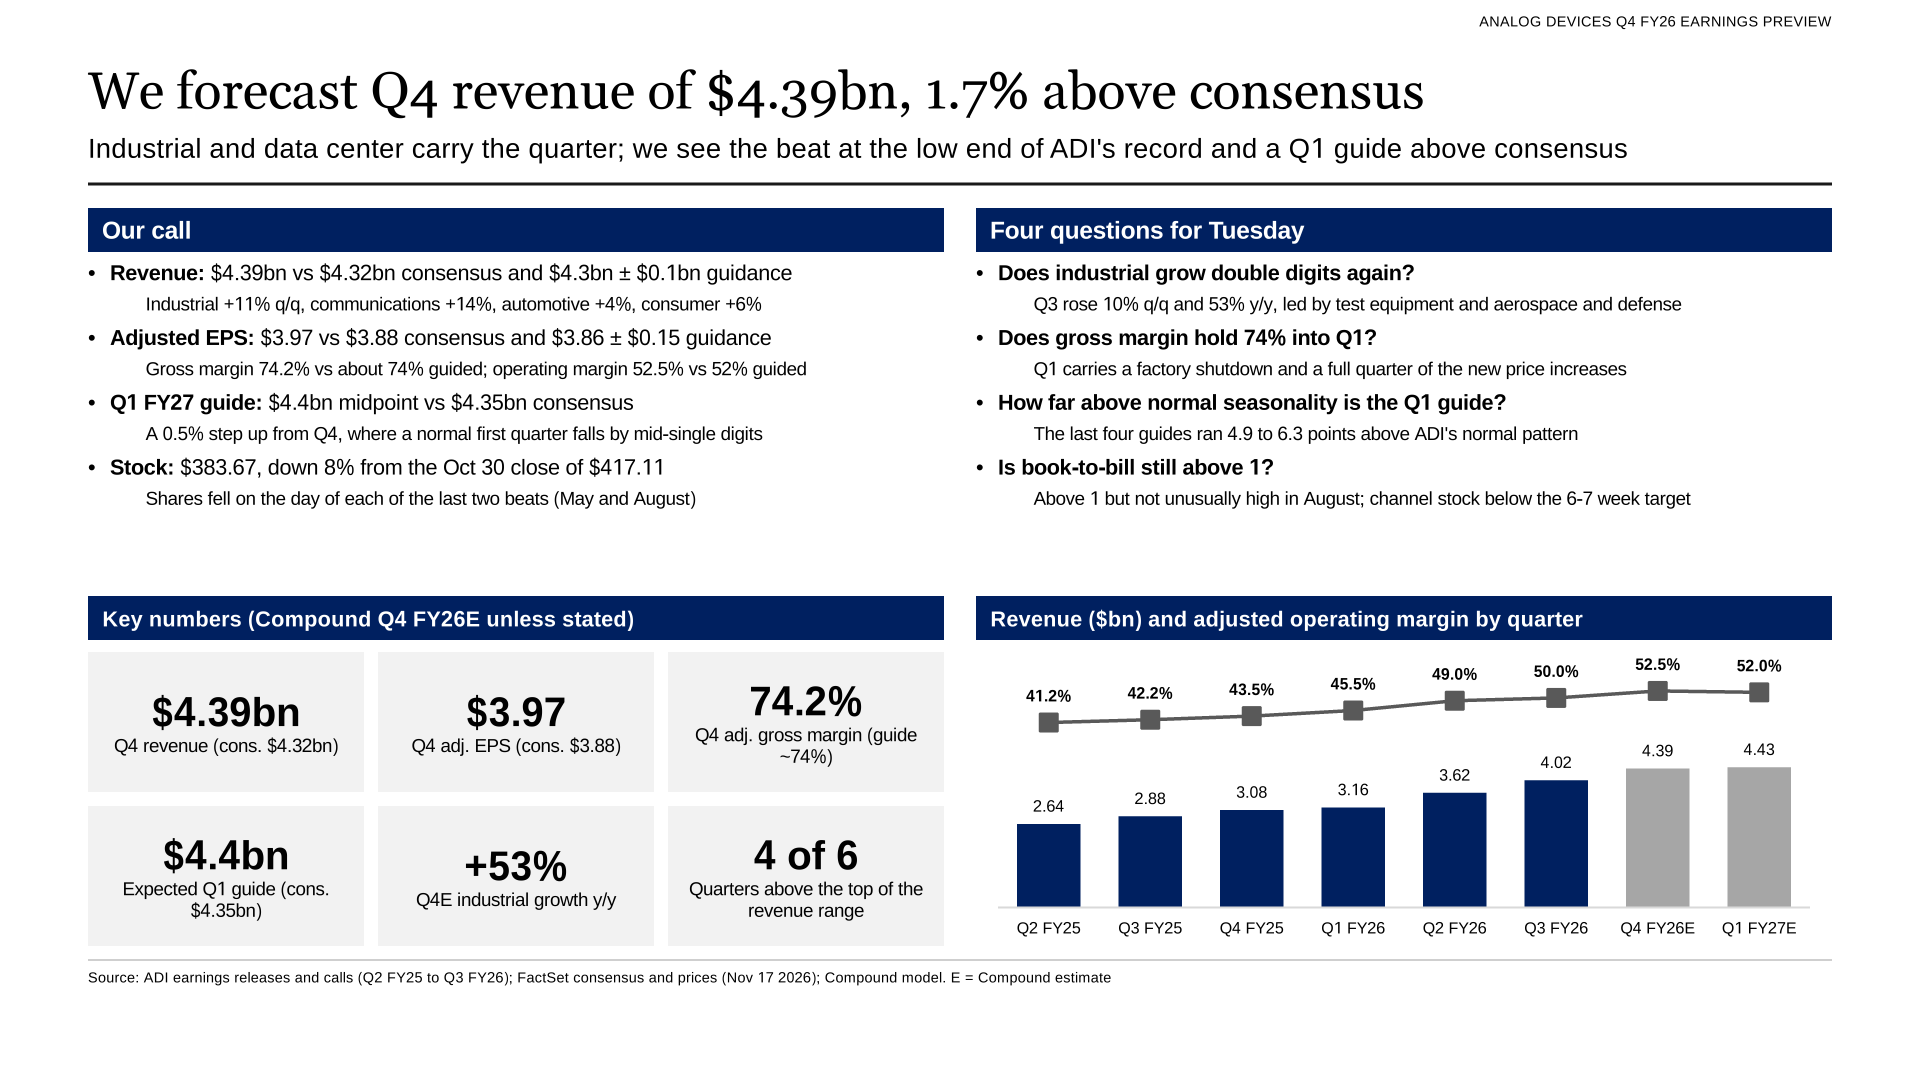
Executive summary: our call against guidance and consensus, and four questions for Tuesday.
Forecast vs consensus
| Q4 FY26 | Guidance | Consensus | Compound | Compound vs consensus |
|---|---|---|---|---|
| Revenue ($M) | 4,300 | 4,321 | 4,394 | +1.7% |
| Adjusted gross margin | about 74% | 74.1% | 74.2% | +0.1 pt |
| Adjusted operating income ($M) | 2,236 | 2,251 | 2,308 | +2.6% |
| Adjusted operating margin | 52.0% | 52.1% | 52.5% | +0.4 pt |
| Adjusted EPS ($) | 3.86 | 3.88 | 3.97 | +2.2% |
| GAAP EPS ($) | 3.14 | 3.15 | 3.25 | +3.4% |
| Free cash flow ($M) | n/a | 1,774 | 1,895 | +6.9% |
| Q1 FY27 revenue guide midpoint ($M) | n/a | 4,351 | 4,400 | +1.1% |
Consensus is the FactSet mean as of Nov. 17. FactSet has no gross margin consensus for ADI; the 74.1% is implied by its EBIT, R&D and SG&A means. The Q1 consensus figure is FactSet's first-quarter revenue estimate. Guidance comes from ADI's Aug. 19 release, and the 74% gross margin from the CFO on that day's call.
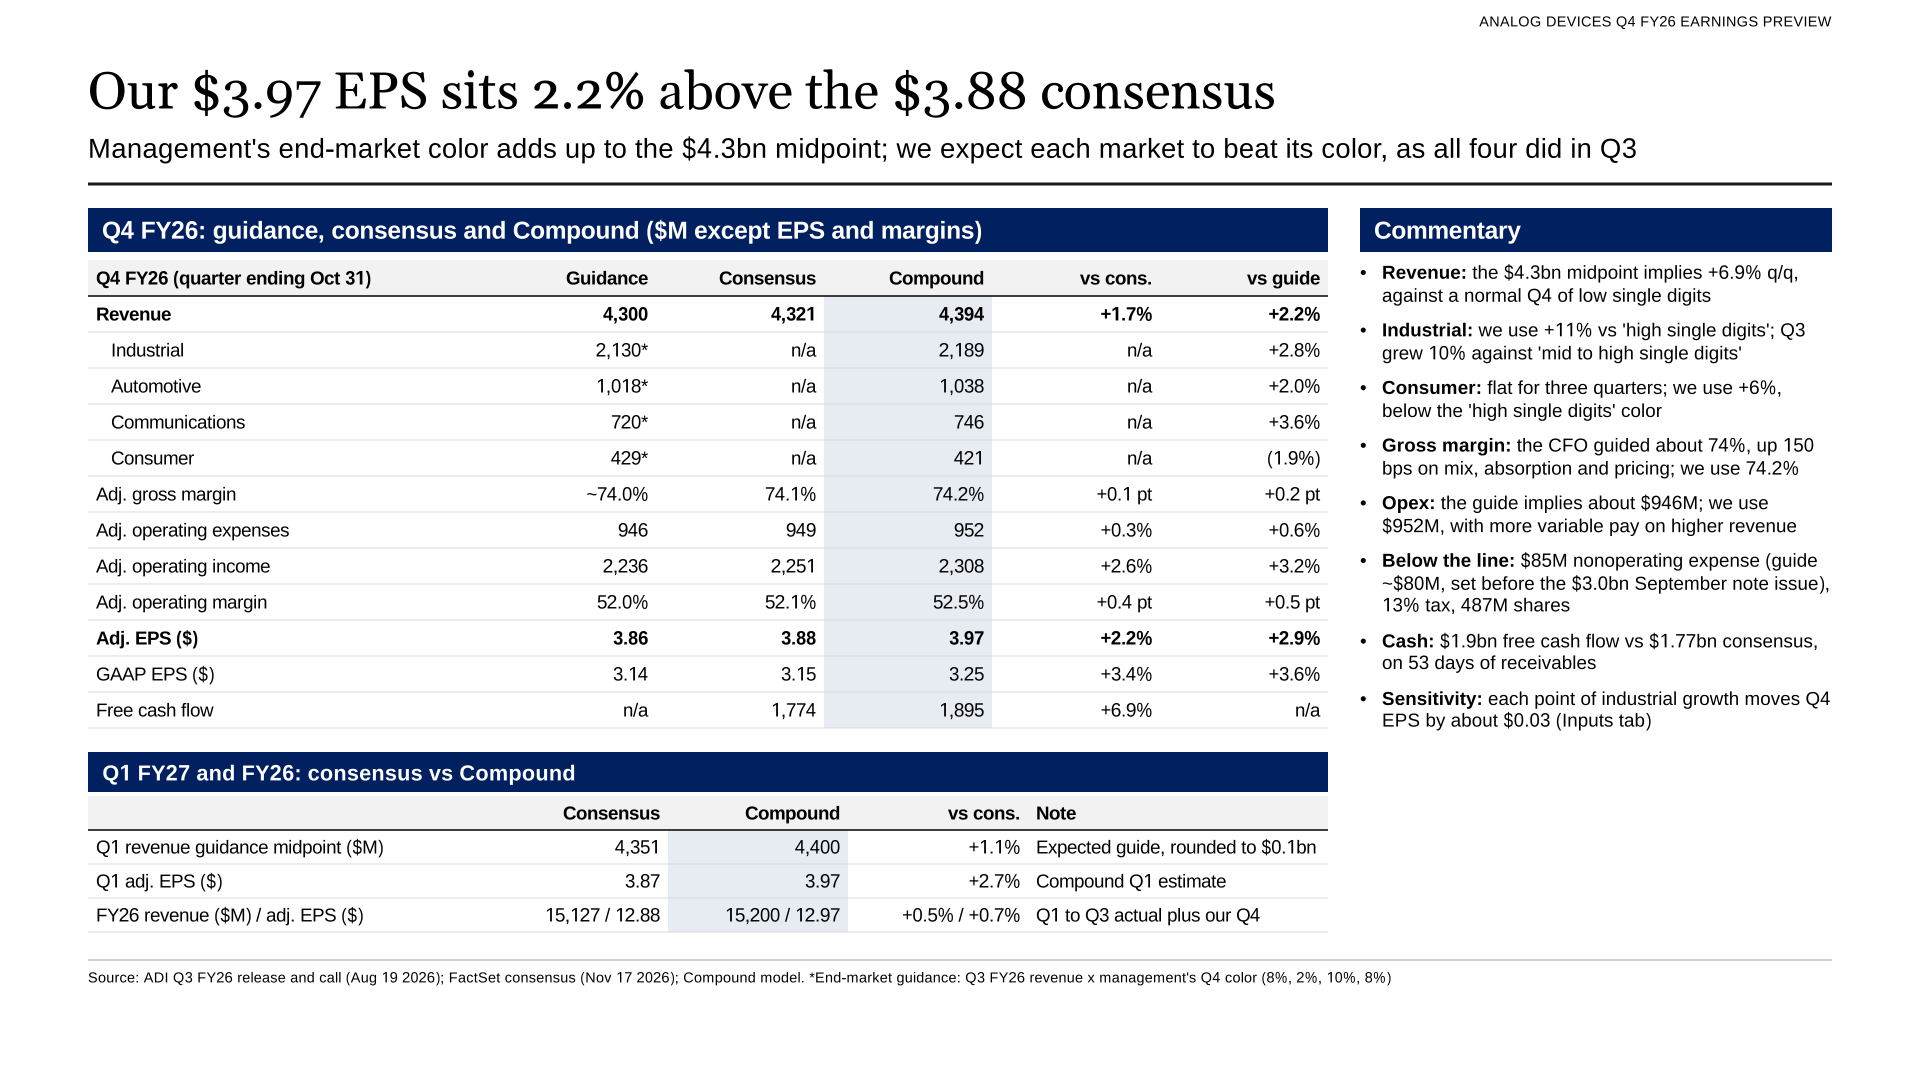
Management's end-market color adds up to the $4.3 billion midpoint; we expect each market except consumer to beat it.
Track record
ADI's revenue beat the midpoint of its own guidance in each of the last six quarters, by 1.9% to 5.6% and by 3.6% on average, according to its earnings releases. Revenue cleared the top of the range in four of the six, including the last two. Over the same quarters revenue beat the FactSet consensus by 3.1% on average and adjusted EPS by 5.2%.
Our forecast sits 2.2% above the midpoint, below that average. The $4.3 billion guide already implies 6.9% sequential growth, against what ADI calls a normal fourth quarter of low single digits.
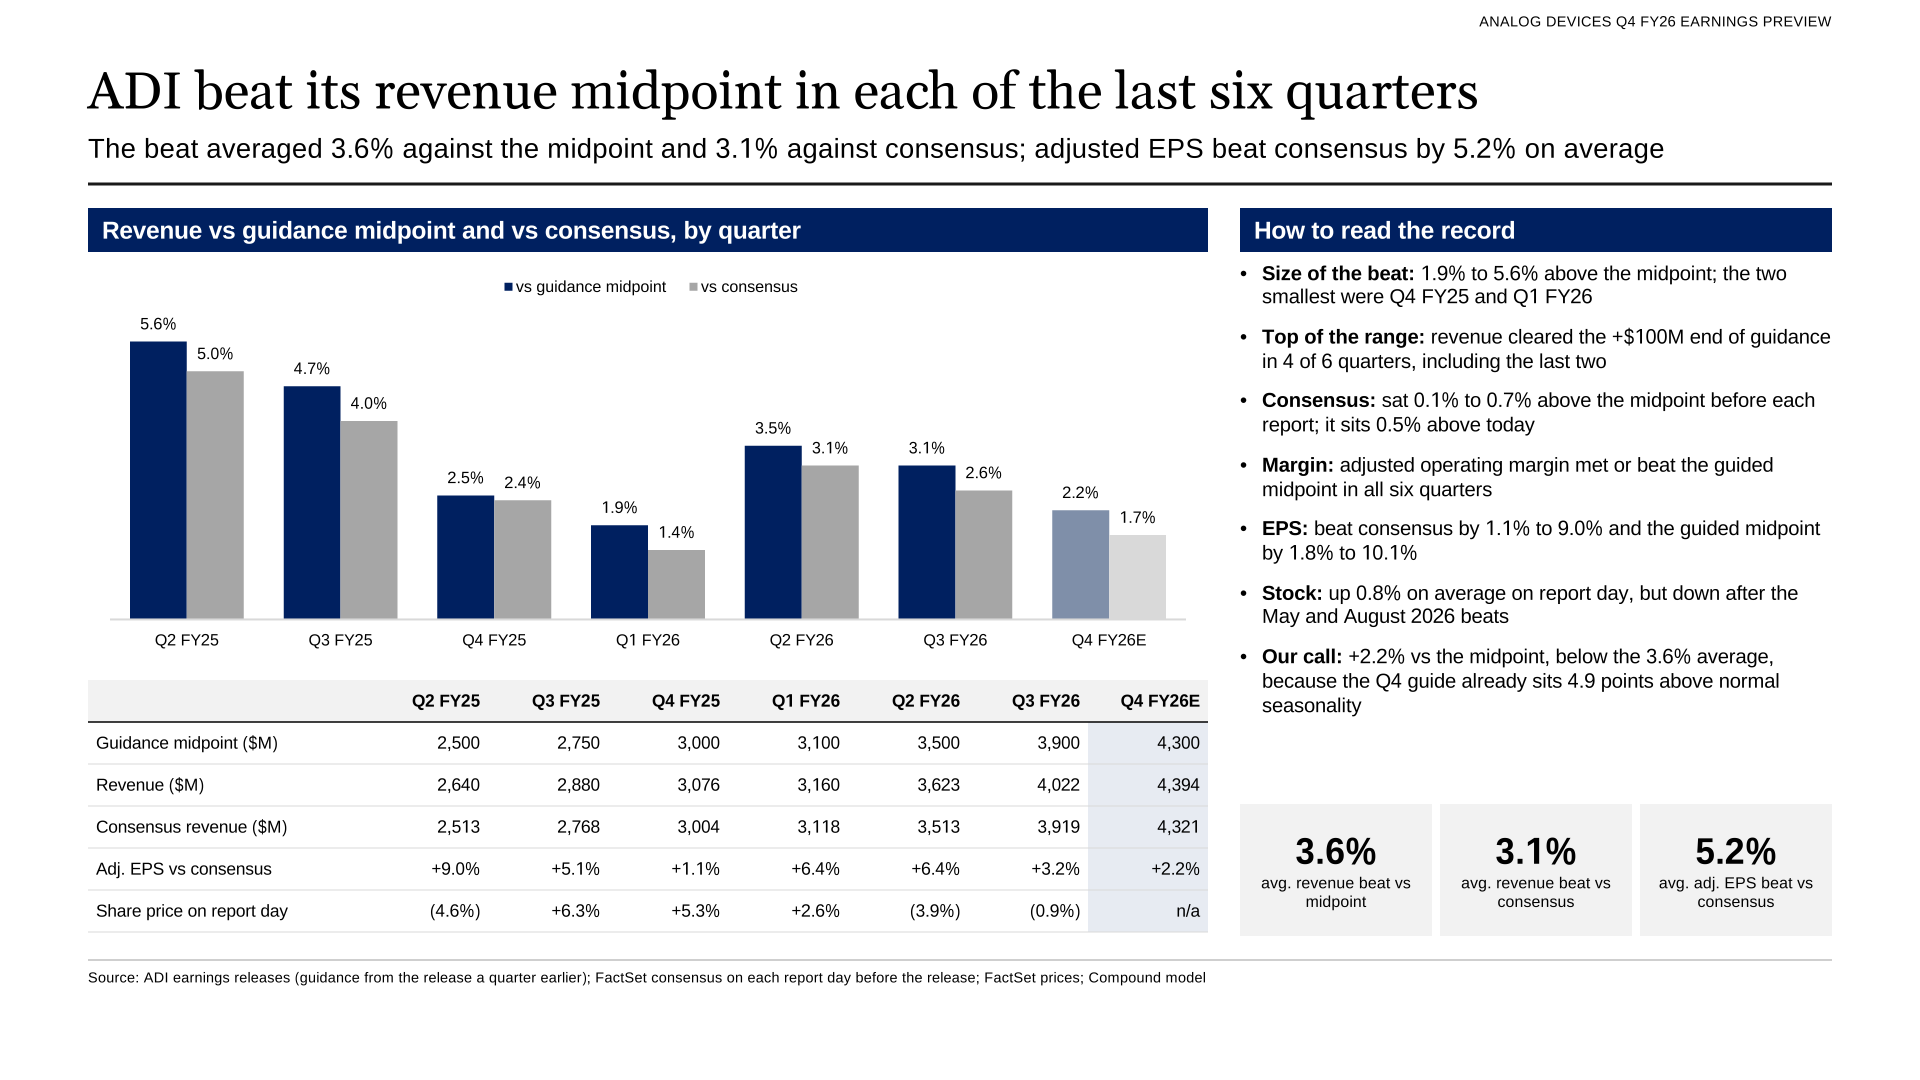
The beat has run between 1.9% and 5.6% of the midpoint; the stock has not always followed.
End markets
Industrial was 49% of revenue in the fiscal third quarter, up 10% from the second quarter and 53% from a year earlier, CFO Richard Puccio said on the Aug. 19 call. Test equipment, electronic test and measurement, aerospace and defense and automation led. Communications rose 84% from a year earlier; data center is now 80% of that segment and grew more than 100% in both optical and power. Automotive rose 14% sequentially and consumer was flat.
For the fourth quarter, investor relations head Jeff Ambrosi said on the call that ADI expects industrial up high single digits, communications to lead with data center up about 10%, consumer up high single digits and automotive up low single digits. Applied to third-quarter revenue, that color adds up to $4.30 billion. We model industrial up 11%, communications up 14%, automotive up 4% and consumer up 6%, for $97 million more revenue; industrial supplies $59 million of it.
In May, ADI guided third-quarter industrial and automotive revenue up mid to high single digits sequentially. They grew 10% and 14%.
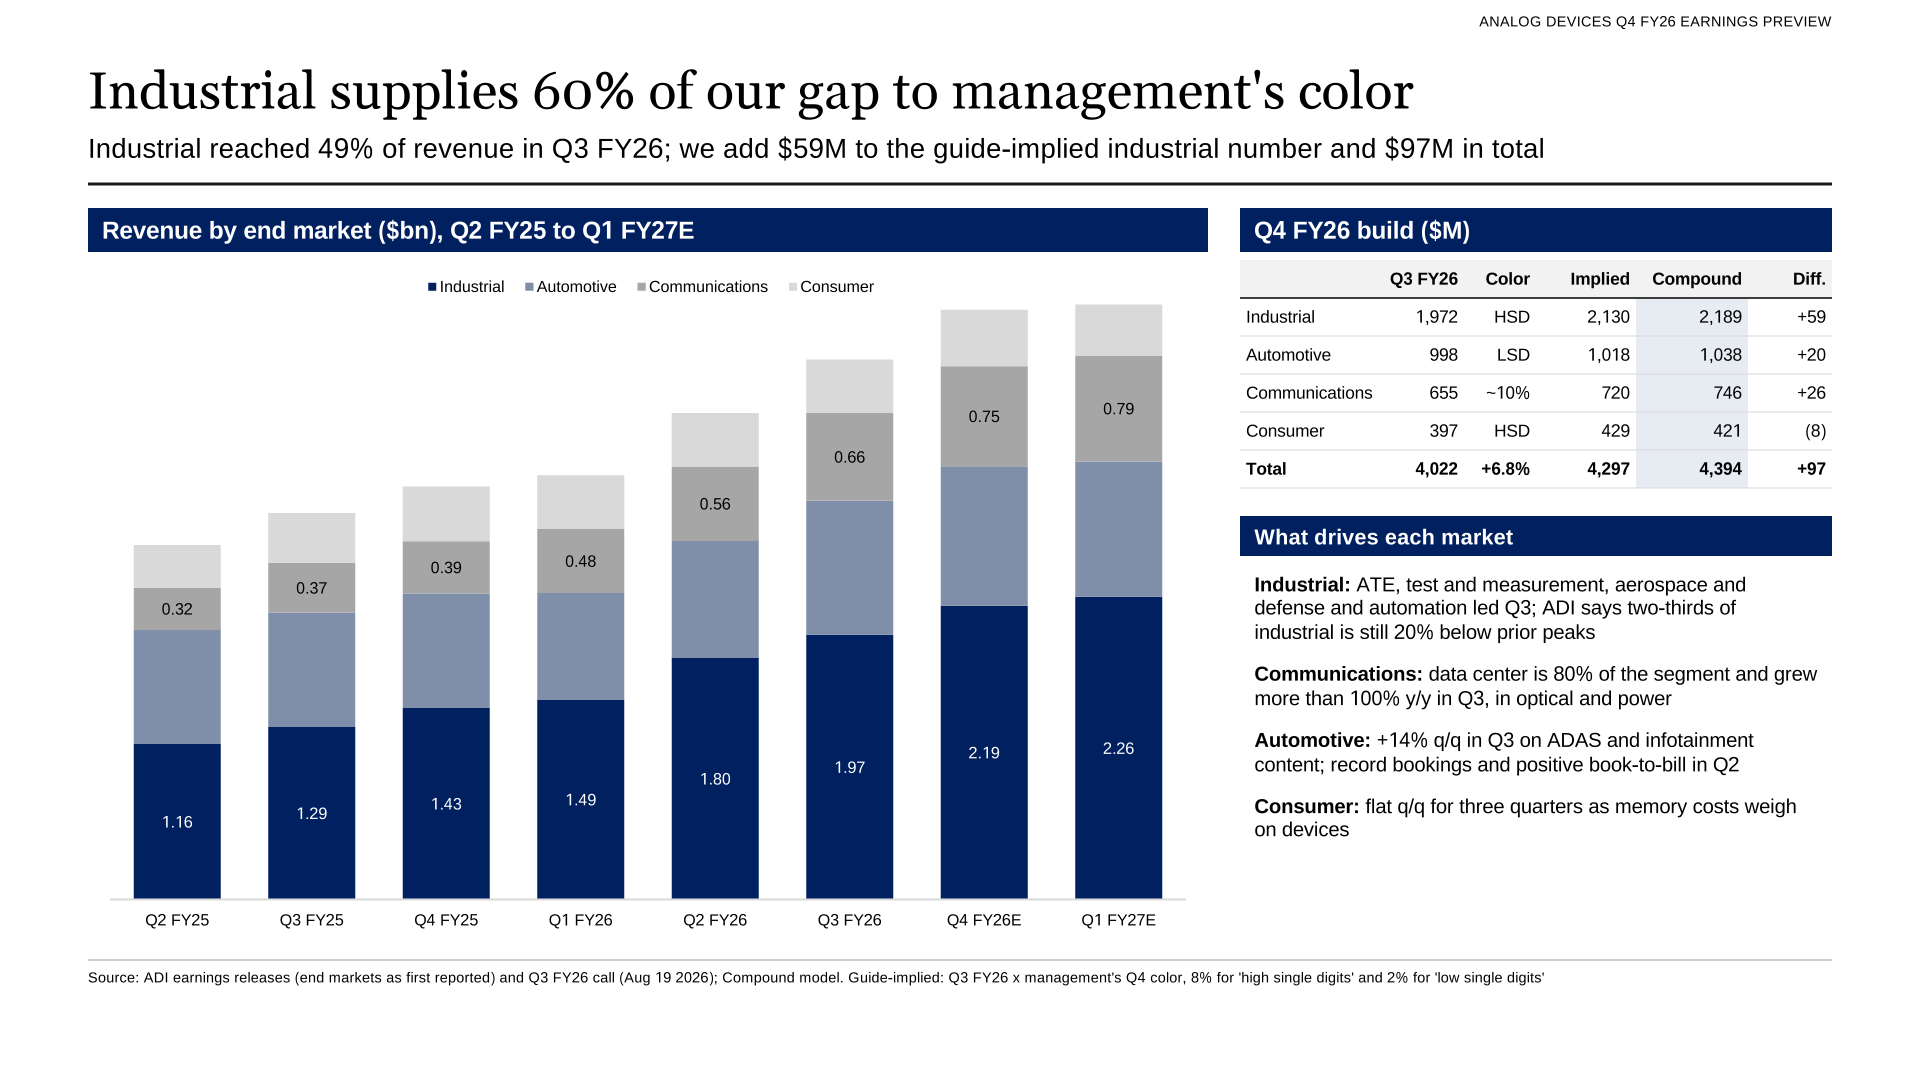
Industrial is about half of ADI's revenue and most of our gap to management's color.
Industrial and auto recovery
On ADI's reported basis, industrial revenue grew 56% from a year earlier in the fiscal second quarter and 53% in the third. Automotive growth slowed to 8% in the first quarter and 2% in the second, against a year-ago base that Puccio said included tariff-related pull-ins, then recovered to 16% in the third.
ADI does not publish a book-to-bill ratio but describes it on each call. It was just below 1 in the fourth quarter of fiscal 2025, which Puccio called typical for that quarter. In February, industrial was well above 1 excluding pricing and automotive was below 1. In May, automotive had record bookings. In August, Puccio said book-to-bill was above 1 but not in an unusually high range.
Puccio also said in August that most of ADI's business still ships well below historical consumption levels and that customers have not restocked. ADI's inventory days fell to 156 in the third quarter and channel inventory fell below its six-to-seven-week target.
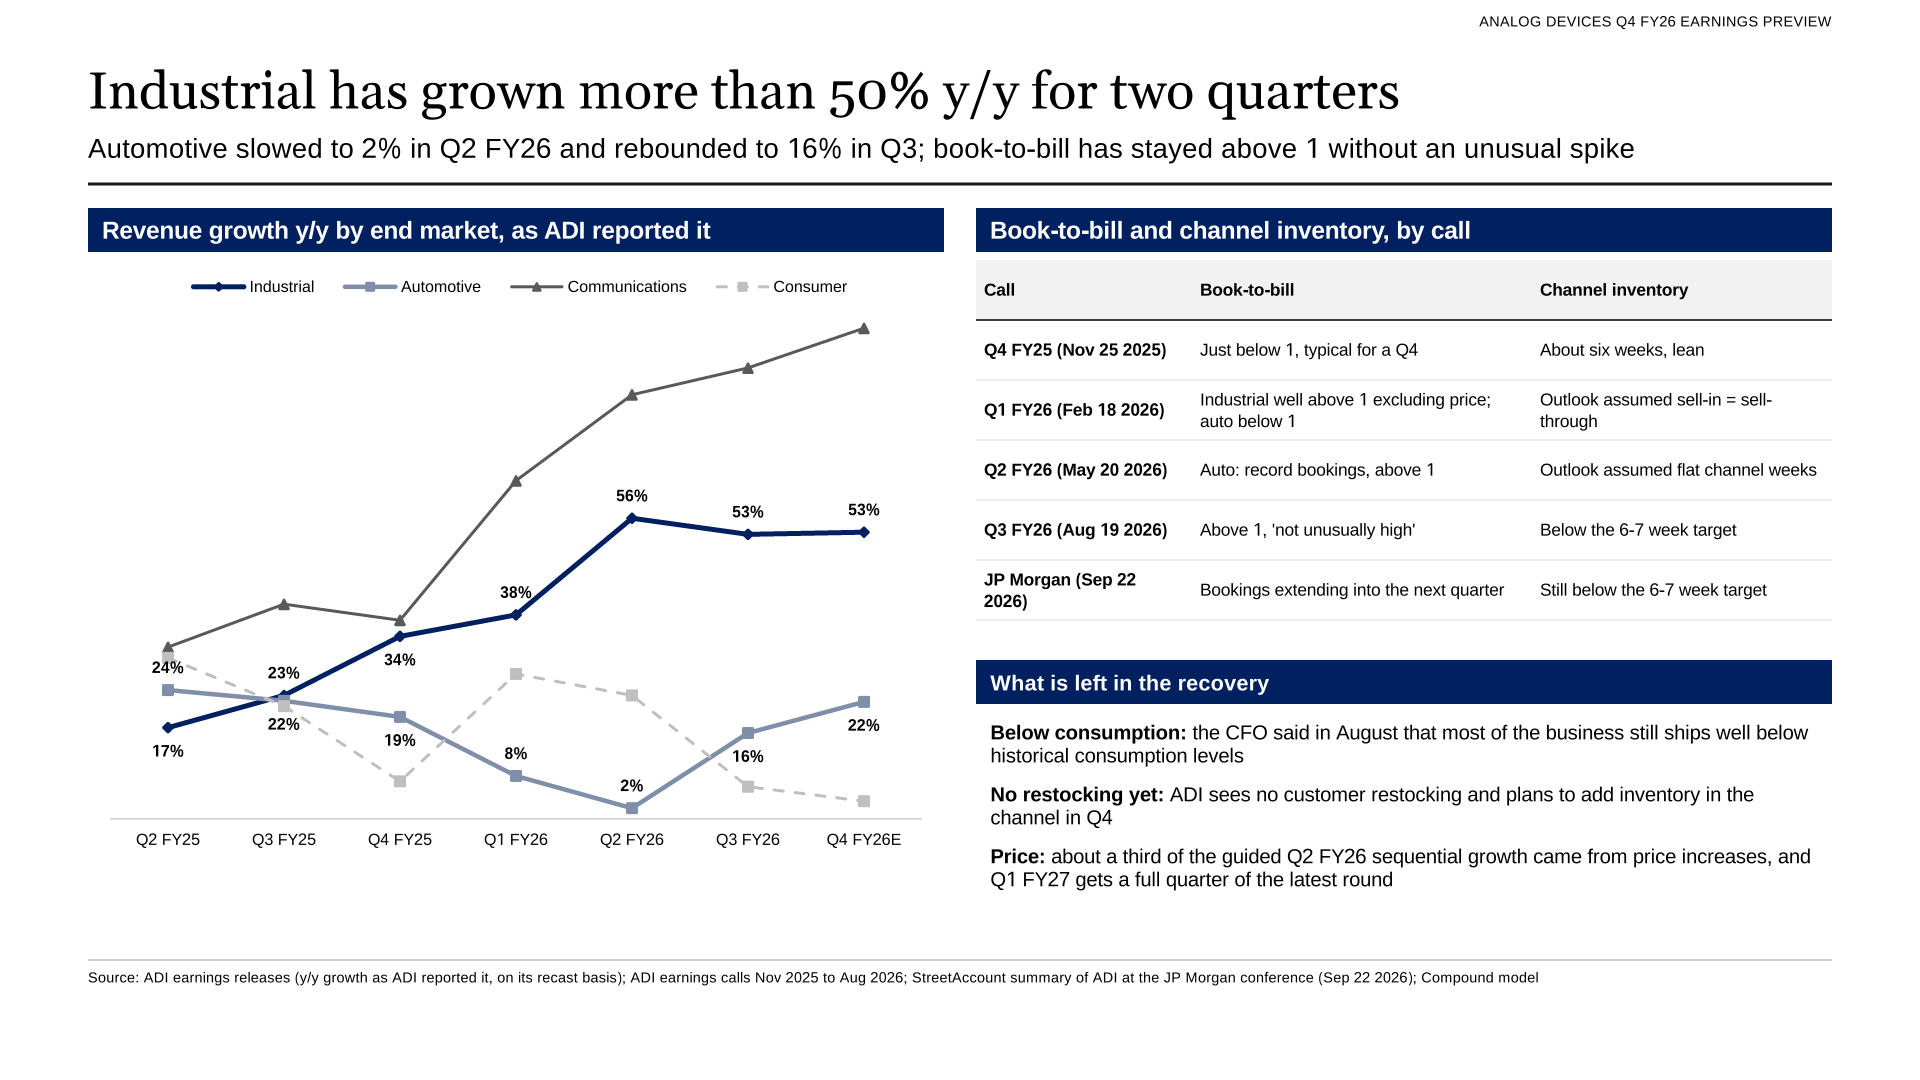
Industrial growth has held above 50% for two quarters; automotive has started to recover.
Gross margin
Adjusted gross margin was 72.5% in the third quarter, down from 73.0% in the second. Puccio said on the August call that ADI expects about 74% in the fourth quarter, up about 150 basis points on mix, higher fixed-cost absorption and price increases. We use 74.2%; the FactSet means imply 74.1%.
The first quarter carries an annual factory shutdown that creates some drag on gross margin, Puccio said, while price increases ADI has already announced will apply to a full quarter of shipments. He said he sees gross margin holding at the fourth-quarter exit level. We model 73.9% for the first quarter.
In the model's sensitivity table, each point of industrial growth moves fourth-quarter EPS by about $0.03, and so does each 0.4 points of gross margin.
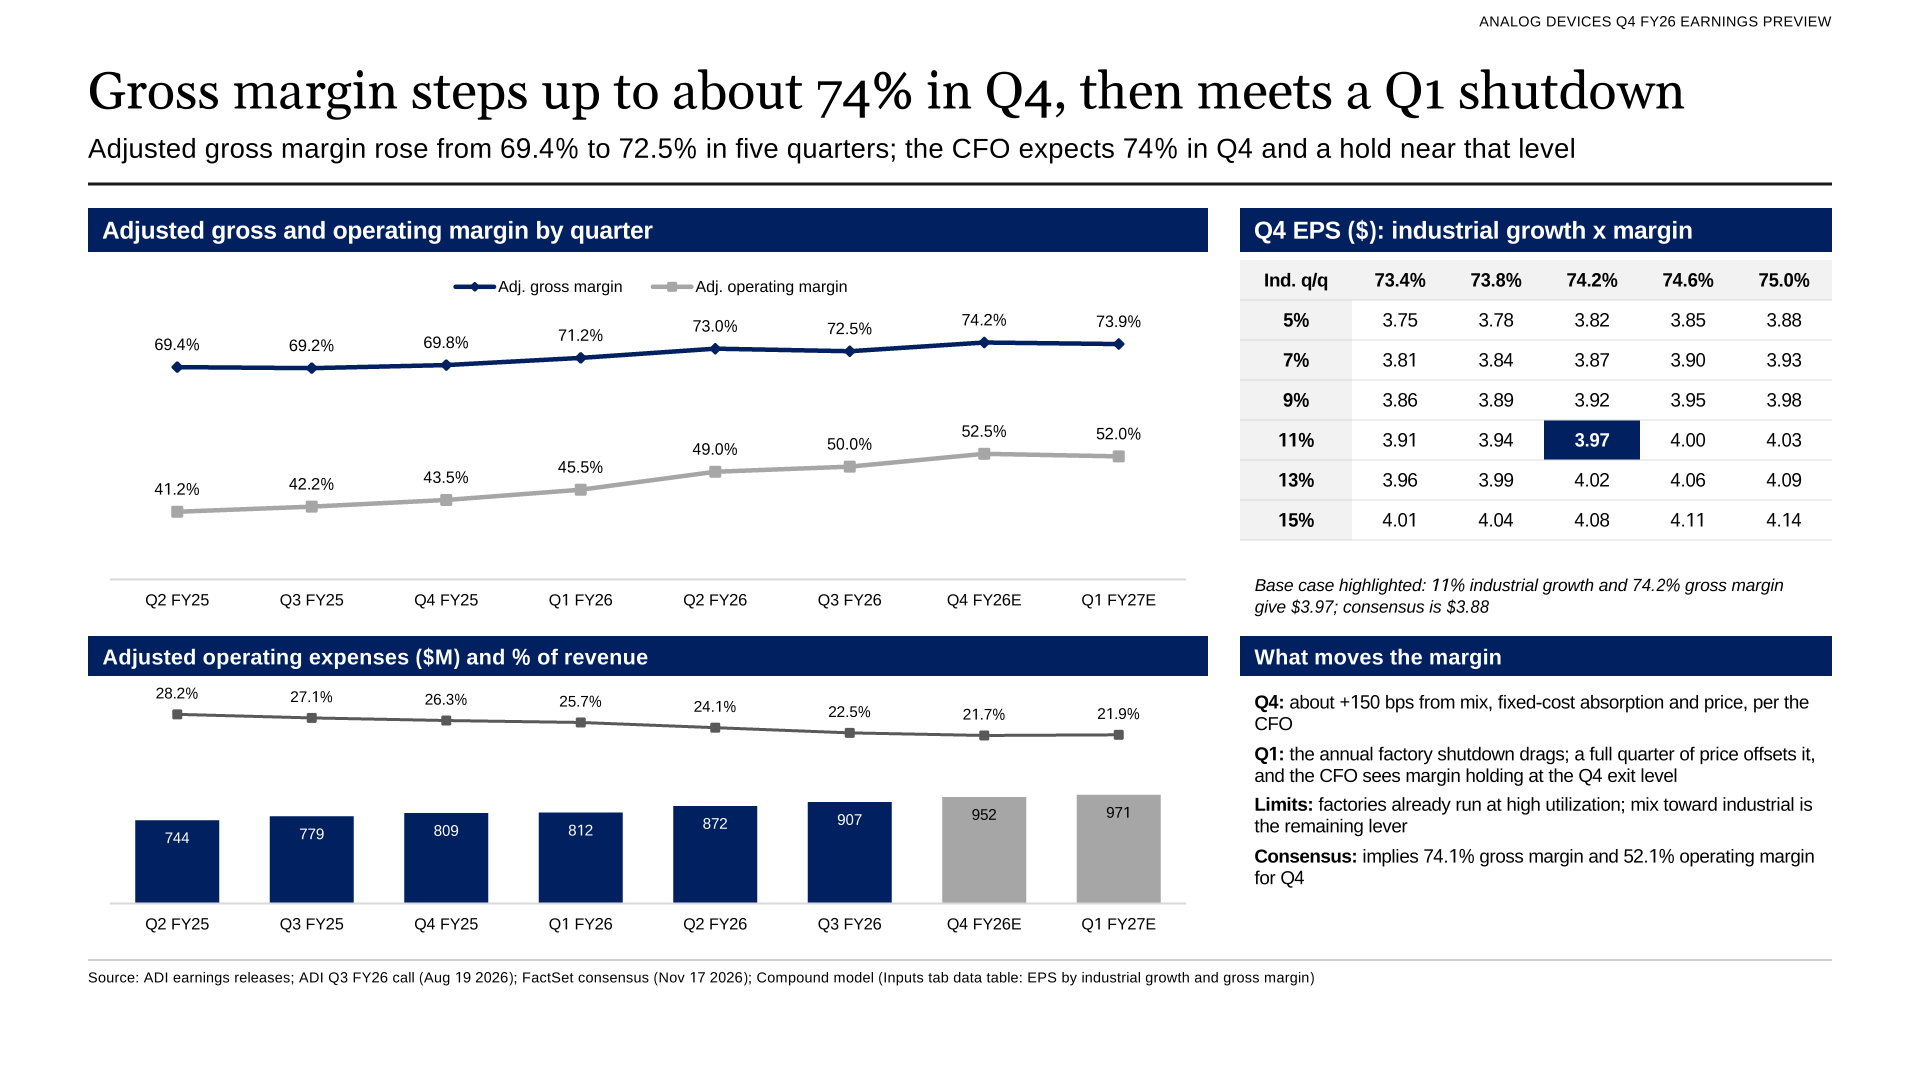
A 75% gross margin with 15% industrial growth would put fourth-quarter EPS at $4.14.
The Q1 guide
The first quarter is ADI's weakest, normally down mid-single digits from the fourth, Puccio said in November 2025. A year ago ADI guided its first quarter up 0.8% and delivered 2.7%. On Compound's reading of ADI's seasonal ranges, its last four guides ran 4.9 to 6.3 points above the normal pattern.
At the JP Morgan conference on Sept. 22, ADI said fiscal first-quarter demand should come in better than normal seasonality and that bookings were extending further into the next quarter, according to a StreetAccount summary.
We expect a first-quarter revenue guide of about $4.4 billion at the midpoint, 1.1% above FactSet's $4.35 billion first-quarter revenue consensus. FactSet's first-quarter EPS mean of $3.87 sits below its fourth-quarter mean of $3.88; we model $3.97.
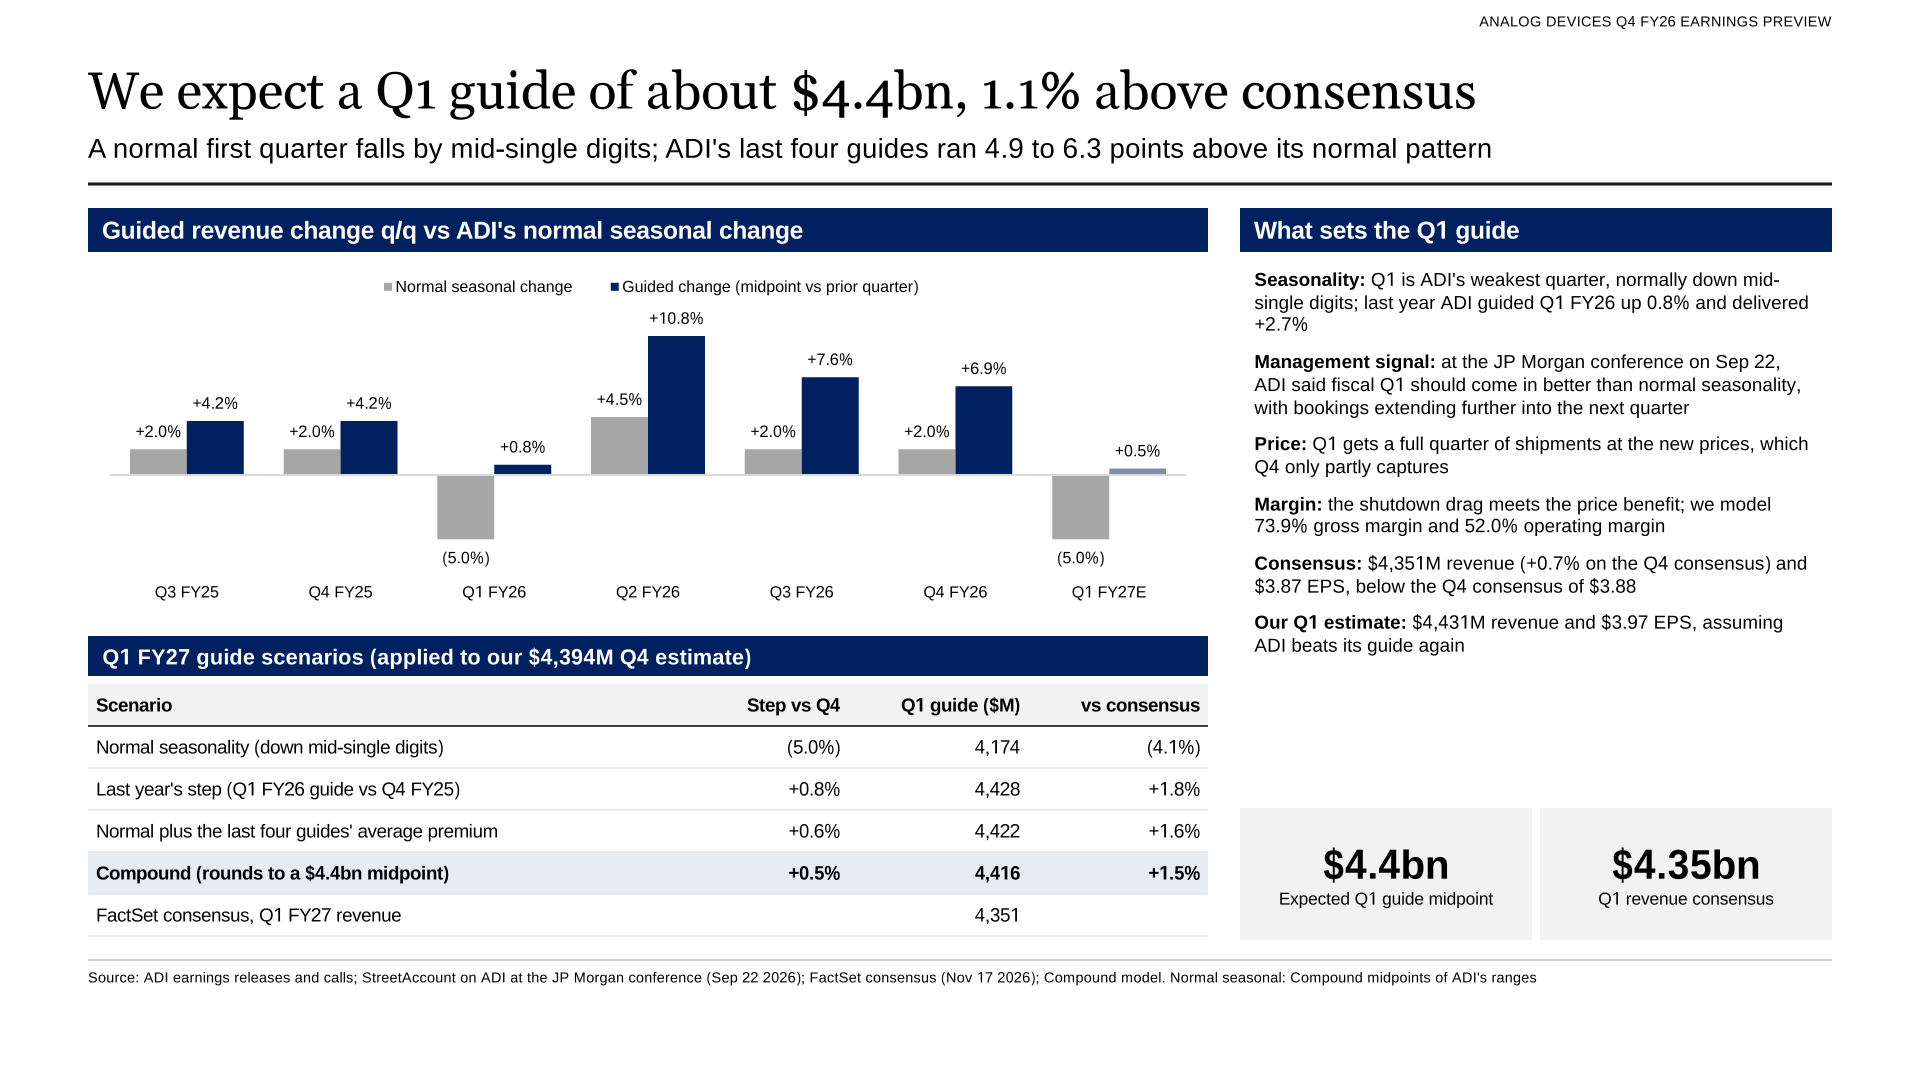
Normal seasonality would put the guide 4.1% below consensus; the last four quarters' premium puts it 1.6% above.
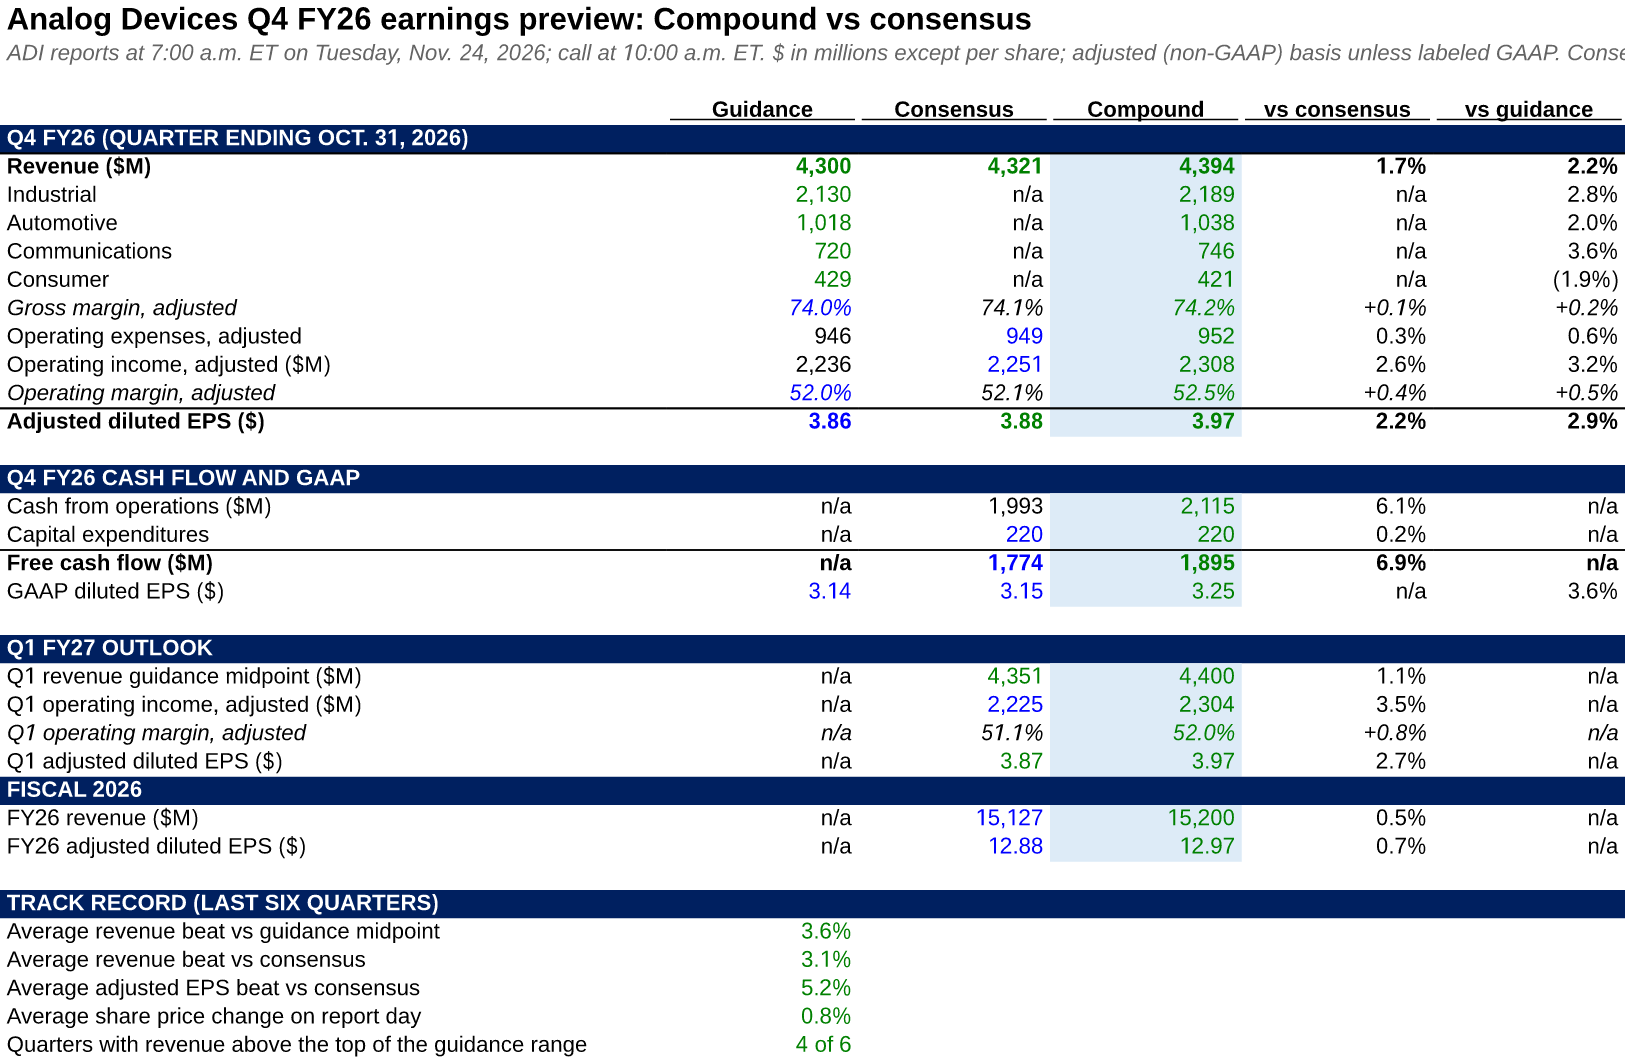
The Preview tab of the Excel model, which links every estimate to its drivers.
Cash flow and deals
We forecast fourth-quarter free cash flow of $1.90 billion against the FactSet mean of $1.77 billion. ADI generated $4.9 billion of free cash flow over the twelve months to August, 36% of revenue, and returned $1.7 billion to shareholders in the third quarter.
ADI paid $1.5 billion in cash for Empower Semiconductor, which closed July 7, and issued $3.0 billion of senior notes on Sept. 17, according to its filings. It completed the $1.35 billion acquisition of Alif Semiconductor on Nov. 3, StreetAccount reported. The fourth-quarter guide for about $80 million of nonoperating expense predates the note issue; we use $85 million.
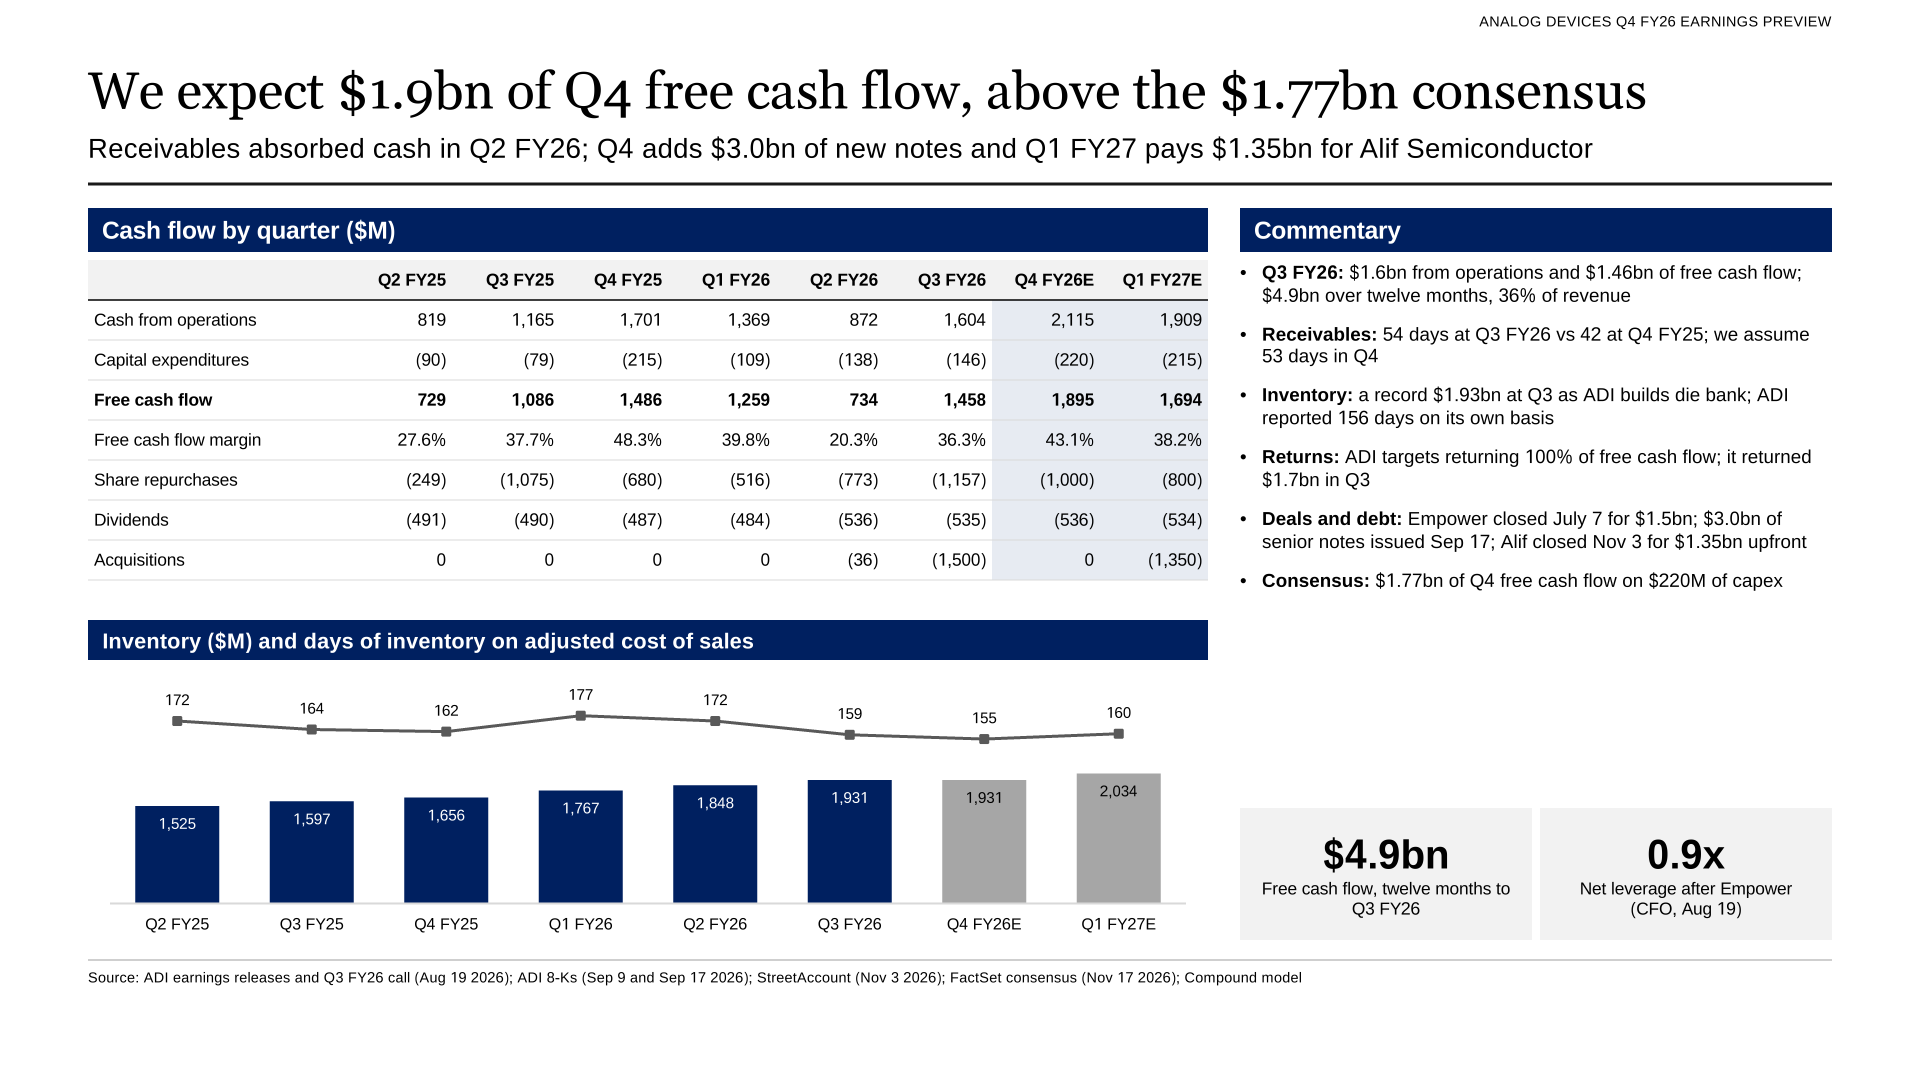
Inventory rose in every quarter of fiscal 2026, and receivables rose $1.0 billion from January to August.
Shares
ADI trades at 22.8 times the FactSet fiscal 2027 EPS mean of $16.83. The FactSet mean price target is $479.76, 25% above the Nov. 17 close. Roth Capital started coverage at buy with a $505 target on Nov. 13, StreetAccount reported.
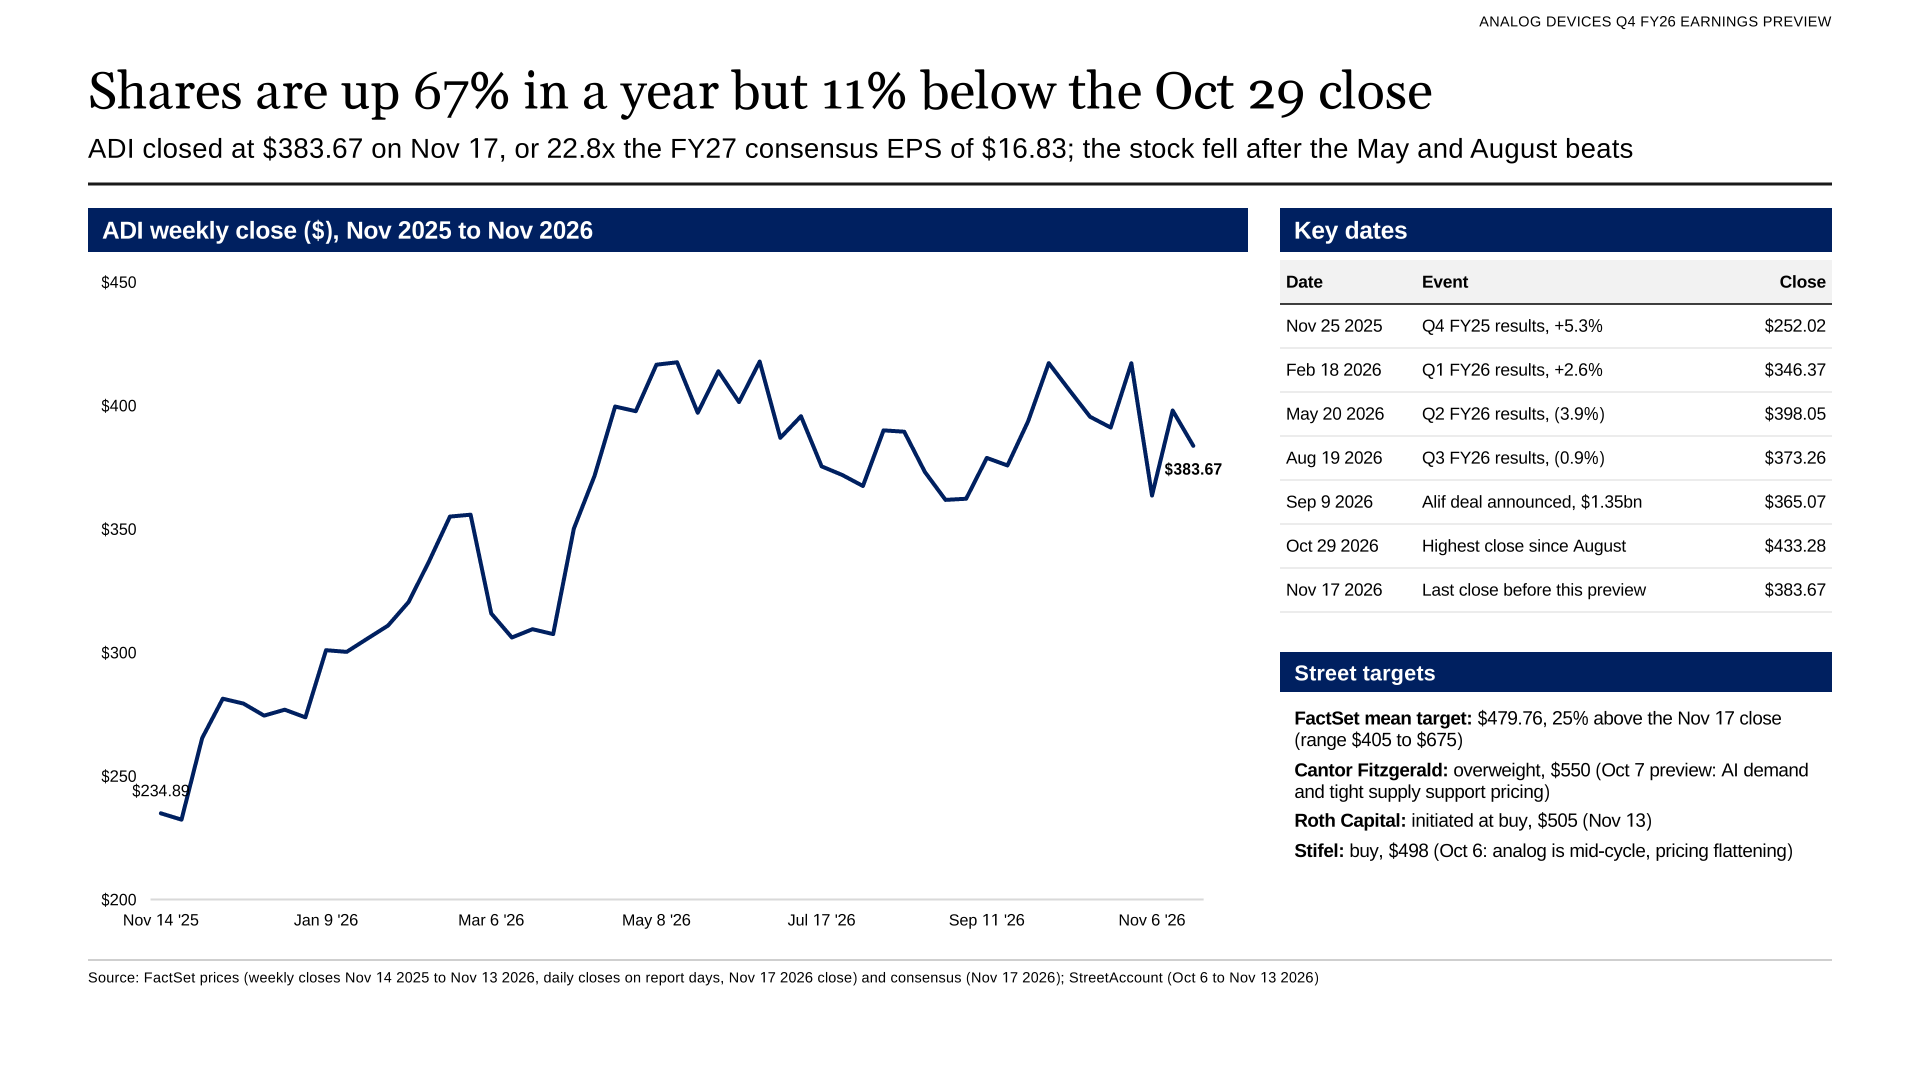
The shares have risen 67% in a year; weekly closes have stayed between $361 and $418 since May.
What to watch on Tuesday
- Revenue above $4.4 billion, the top of the range, which ADI cleared in each of the last two quarters.
- Industrial growth of 10% or more sequentially for a second quarter.
- Gross margin at or above 74%, and what the CFO says about the first-quarter shutdown.
- A first-quarter revenue guide of $4.4 billion or more, against $4.35 billion consensus.
- Book-to-bill above 1, with channel inventory still below six to seven weeks.
- Automotive growth into the first quarter, after a below-seasonal start to fiscal 2026.
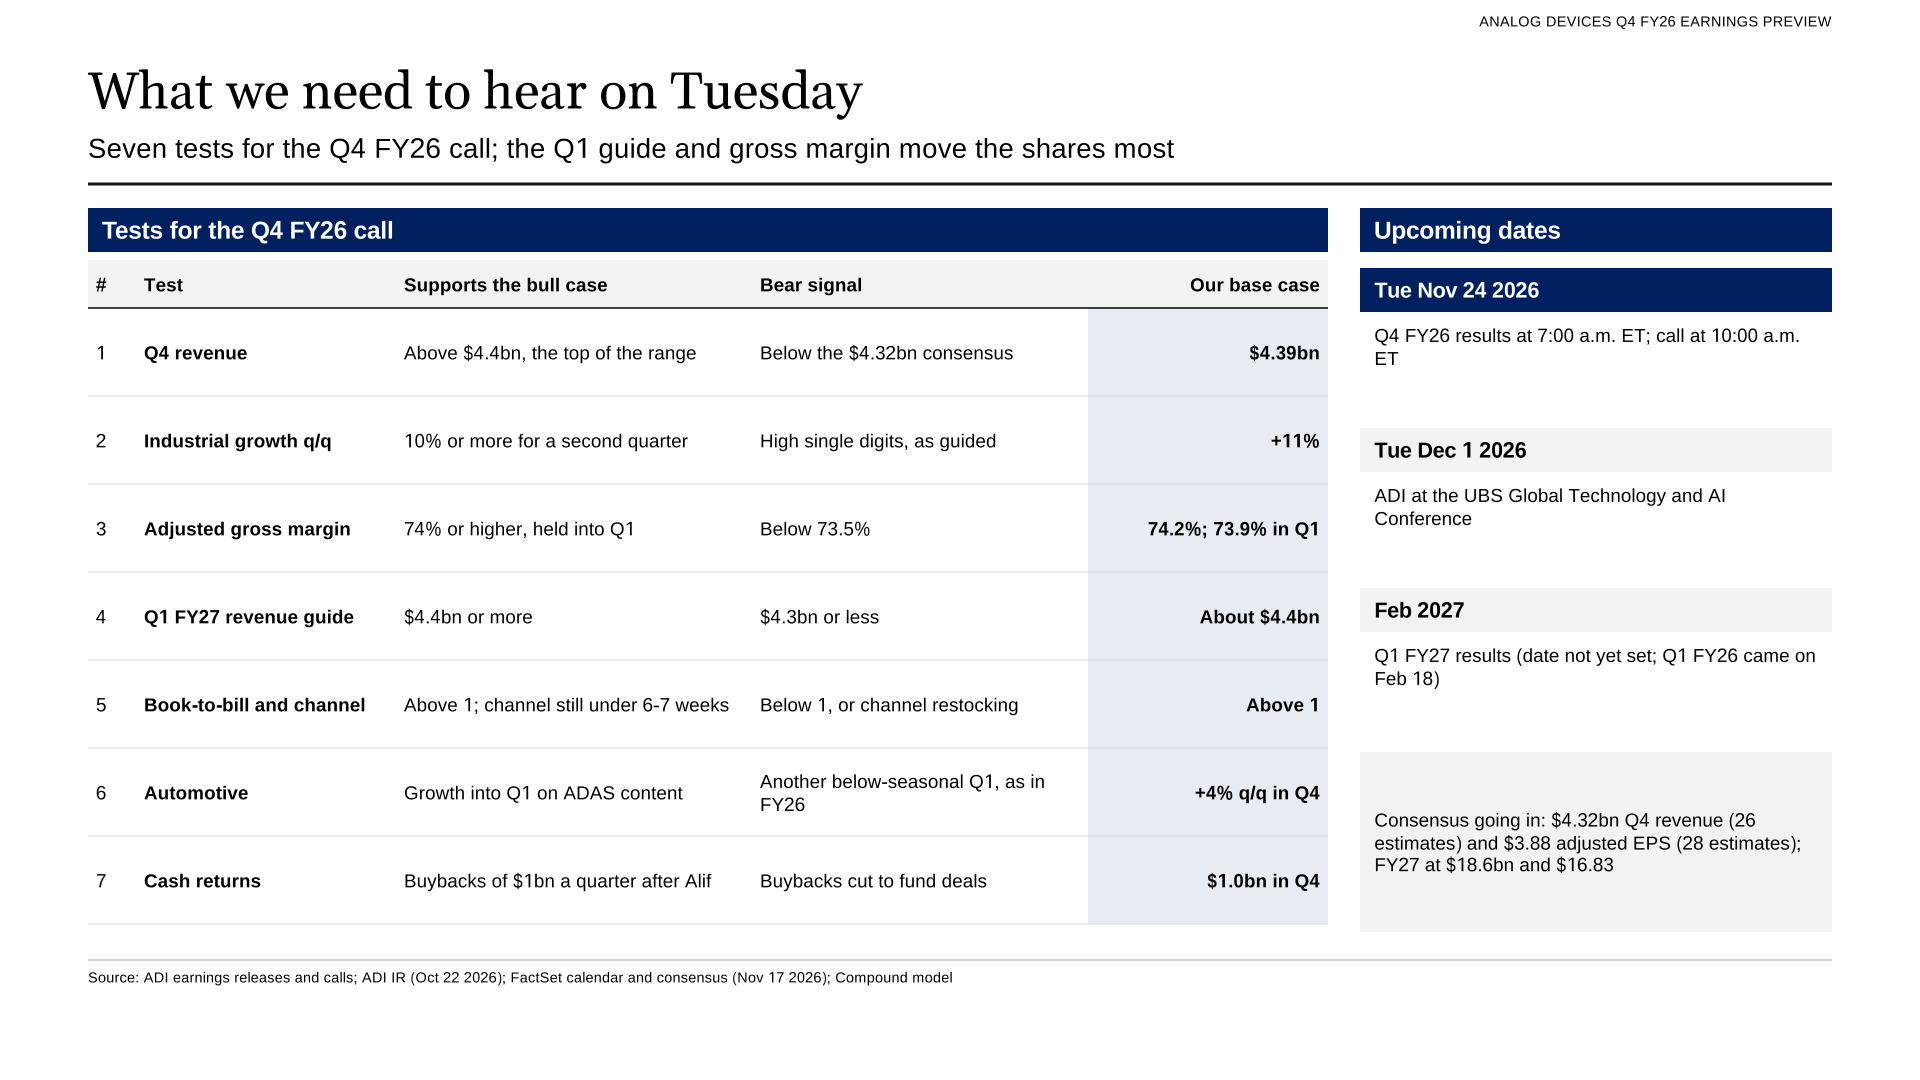
Seven tests for the call, with what would support the bull and bear cases.
ADI presents at the UBS Global Technology and AI Conference on Dec. 1, according to the FactSet calendar. Its fiscal first quarter ends in late January; ADI reported the first quarter of fiscal 2026 on Feb. 18.
 Analog Devices Q4 FY26 earnings preview deck (PowerPoint)The 11-page preview: executive summary, forecast against consensus, track record, end markets, the industrial and auto recovery, margins, the Q1 guide, cash flow, shares and what to watch.Download · Free
 Analog Devices Q4 FY26 earnings preview deck (PDF)The same 11 pages as a PDF.Download · Free
 Analog Devices Q4 FY26 earnings model (Excel)Quarterly model from Q2 FY25: revenue by end market, adjusted and GAAP earnings, cash flow, balance sheet and working capital, guidance and consensus track record, inputs with native Excel sensitivity tables, and an end-market and seasonality tab.Download · Free
More from Compound News

Snowflake Q3 Earnings Preview: $0.69 EPS vs $0.60 Consensus
Snowflake reports Wednesday after the close. Our model puts product revenue 3.5% above the guidance midpoint and EPS at $0.69 against a $0.60 consensus. Remaining performance obligations have fallen for two quarters.
Read article →
Salesforce Q3 Earnings Preview: $3.51 EPS vs $3.45 Consensus
Salesforce reports Wednesday, Dec. 2, after the close. Our model puts third-quarter revenue at $11.50 billion, 0.3% above consensus, and non-GAAP EPS at $3.51 against $3.45. We expect the fourth-quarter revenue guide to land about 1.3% below the Street.
Read article →
Marvell Q3 Earnings Preview: $1.11 EPS vs $1.10 Consensus
Marvell reports Tuesday, Dec. 1, after pre-announcing Q3 revenue at its $3.15 billion guidance midpoint. Our model puts EPS at $1.11 against $1.10 and the Q4 revenue guide at about $3.75 billion. The stock is down 40.9% since Oct. 28.
Read article →