Best Buy Q3 Earnings Preview: $1.52 EPS vs $1.49 Consensus
Best Buy reports Tuesday before the open. Our model has third-quarter comparable sales up 2.6%, inside the 1% to 3% guide, and adjusted EPS of $1.52 against a $1.49 consensus, and we expect the full-year EPS range to rise to about $6.80 to $6.95.

Best Buy reports fiscal third-quarter results on Tuesday, Nov. 24, before the market opens. FactSet's events calendar lists the release at about 7:00 a.m. ET, and Best Buy's investor relations site shows the call at 8:00 a.m. ET. The quarter ended Oct. 31.
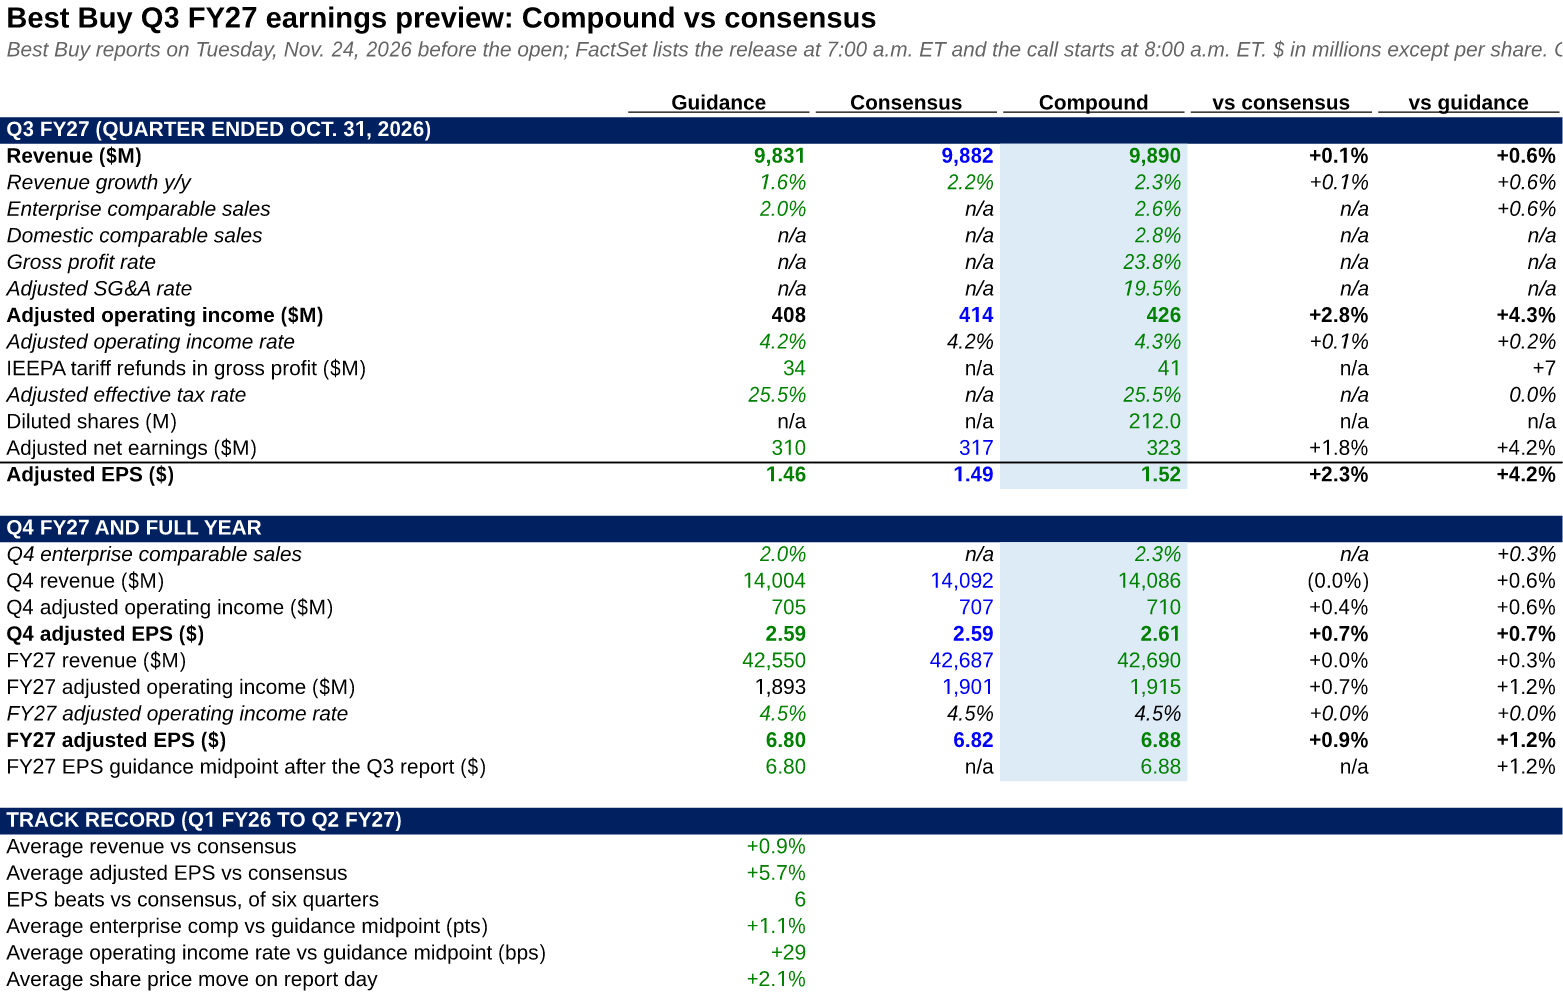
Compound's model forecasts adjusted EPS of $1.52, 2.3% above the FactSet consensus of $1.49. We forecast enterprise comparable sales up 2.6%, against guidance of 1% to 3%, and revenue of $9.89 billion, in line with the $9.88 billion consensus.
Best Buy shares closed at $98.40 on Nov. 17, up 47% this year and 18% since the second-quarter report on Aug. 27, according to FactSet. The stock closed at a one-year high of $106.28 on Nov. 9, Trefis reported.
Forecast vs consensus
| Q3 FY27 | Guidance | Consensus | Compound | Difference |
|---|---|---|---|---|
| Revenue ($M) | n/a | 9,882 | 9,890 | +0.1% |
| Enterprise comparable sales | +1% to +3% | n/a | +2.6% | n/a |
| Adjusted operating income ($M) | n/a | 414 | 426 | +2.8% |
| Adjusted operating rate | 4.1% to 4.2% | 4.2% | 4.3% | +0.1 pt |
| Adjusted EPS ($) | n/a | 1.49 | 1.52 | +2.3% |
| Q4 adjusted EPS ($) | n/a | 2.59 | 2.61 | +0.7% |
| FY27 adjusted EPS ($) | 6.70 to 6.90 | 6.82 | 6.88 | +0.9% |
Consensus is the FactSet mean as of Nov. 17; FactSet carries no consensus for comparable sales, and Best Buy does not guide quarterly EPS. Best Buy calls the year ending Jan. 30, 2027, fiscal 2027.
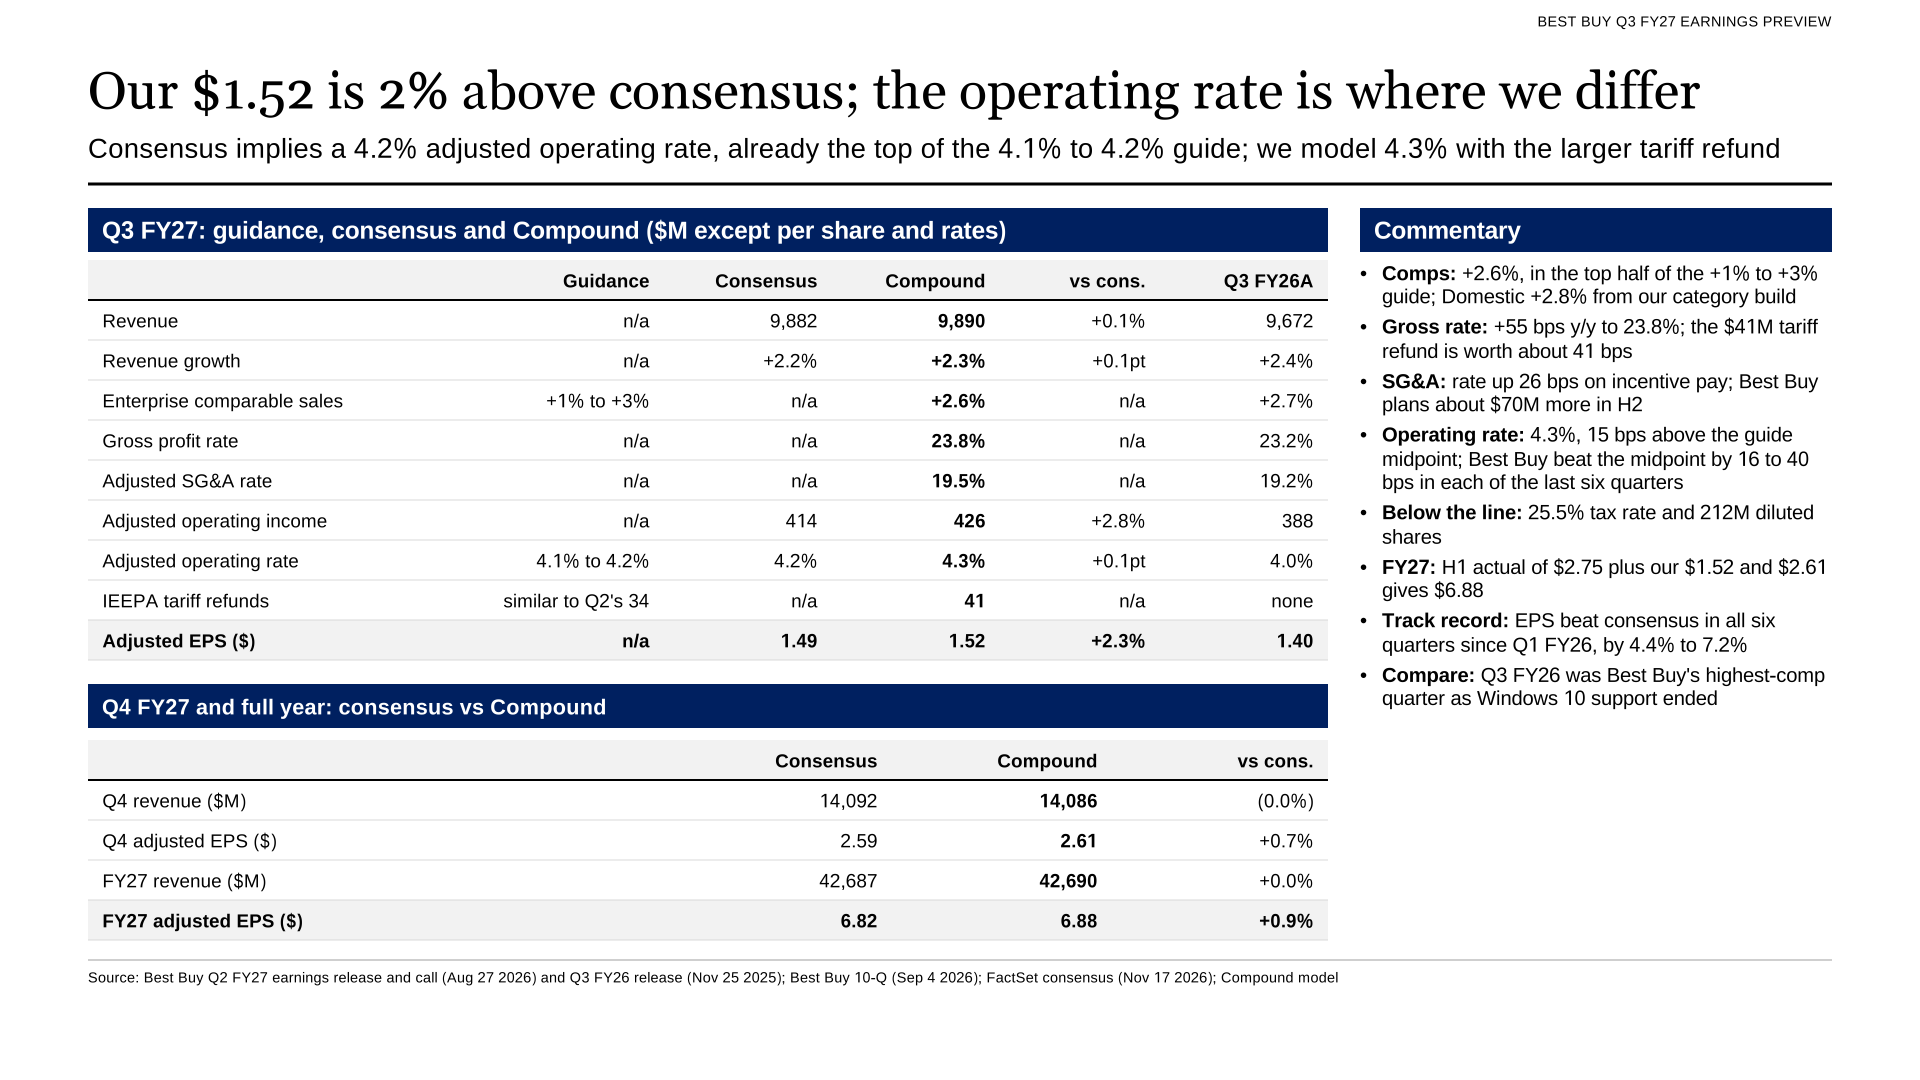
Our $1.52 is 2% above consensus; the operating rate is where we differ. Slide 3 of the Compound deck.
How we built the forecast
The model builds Domestic comparable sales from Best Buy's six revenue categories, weighted by last year's third-quarter sales. Best Buy recast those categories in May, moving credit card and digital content revenue into services, according to an exhibit to its May 28 filing.
Best Buy's comparable sales rose 4.1% in the second quarter against guidance of about 1%. Corie Barry, then chief executive, said on the Aug. 27 call that May comped up 8% and July was about flat, and that August month-to-date comps sat at the high end of the 1% to 3% third-quarter guide.
We assume consumer electronics up 6%, after 5.6% in the second quarter, when Best Buy said domestic TV sales grew more than 10%. Services rise 6%. Computing and mobile phones rise 2% against a 7.6% gain a year earlier, when the end of Windows 10 support lifted demand. Entertainment falls 5% as gaming laps the Switch 2 cycle. That gives a Domestic comp of 2.8% and an enterprise comp of 2.6%.
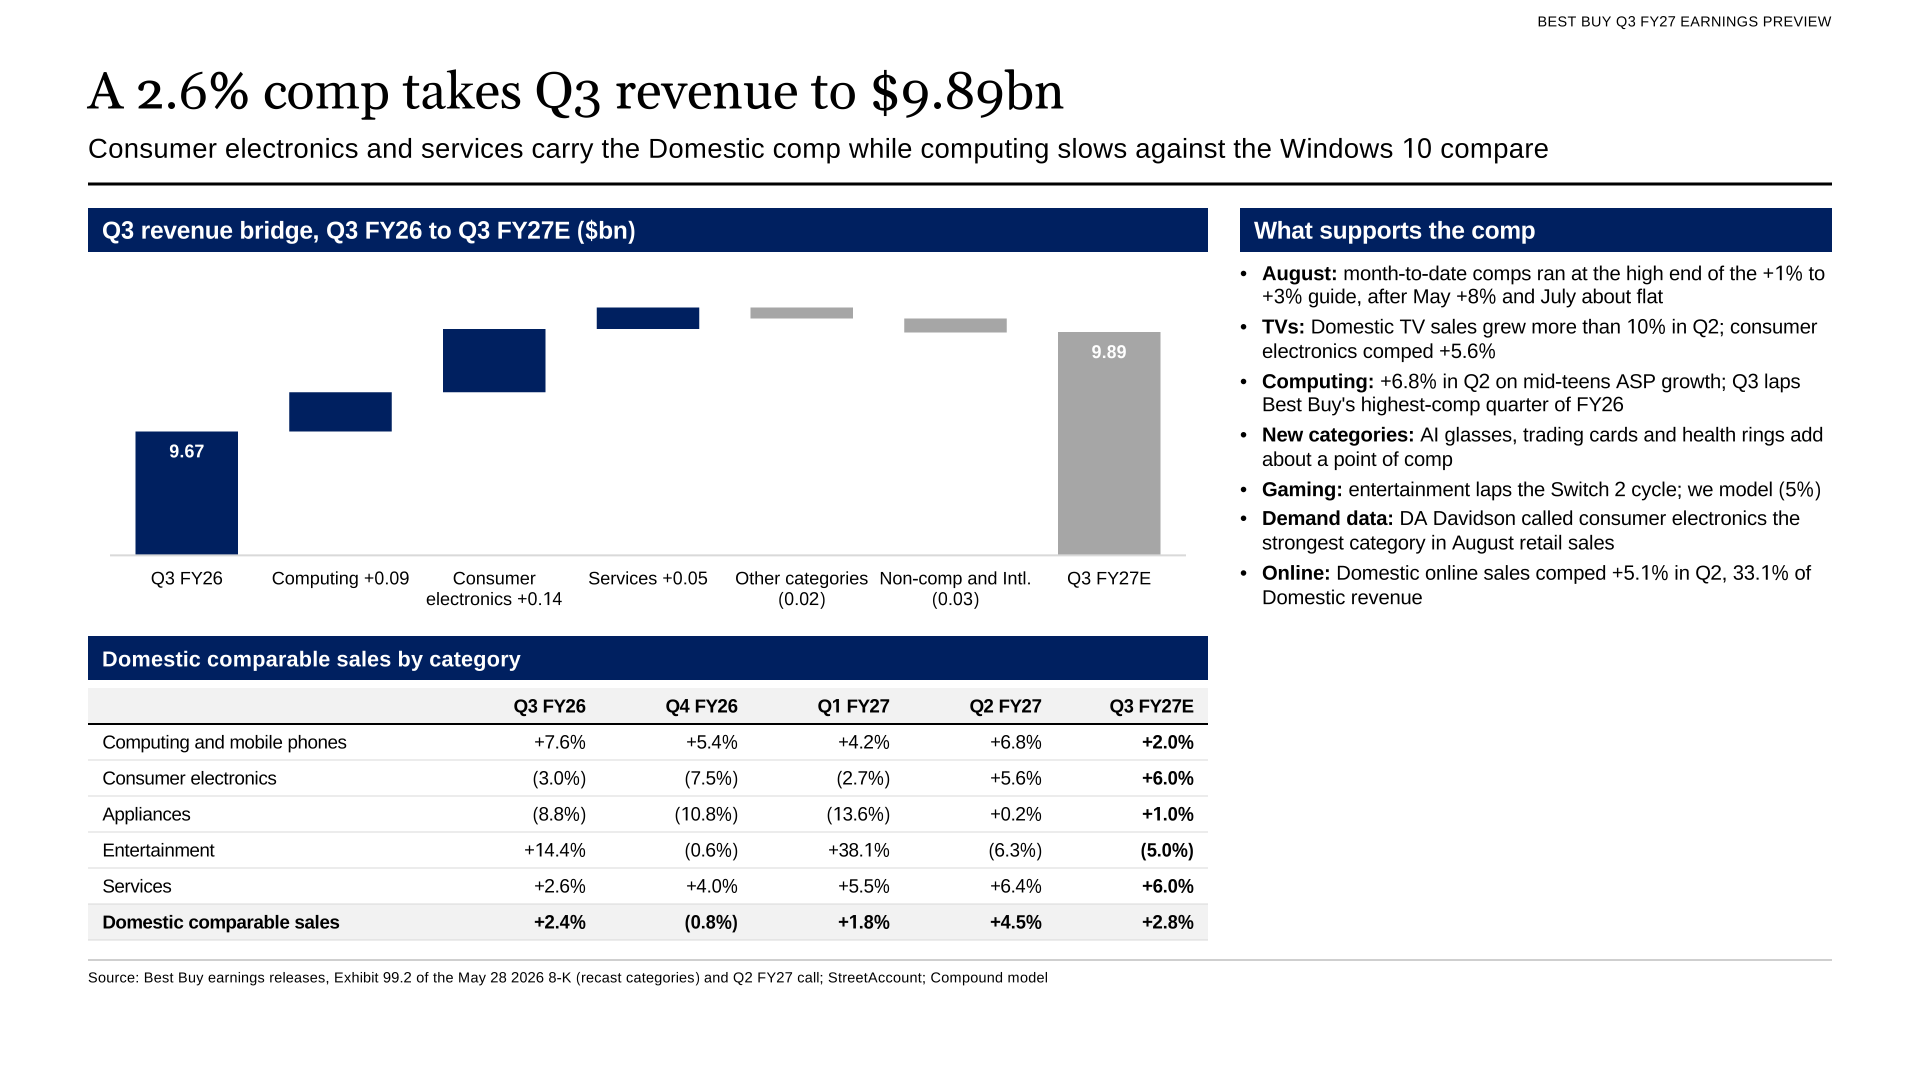
A 2.6% comp takes Q3 revenue to $9.89 billion. Slide 5.
Memory-driven PC prices
Rising memory costs are pushing up computer prices. Best Buy said computing average selling prices rose by a mid-teens percentage in the second quarter while units fell by a high single digit. Gartner estimated in February that memory costs would lift PC prices 17% in 2026, and IDC forecast in June that PC shipments would fall 20% year over year in the fourth quarter.
Management called the effect specific to computing and said unit sales held up a little better than it expected. Best Buy also bought computing inventory early where it saw price increases coming. On our model, each point of computing comp moves third-quarter EPS by about $0.006.
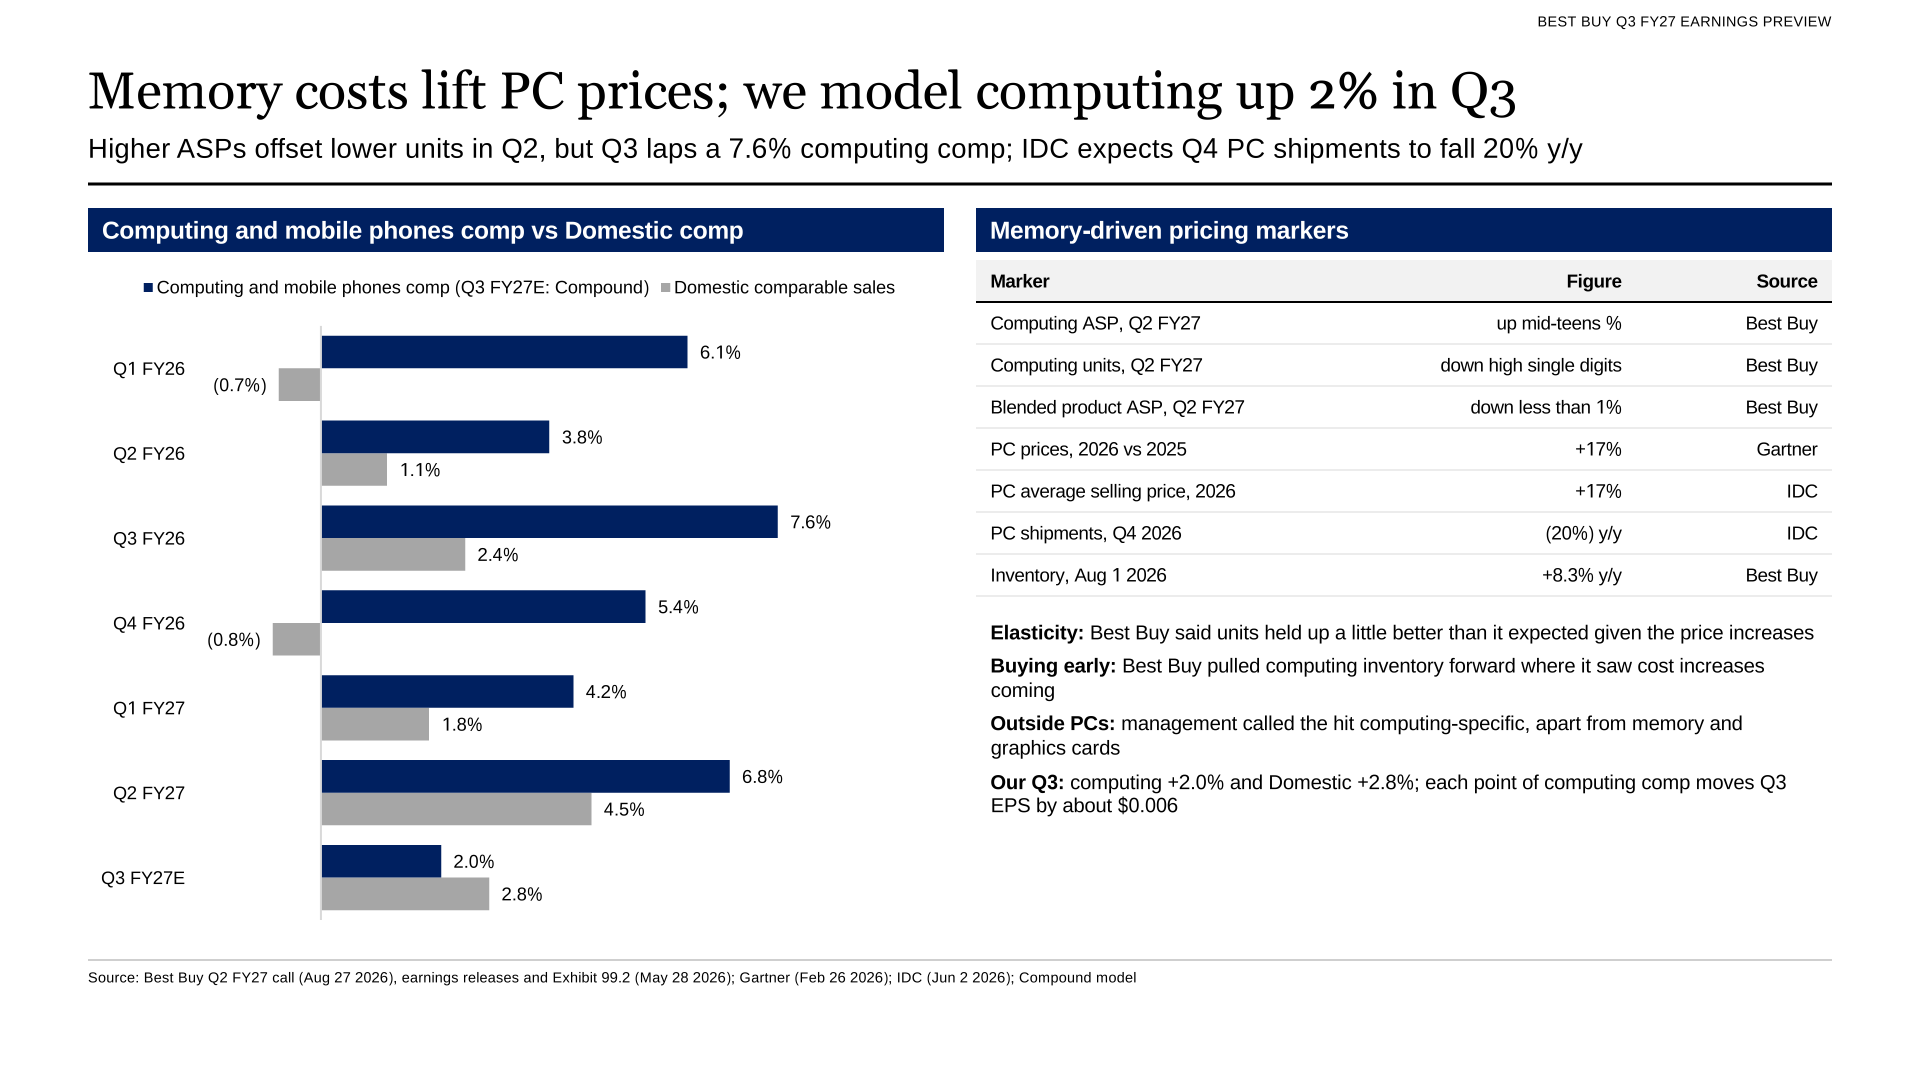
Memory costs lift PC prices; we model computing up 2% in Q3. Slide 6.
Margins and tariff refunds
We put the adjusted operating rate at 4.3%, up 29 basis points from 4.0% a year earlier and above the 4.1% to 4.2% guide; consensus implies 4.2%. In Domestic, Best Buy Ads and Marketplace add 30 basis points of gross margin and tariff refunds about 45, while product margins and price investments take back 20. SG&A rises 25 basis points of revenue as incentive pay climbs; Best Buy plans about $70 million more incentive compensation in the second half.
Best Buy received about $34 million of refunds of tariffs paid under the International Emergency Economic Powers Act in the second quarter and $41 million more on Sept. 2, which it will book in the third quarter, its 10-Q says. Its third-quarter plan assumed refunds similar to the second quarter's. Best Buy said in May that it is the importer of record for only 2% to 3% of what it sells and that any recovered duties would go back to customers as value.
The Supreme Court struck down the IEEPA tariffs on Feb. 20, and a temporary 10% tariff under Section 122 replaced them, Covington reported. The Tax Policy Center said computers and electronics would still face Section 232 and 301 duties once that tariff lapsed.
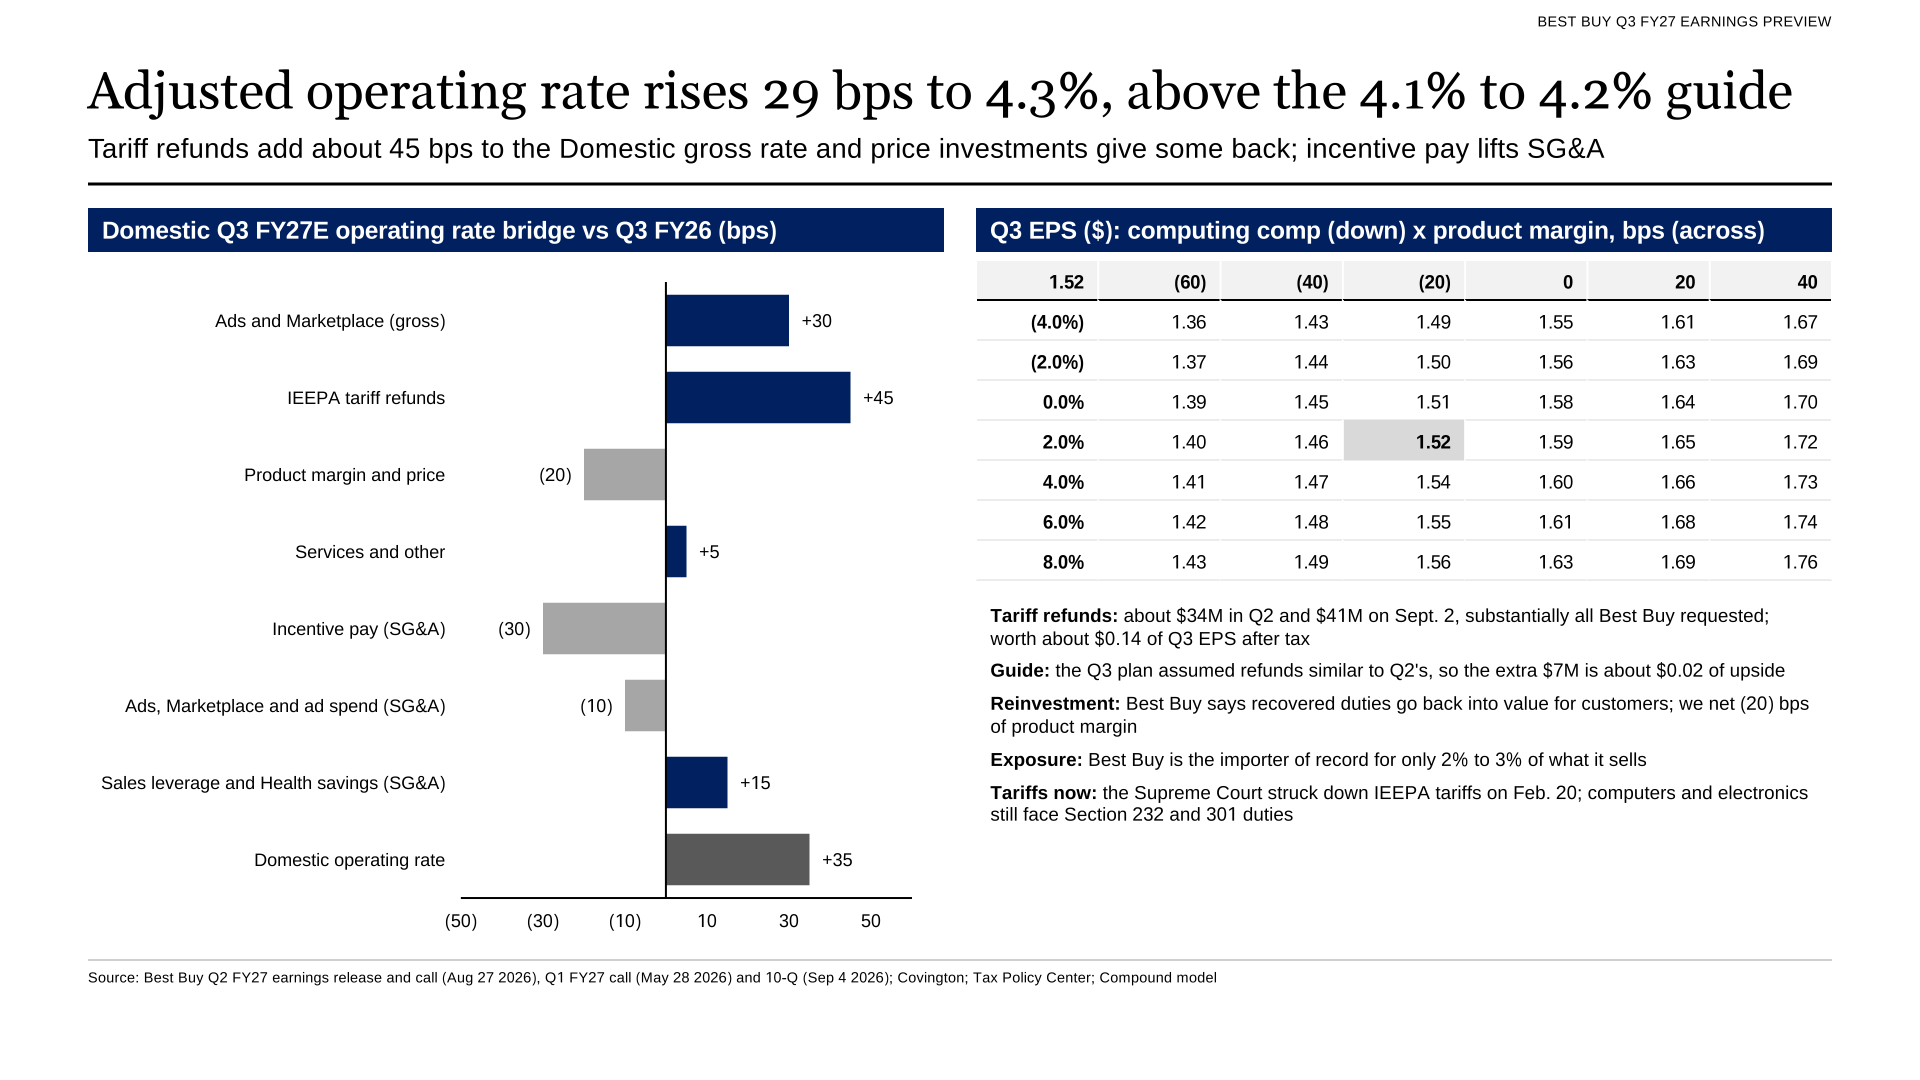
The adjusted operating rate rises 29 basis points to 4.3%, above the guide. Slide 7.
Track record
Best Buy beat the FactSet EPS consensus in each of the last six quarters, by 5.7% on average, and its adjusted operating rate beat the midpoint of its quarterly guide every time, by 29 basis points on average. Revenue beat consensus in four of the six. The shares fell on three of those report days, including a 4.4% drop on Aug. 27.
Our forecast is a 2.3% beat, below that average, because consensus already sits at the top of the margin guide. StreetAccount put third-quarter EPS consensus at $1.47 after the second-quarter report; FactSet has it at $1.49 now.
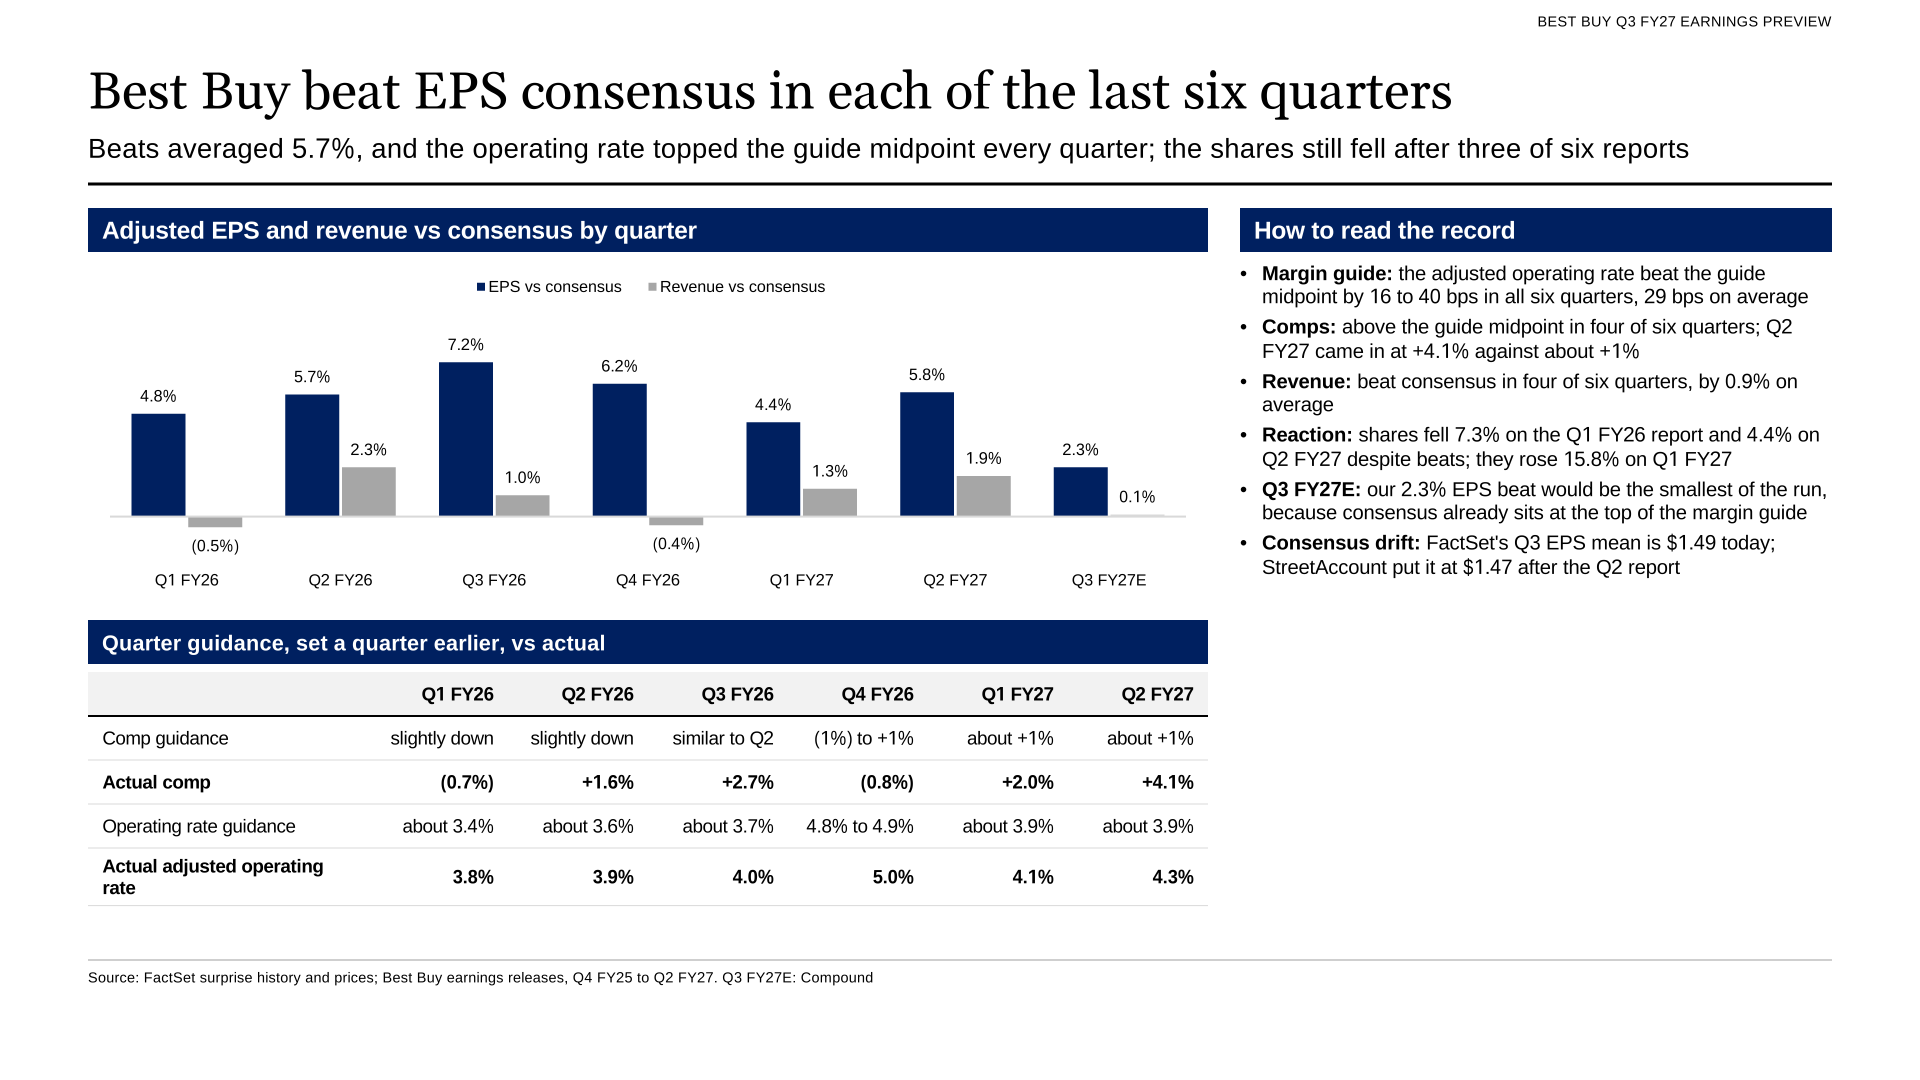
Best Buy beat EPS consensus in each of the last six quarters. Slide 4.
Holiday-quarter guidance
In August Best Buy raised its fiscal 2027 adjusted EPS range to $6.70 to $6.90 from $6.30 to $6.60, and guided comparable sales of 1.9% to 3.0% for the year and 1% to 3% for the second half. First-half adjusted EPS was $2.75. At the midpoint, and with a third quarter in the middle of Best Buy's guidance, the range implies about $2.59 for the fourth quarter, matching the $2.59 consensus.
We expect Best Buy to raise the range to about $6.80 to $6.95, on our third-quarter estimate and a fourth-quarter range of $2.53 to $2.68. Best Buy expects Grand Theft Auto VI to help the gaming category in the fourth quarter; we model entertainment up 10% and computing flat. Our full-year estimate is $6.88. The 10-Q says the September payment covers substantially all the refunds Best Buy requested, so we assume none in the fourth quarter.
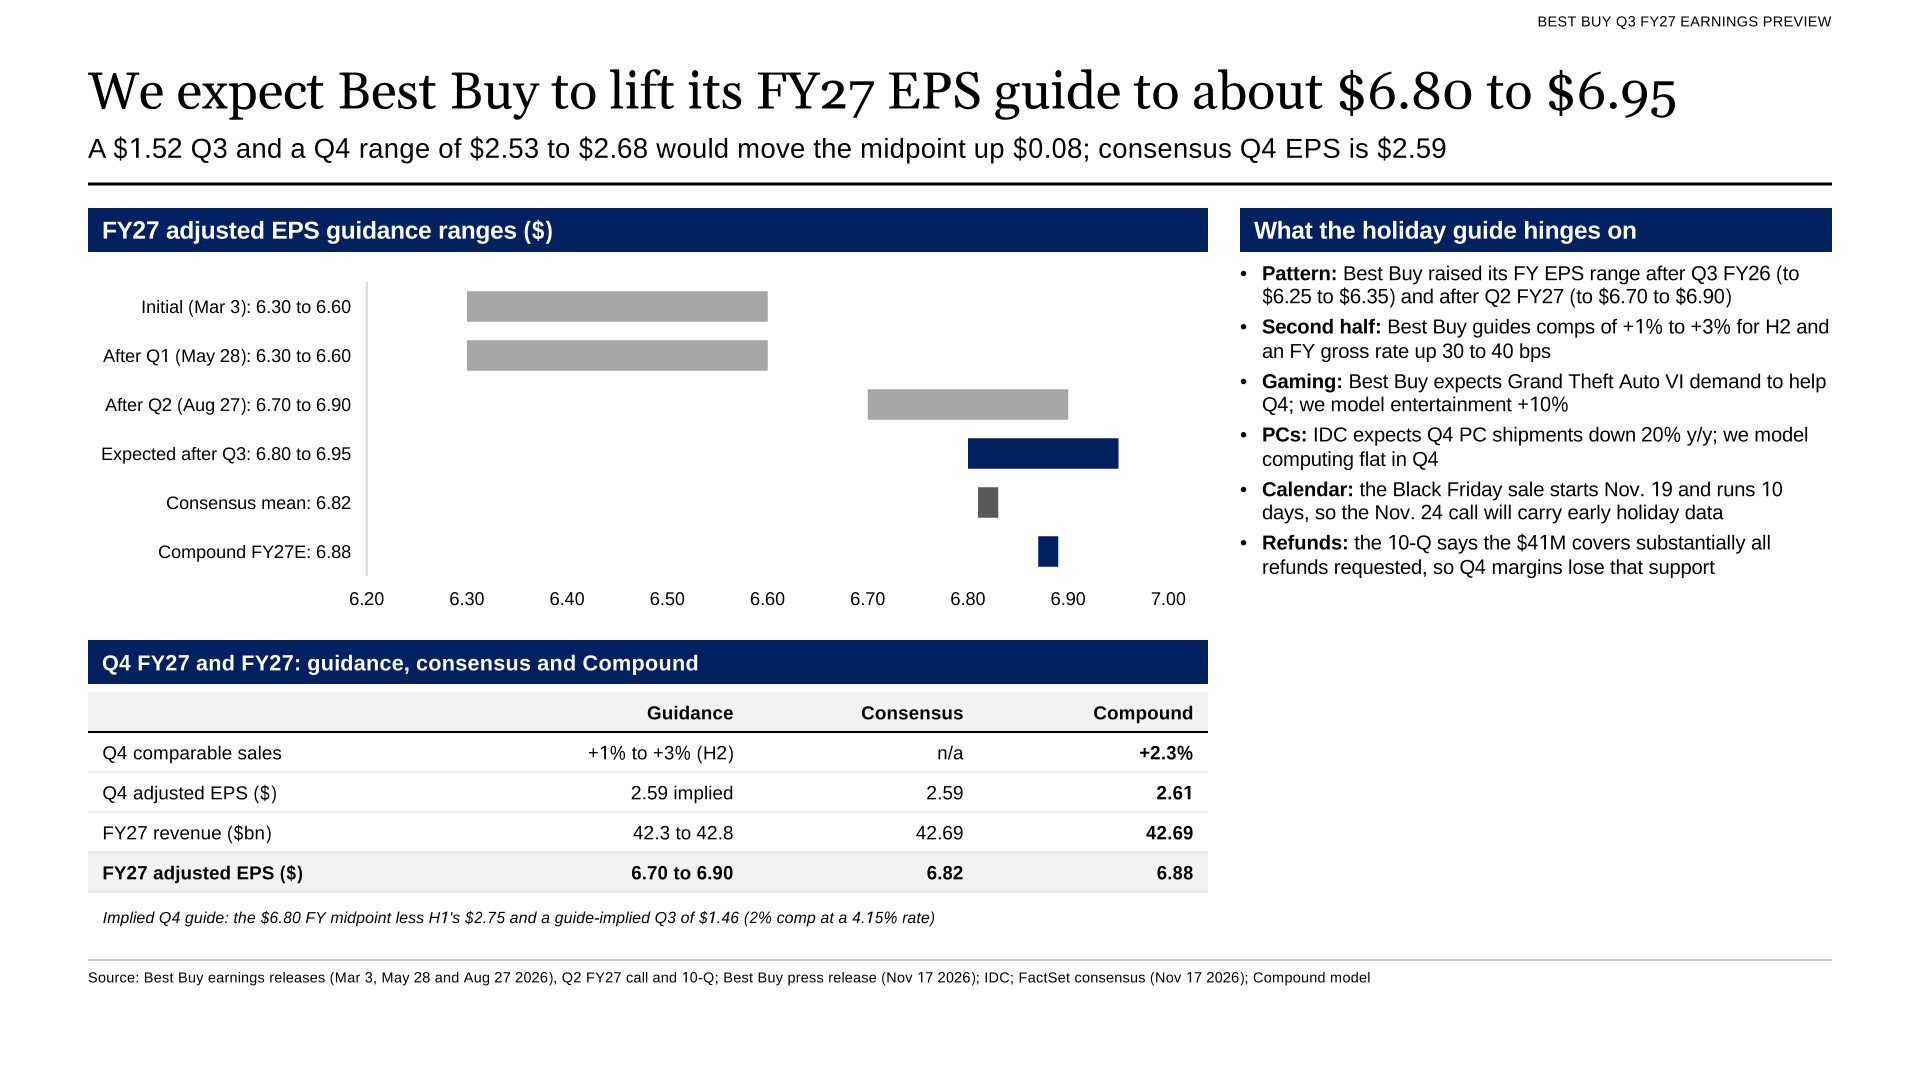
We expect Best Buy to lift its FY27 EPS guide to about $6.80 to $6.95. Slide 8.
Inventory and cash
Inventory was up 8.3% from a year earlier at the end of the second quarter, mostly in computing, where Best Buy bought ahead of expected price increases. The third quarter is the inventory-build quarter: a year ago inventory rose $2.2 billion and the free cash outflow was $287 million. We model an outflow of $248 million.
Best Buy ended the second quarter with $2.26 billion of cash and $1.17 billion of debt. It plans about $300 million of buybacks in fiscal 2027 and had repurchased $36 million through the first half.
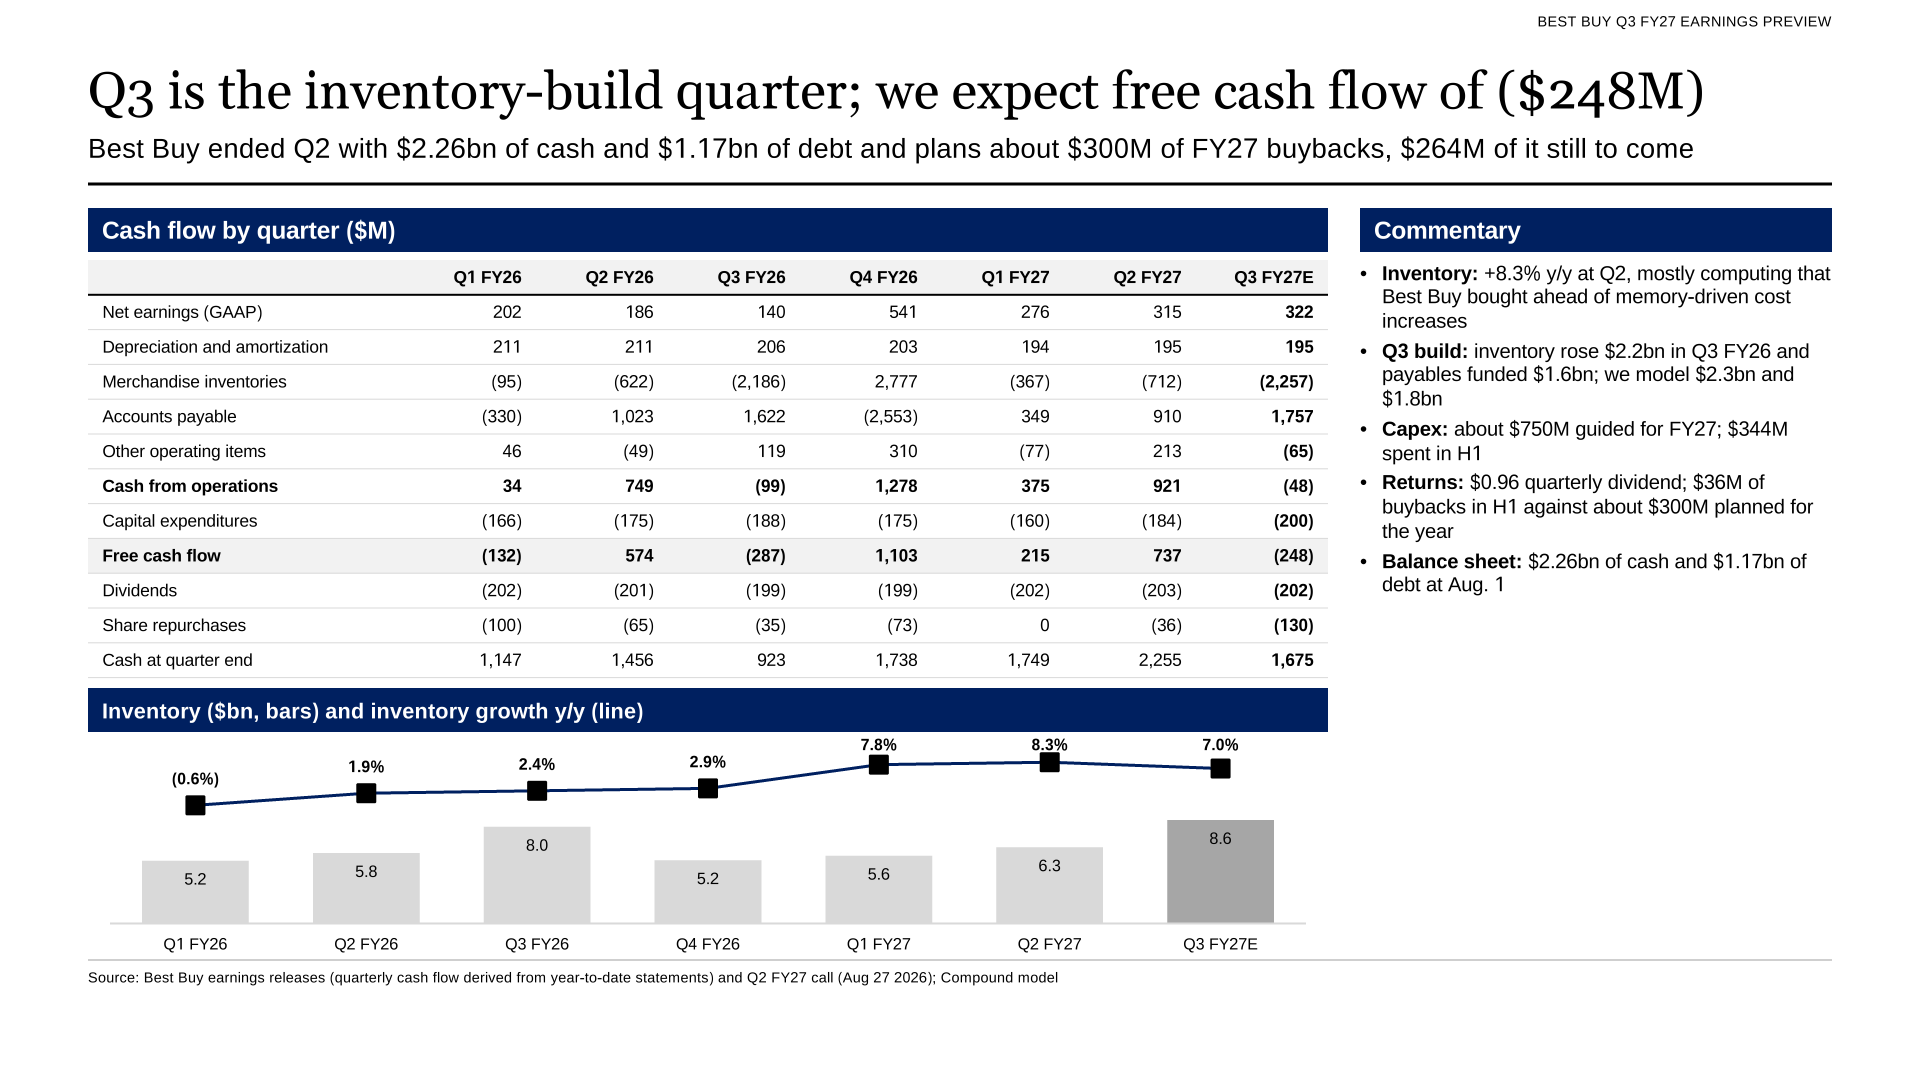
Q3 is the inventory-build quarter; we expect a free cash outflow of $248 million. Slide 9.
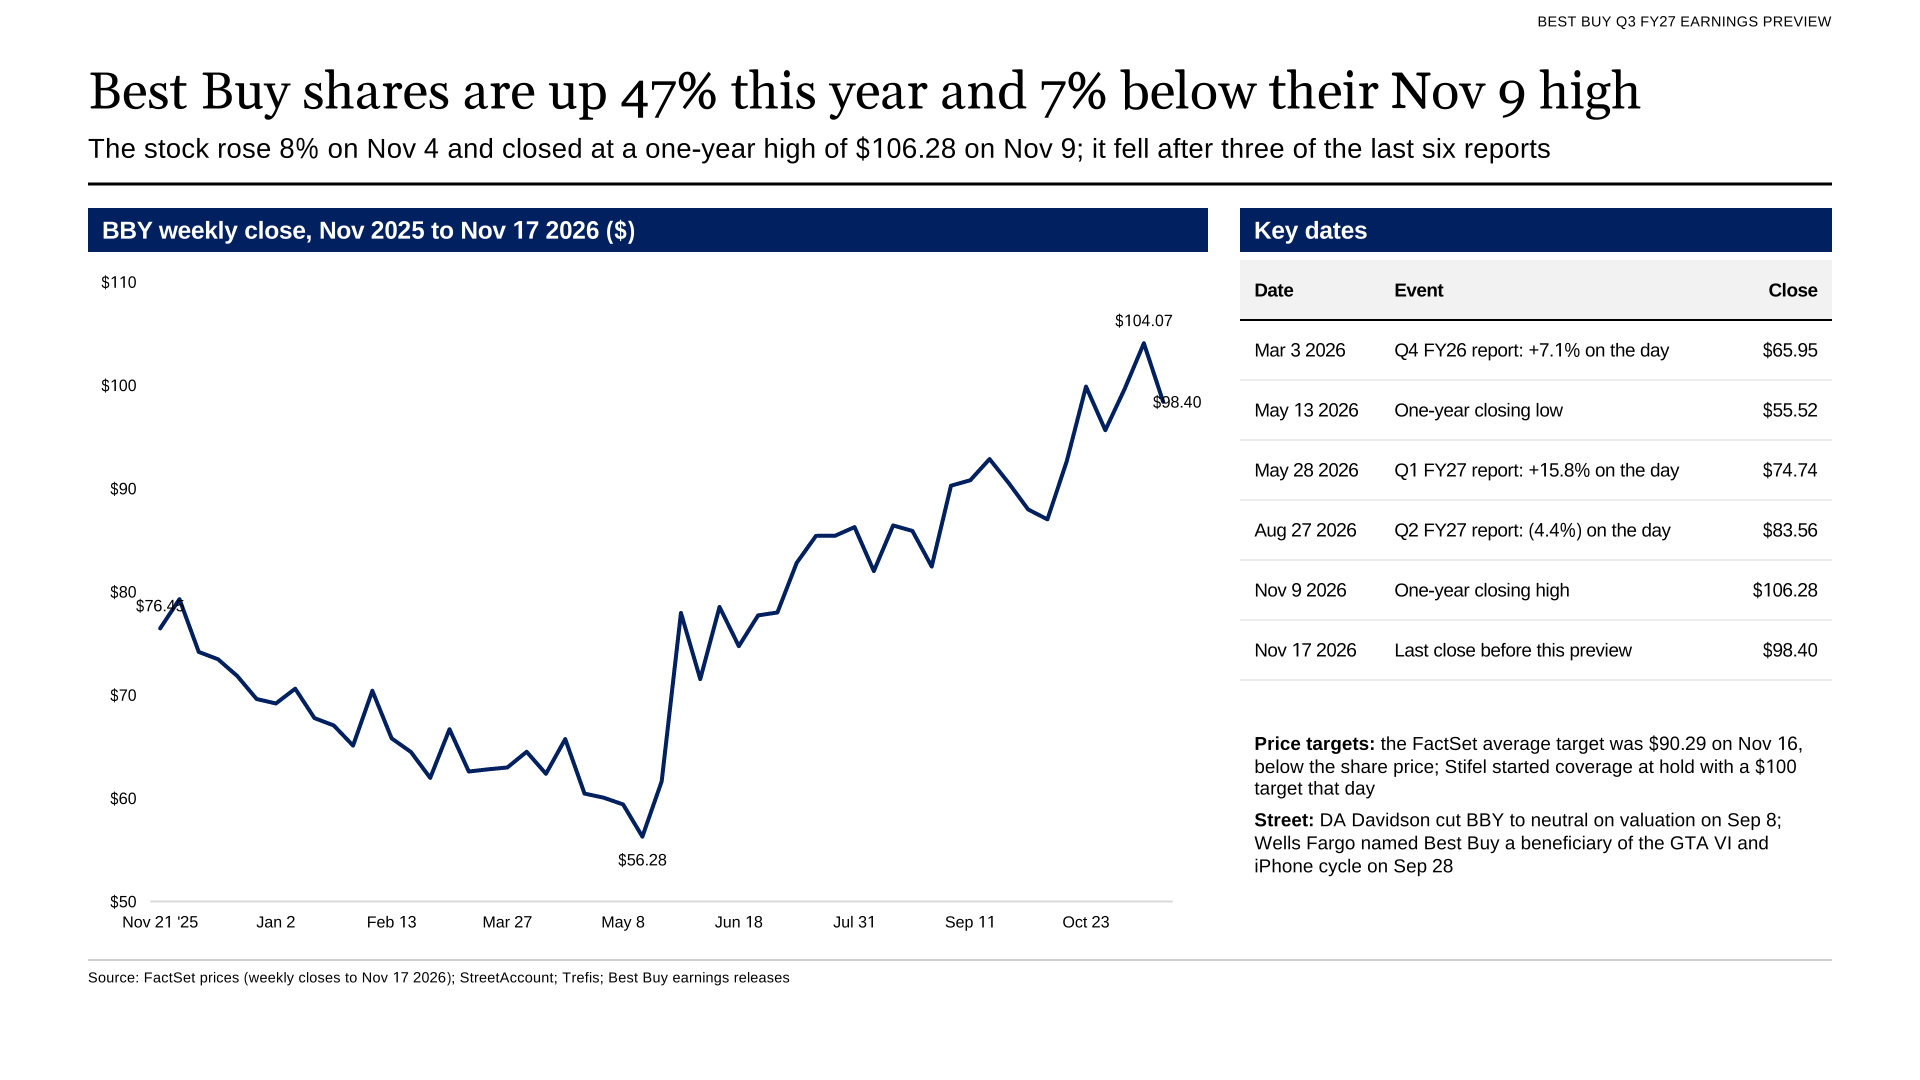
Best Buy shares are up 47% this year and 7% below their Nov. 9 high. Slide 10.
The model
The Excel model has six quarters of history from Best Buy's filings, Domestic and International segment results, comparable sales by category, adjusted and GAAP income statements, quarterly cash flow and working capital, the guidance and consensus track record, and data-table sensitivities on EPS. Every input is on one tab.
What to watch on Tuesday
- Enterprise comparable sales against the 1% to 3% guide and our 2.6%, and how October held up against the Windows 10 compare.
- Computing comps and average selling prices, after mid-teens price gains and high-single-digit unit declines in the second quarter.
- The adjusted operating rate against the 4.1% to 4.2% guide and our 4.3%, including the $41 million tariff refund.
- Fourth-quarter guidance against the $2.59 consensus, with Grand Theft Auto VI and falling PC units pulling in opposite directions.
- The fiscal 2027 EPS range, now $6.70 to $6.90; we expect about $6.80 to $6.95.
- Any early read on the Black Friday sale, which began Nov. 19 and runs 10 days.
We will score this forecast against the reported numbers after the release on Nov. 24.
 Best Buy Q3 FY27 earnings model (Excel)Quarterly model from Q1 FY26: comparable sales by category, Domestic and International segments, adjusted and GAAP income statements, quarterly cash flow and working capital, guidance and consensus track record, Compound's Q3 and Q4 estimates against consensus, and data-table EPS sensitivities, with formulas and sources.Download · Free
 Best Buy Q3 FY27 earnings preview deck (PowerPoint)11 slides: our call, forecast vs consensus, track record, revenue bridge, memory-driven PC prices, margins and tariff refunds, guidance, cash flow, share price and what to watch.Download · Free
More from Compound News

Snowflake Q3 Earnings Preview: $0.69 EPS vs $0.60 Consensus
Snowflake reports Wednesday after the close. Our model puts product revenue 3.5% above the guidance midpoint and EPS at $0.69 against a $0.60 consensus. Remaining performance obligations have fallen for two quarters.
Read article →
Salesforce Q3 Earnings Preview: $3.51 EPS vs $3.45 Consensus
Salesforce reports Wednesday, Dec. 2, after the close. Our model puts third-quarter revenue at $11.50 billion, 0.3% above consensus, and non-GAAP EPS at $3.51 against $3.45. We expect the fourth-quarter revenue guide to land about 1.3% below the Street.
Read article →
Marvell Q3 Earnings Preview: $1.11 EPS vs $1.10 Consensus
Marvell reports Tuesday, Dec. 1, after pre-announcing Q3 revenue at its $3.15 billion guidance midpoint. Our model puts EPS at $1.11 against $1.10 and the Q4 revenue guide at about $3.75 billion. The stock is down 40.9% since Oct. 28.
Read article →