Walmart Q3 Earnings: $0.65 EPS vs $0.64 Consensus
Walmart's adjusted EPS of $0.65 matched our forecast and beat the $0.64 consensus. Revenue of $188.8 billion topped both. The new full-year range of $2.84 to $2.89 came in a cent or two below what we expected.
Walmart reported third-quarter adjusted EPS of $0.65 on Thursday, a cent above the FactSet consensus of $0.64 and equal to Compound's forecast, according to its earnings release.
Total revenues were $188.8 billion, against a $187.3 billion consensus and our $187.5 billion. Net sales grew 4.4% in constant currency, above Walmart's guidance of 3.0% to 3.75% and our 4.0%.
Walmart raised its fiscal 2027 adjusted EPS range to $2.84 to $2.89, from $2.80 to $2.87. We had expected $2.86 to $2.90; consensus was $2.89.
Results vs consensus vs Compound
| Q3 FY27 | Consensus | Compound | Actual | Actual vs consensus | Actual vs Compound |
|---|---|---|---|---|---|
| Total revenues | $187.3B | $187.5B | $188.8B | +0.8% | +0.7% |
| Net sales growth (cc) | n/a | 4.0% | 4.4% | n/a | +0.4 pt |
| Walmart U.S. comp sales | +3.1% | +3.2% | +2.9% | -0.2 pt | -0.3 pt |
| Gross profit rate | n/a | 24.3% | 24.5% | n/a | +0.2 pt |
| Adjusted operating income (cc) | $7.54B | $7.58B | $7.66B | +1.6% | +1.1% |
| Adjusted EBITDA | $11.43B | $11.65B | $11.79B | +3.1% | +1.2% |
| Adjusted EPS | $0.64 | $0.65 | $0.65 | +1.8% | 0.0% |
Consensus is the FactSet mean as of Nov. 17, as published in our preview; comp sales consensus is from StreetAccount's Nov. 16 preview. Walmart does not report adjusted EBITDA: the actual is adjusted operating income of $7.77 billion plus third-quarter depreciation and amortization of $4.02 billion. Guidance was 3.0% to 3.75% for net sales and 2% to 4% for operating income, both in constant currency (cc).
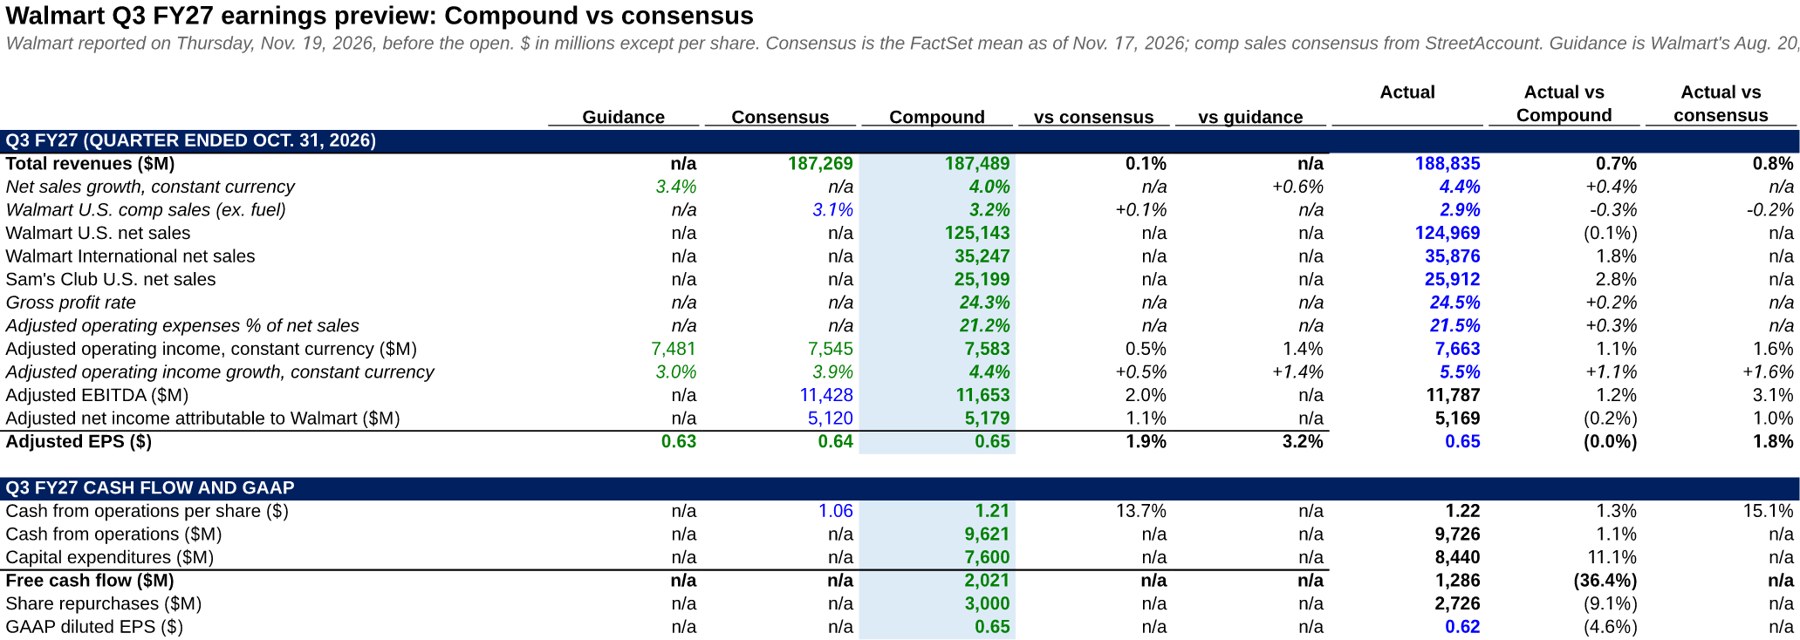
The model's Preview tab now carries the reported actuals next to guidance, consensus and our estimates, each cited to the release.
Guidance
Walmart now expects fiscal 2027 net sales to grow 4.9% to 5.2% in constant currency, up from 4.0% to 5.0%, and adjusted operating income to grow 8.0% to 8.6%, up from 7.0% to 8.5%. StreetAccount reported FactSet consensus at 5.5% and 8.4%. Our model had 5.1% and 8.2%.
Walmart does not guide the fourth quarter. The new EPS range, less nine-month adjusted EPS of $2.12, implies $0.72 to $0.77, or $0.745 at the midpoint, against consensus of $0.785 and our $0.79. The new midpoint of $2.865 is 1.5 cents below the $2.88 we expected. Capital spending guidance stayed at about 4% of net sales.
| FY27 guidance | Aug. 20 range | Nov. 19 range | Consensus | Compound |
|---|---|---|---|---|
| Adjusted EPS | $2.80 to $2.87 | $2.84 to $2.89 | $2.89 | $2.86 to $2.90 expected |
| Net sales growth (cc) | 4.0% to 5.0% | 4.9% to 5.2% | 5.5% | 5.1% |
| Adjusted operating income growth (cc) | 7.0% to 8.5% | 8.0% to 8.6% | 8.4% | 8.2% |
| Implied Q4 adjusted EPS (midpoint) | $0.745 | $0.745 | $0.785 | $0.79 |
Full-year consensus for sales and operating income growth as reported by StreetAccount on Nov. 19; EPS consensus is the FactSet mean in our preview.
What drove the quarter
Walmart U.S. comp sales rose 2.9%, with transactions up 1.5% and average ticket up 1.4%, and eCommerce added about 530 basis points, the release said. Walmart said drug-price deflation under maximum fair price regulation cost about 70 basis points of comp.
U.S. eCommerce sales rose 23% and U.S. advertising 37%. The Walmart U.S. gross profit rate rose 50 basis points on business and merchandise mix, while operating expenses deleveraged 45 basis points on depreciation and higher claims costs. Segment operating income rose 9.0% to $6.3 billion.
International net sales rose 7.0%, or 3.3% in constant currency. Walmart said the timing of Flipkart's Big Billion Days took about 500 basis points off the segment's net sales growth, with a matching benefit expected in the fourth quarter. Currency added $1.2 billion to sales.
Sam's Club U.S. net sales rose 10.0%, or 5.2% excluding fuel, with comp sales up 4.9%. Its operating income fell 15.8% to $547 million, which Walmart put down to lapping breakage income on unredeemed Sam's Cash, an inflation-related LIFO charge and the allocation of fees from the new $120 Walmart+ and Sam's Club Plus bundle.
Membership fee revenue rose 17% globally, global advertising 25% and global eCommerce 17%. The consolidated gross profit rate rose 28 basis points. Inventory rose 8.1% to $70.6 billion. GAAP EPS was $0.62, including a $0.03 net loss on equity and other investments.
How our forecast did
We had adjusted EPS exactly, at $0.65, with errors that offset.
Revenue was $1.3 billion above our estimate. Sam's Club sales of $25.9 billion beat our $25.2 billion as fuel lifted growth to 10.0%, against the 7.0% we modeled. International sales of $35.9 billion topped our $35.2 billion: currency added $1.2 billion where we assumed $0.7 billion, and constant-currency growth was 3.3% against our 3.0%. Membership and other income of $2.08 billion was 9% above our $1.90 billion. Walmart U.S. sales of $125.0 billion were within $0.2 billion of our number.
Walmart U.S. comp was our miss: 2.9% against our 3.2% and the 3.1% consensus. Transactions grew 1.5%, the same rate as in the second quarter.
Adjusted operating income grew 5.5% in constant currency, above the top of Walmart's 2% to 4% guide and our 4.4%. Second- and third-quarter profit together grew 11.7%, against our 11.2% and the roughly 10% CFO John David Rainey described in August. The gross profit rate of 24.5% beat our 24.3%; operating expenses of 21.5% of net sales ran above our 21.2%.
Below operating income the gap closed. Interest, net was $685 million against our $640 million, and the adjusted tax rate was 24.6% against our 23.8%.
Free cash flow was $1.29 billion against our $2.02 billion, because capital spending of $8.44 billion topped our $7.6 billion. On the full-year EPS range we were 2 cents high at the bottom and a cent high at the top. For an earlier forecast we scored, see our Nvidia preview.
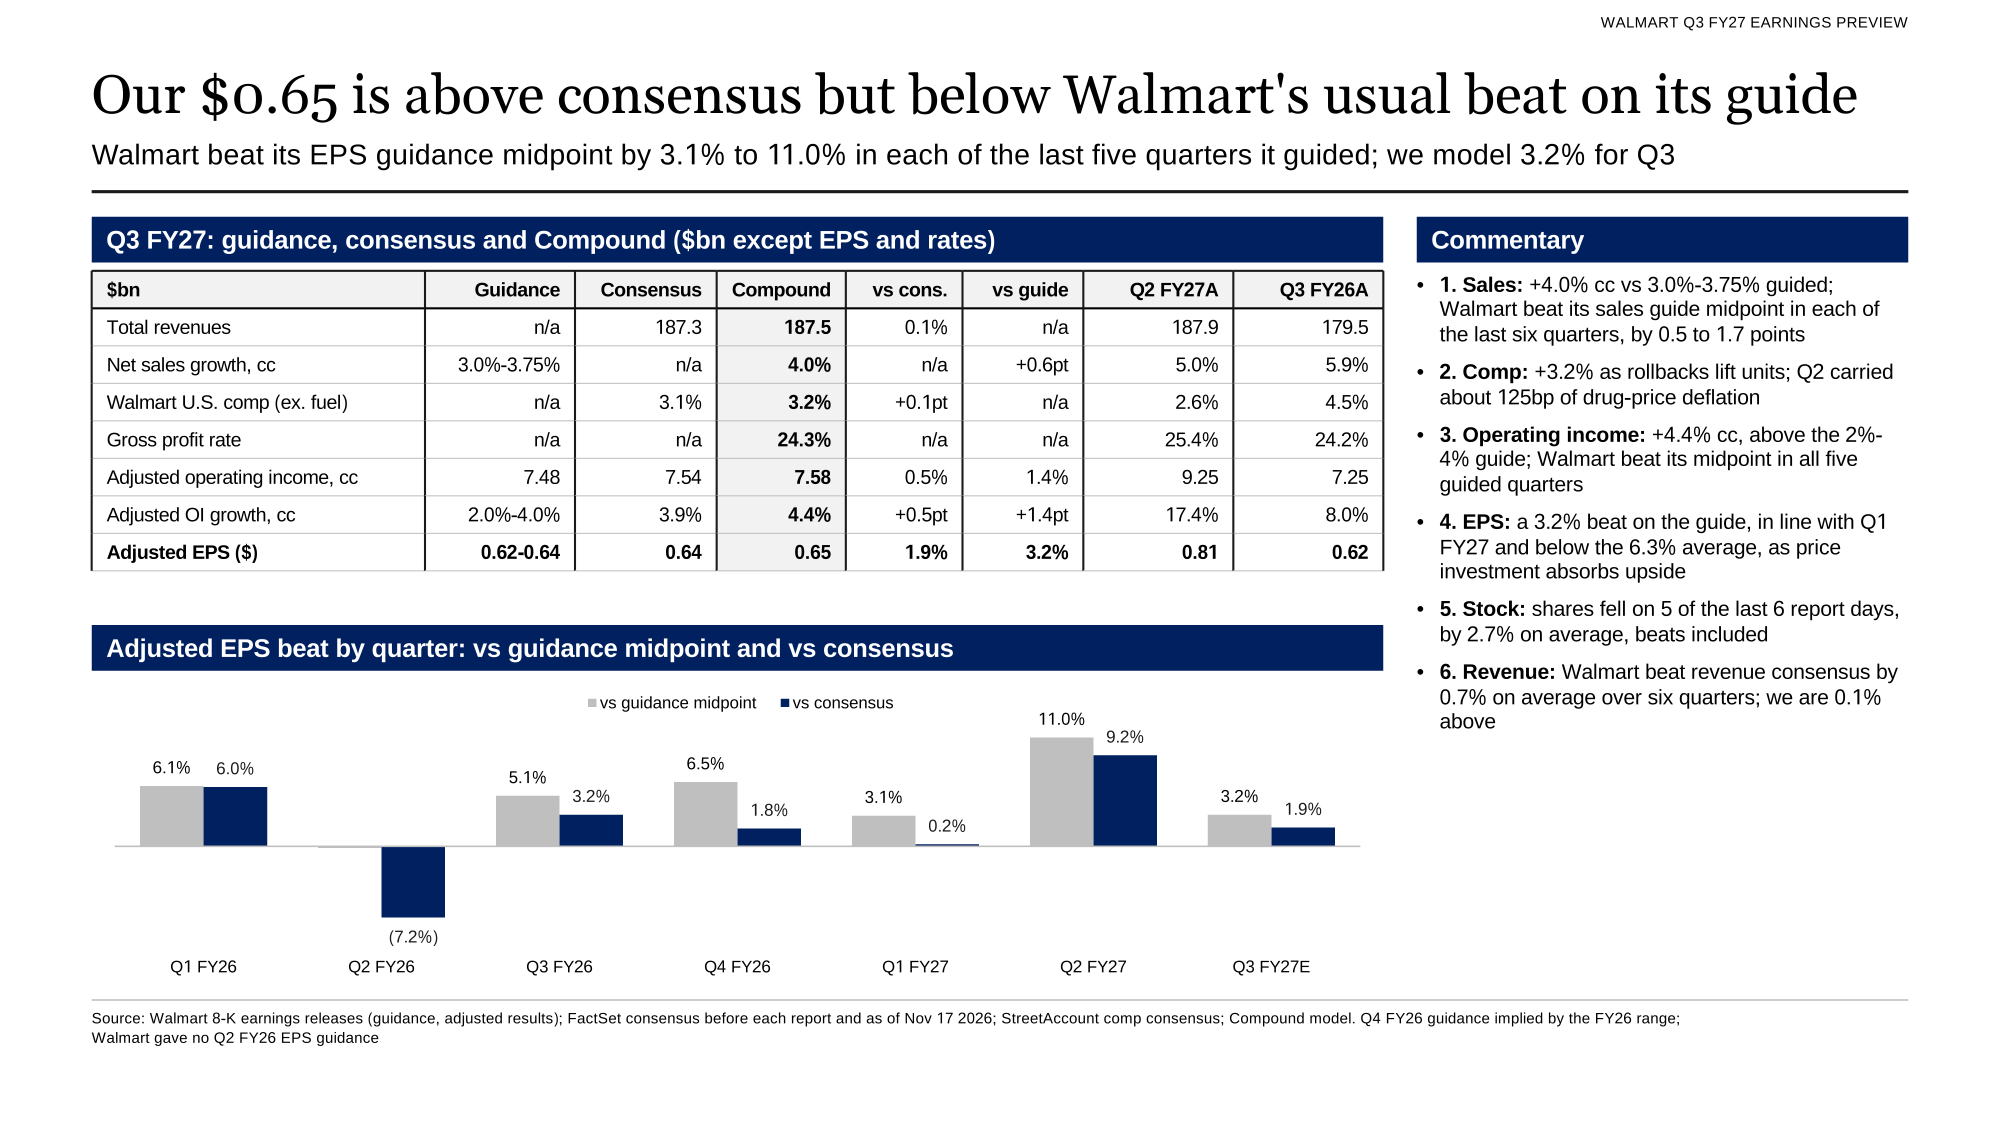
From our preview deck: Walmart's EPS beat by quarter. The reported $0.65 was 3.2% above the guidance midpoint and 1.8% above consensus, as we modeled.
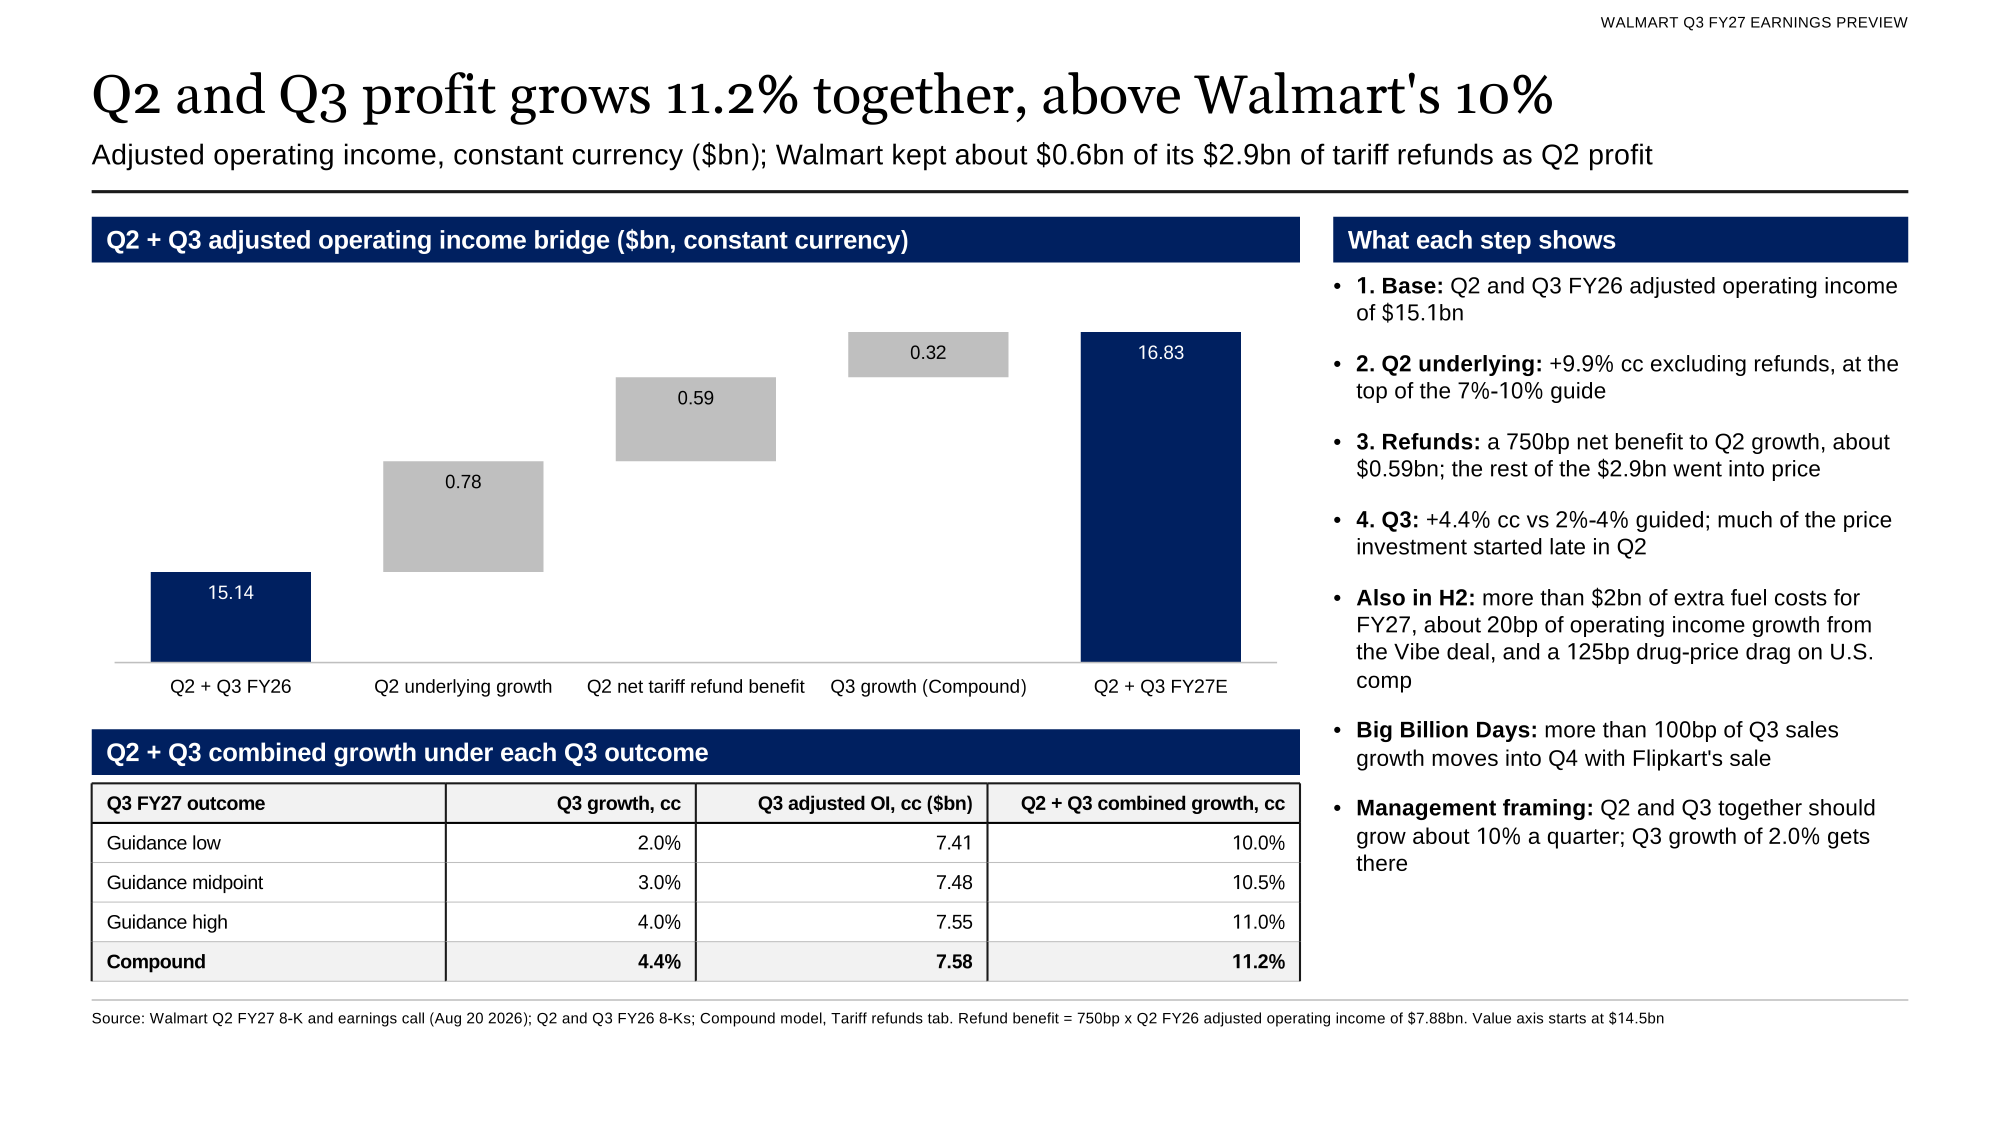
From our preview deck: the Q2 and Q3 profit bridge. Reported Q3 adjusted operating income of $7.66 billion in constant currency compares with $7.58 billion in the bridge.
Stock reaction
Walmart shares closed at $127.36 on Nov. 18, according to FactSet. Early pre-market quotes were mixed: Price Theory posted on X that the stock was up 1.29% at 7:04 a.m. ET (unconfirmed), and Insight posted a 0.6% decline at about 7:30 a.m. ET (unconfirmed).
What to watch next
- Nov. 19, 8:00 a.m. ET: the earnings call, for how much of the Big Billion Days benefit Walmart expects in the fourth quarter and the claims and depreciation costs behind U.S. expense deleverage.
- Nov. 27: Black Friday, the first holiday season with the $120 Walmart+ and Sam's Club Plus bundle.
- Q4 implied EPS: $0.72 to $0.77 under the new range, against the $0.785 consensus.
- Feb. 18, 2027, 7:00 a.m. ET: fourth-quarter results, according to FactSet's calendar. Walmart issued its fiscal 2027 outlook with fourth-quarter results last February.
 Walmart Q3 FY27 earnings model with actuals (Excel)Our preview model with the reported Q3 FY27 actuals added to the Preview tab next to guidance, consensus and our estimates, plus the quarterly model, sensitivities and tariff refund analysis, with formulas and sources.Download · Free
 Walmart Q3 FY27 earnings preview deck (PowerPoint)The 10-slide preview deck: forecast vs consensus, track record, revenue build, margins, the FY27 guide, the tariff refund bridge, the share price, cash flow and what to watch.Download · Free
More from Compound News

TJX Q3 Earnings: $1.34 EPS vs $1.34 Consensus
TJX matched the $1.34 consensus on adjusted EPS and beat on sales and comparable sales, but cut its fourth-quarter outlook on fuel costs. Our $1.36 forecast was $0.02 too high.
Read article →
Target Q3 Earnings: $2.65 EPS vs $2.08 Consensus
Target's third-quarter EPS of $2.65 included $0.50 of tariff refunds; excluding them, $2.15 beat the $2.08 consensus and our $2.10. Sales of $27.07 billion beat both, and Target raised its full-year outlook.
Read article →
Lowe's Q3 Earnings: $3.10 EPS vs $2.88 Consensus
Lowe's adjusted EPS of $3.10 beat the $2.88 consensus and our $2.94, but $0.34 came from tariff refunds. Comparable sales rose 1.8%, and Lowe's raised its sales outlook to about $92.5 billion while holding EPS at about $12.25.
Read article →