Workday Q3 Earnings Preview: $2.85 EPS vs $2.75 Consensus
Workday reports Tuesday, its first quarter since Silver Lake takeover talks were reported and its October analyst day. Our model puts subscription revenue 0.4% above consensus, cRPO growth at the top of guidance and EPS at $2.85 against $2.75.

Workday reports fiscal third-quarter results on Tuesday, Nov. 24, after the market close, with the call at 1:30 p.m. PT, the company said on Nov. 2. The quarter ended Oct. 31.
Compound's model forecasts Q3 subscription revenue of $2.53 billion, up 12.7% from a year earlier. That is 0.6% above Workday's $2.515 billion guidance and 0.4% above the $2.52 billion StreetAccount consensus. We forecast non-GAAP EPS of $2.85 against the FactSet consensus of $2.75, and a non-GAAP operating margin of 31.0% against guidance of 30.0%.
We expect 12-month subscription revenue backlog, or cRPO, to grow 12.0% to $9.20 billion, the top of Workday's 11% to 12% guidance.
The stock closed at $182.80 on Nov. 17, according to FactSet, down 14.9% this year and up 4.3% from $175.29 on Aug. 12, the day before Reuters reported that Silver Lake was in talks to buy Workday. Workday shares have moved an average of 6.1% the day after each of the last six reports.
We built an 11-page earnings preview deck on the model, in the format of our Nike Investor Day memo. The slides below come from it, and the deck and the Excel model are free to download at the end.
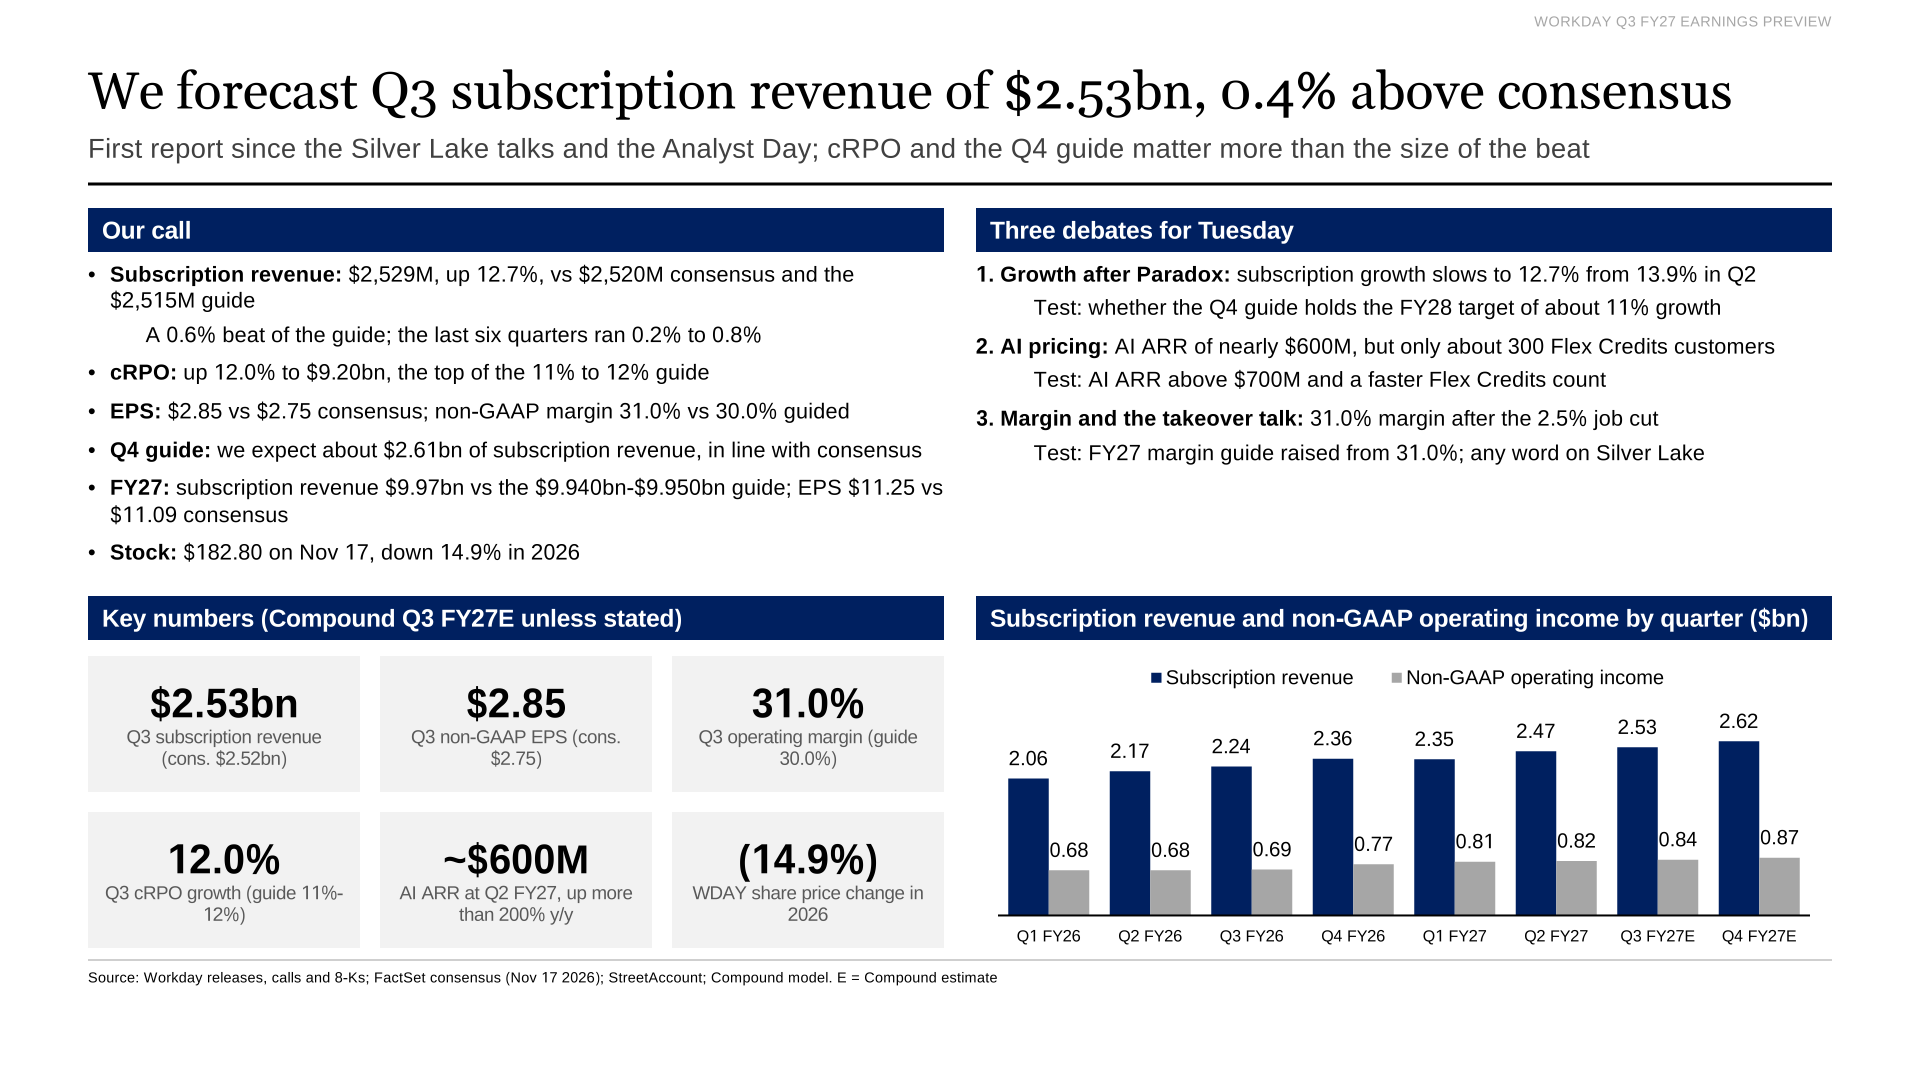
Executive summary: our call against consensus and the three debates for Tuesday.
Forecast vs consensus
| Q3 FY27 | Guidance | Consensus | Compound | Compound vs consensus |
|---|---|---|---|---|
| Subscription revenue | $2,515M | $2,520M | $2,529M | +0.4% |
| Professional services | $175M | n/a | $177M | n/a |
| Total revenue | $2,690M | $2,692M | $2,706M | +0.5% |
| cRPO growth | 11% to 12% | n/a | 12.0% | n/a |
| Non-GAAP operating margin | 30.0% | 30.1% | 31.0% | +0.9 pt |
| Non-GAAP operating income | $807M | $811M | $839M | +3.4% |
| Non-GAAP EPS | n/a | $2.75 | $2.85 | +4.0% |
| GAAP EPS | n/a | n/a | $0.81 | n/a |
Consensus is the FactSet mean as of Nov. 17, except subscription revenue, which is the StreetAccount consensus cited after the Q2 report. Guidance total revenue and operating income combine Workday's subscription, services and margin guides. Workday does not guide EPS.
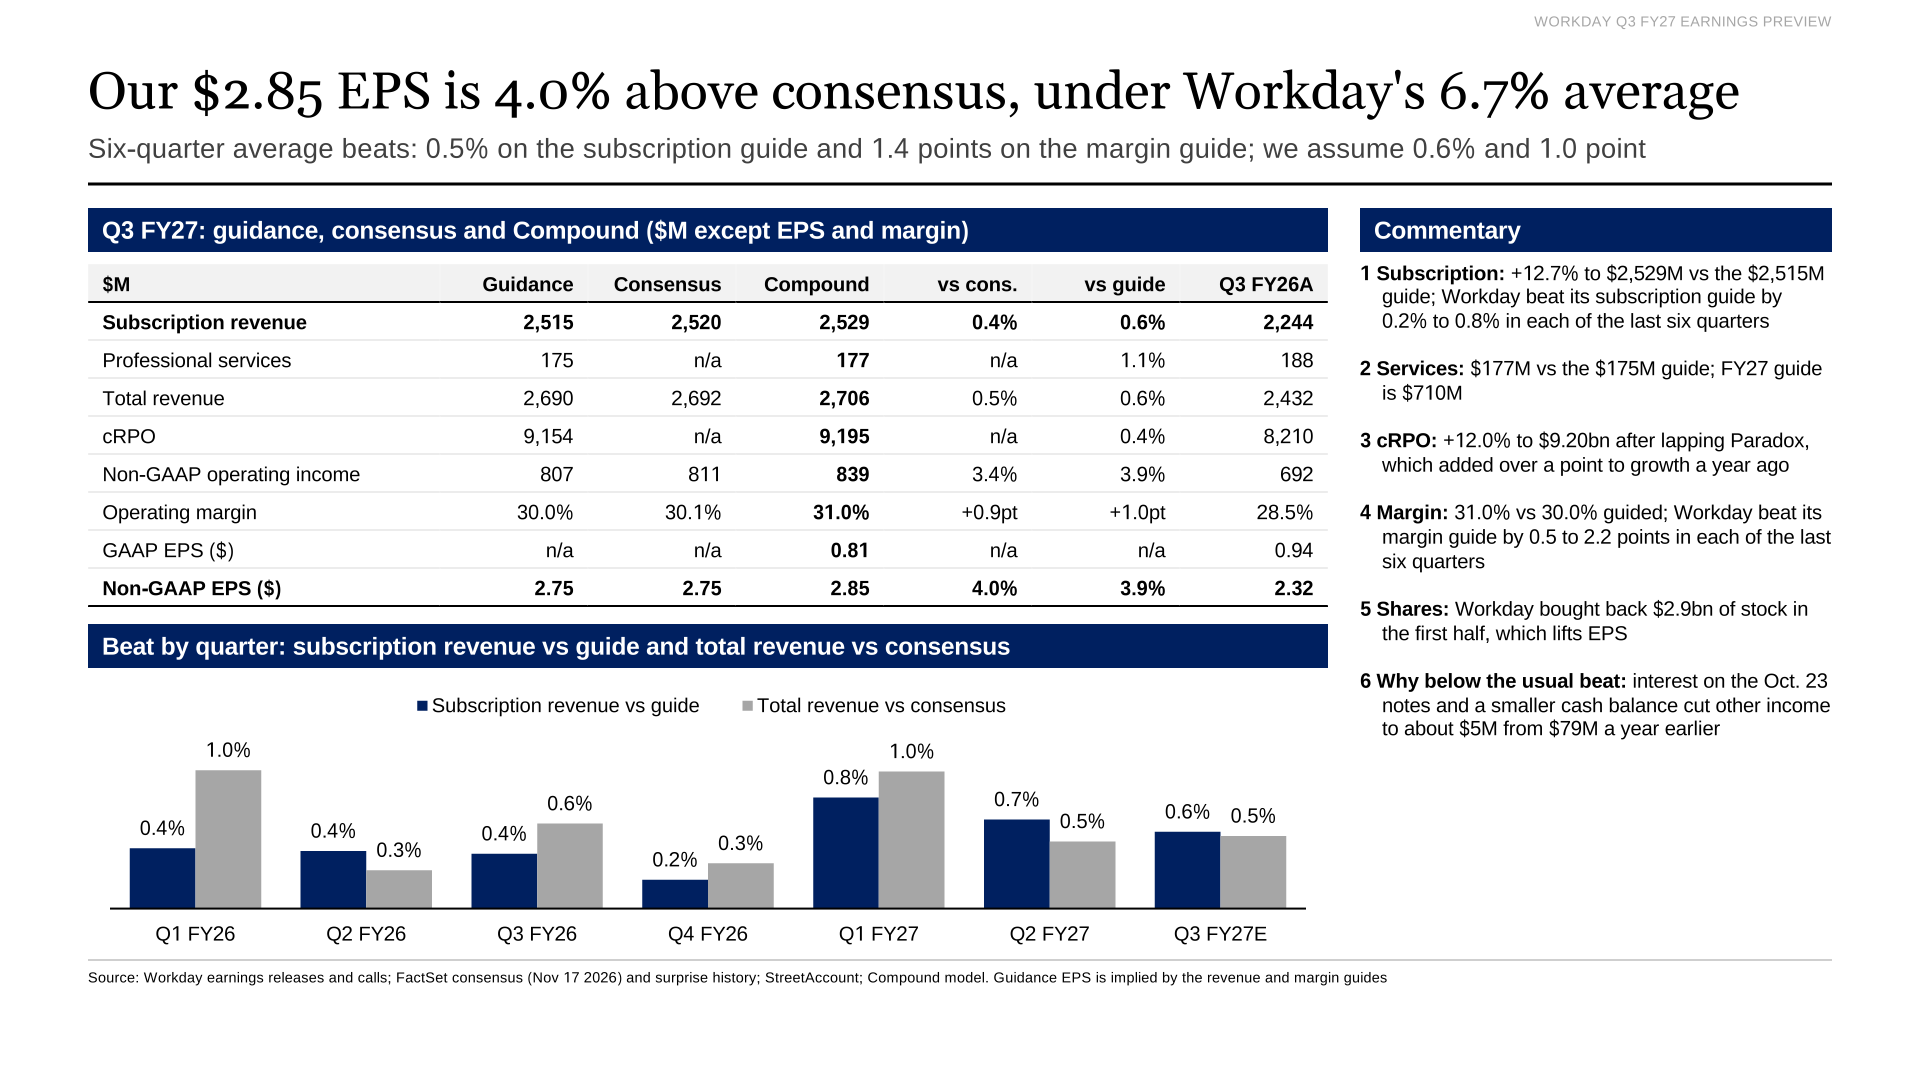
Workday beat its subscription guide by 0.5% on average over six quarters; we assume 0.6%.
Subscription growth after Paradox
Subscription revenue grew 13.9% to $2.47 billion in the second quarter, Workday reported on Aug. 27. Our Q3 forecast slows growth to 12.7% as Workday laps the Paradox acquisition, which closed in Q3 FY26 and, Workday said, added over a point to that quarter's cRPO growth.
Workday beat its subscription revenue guidance in each of the last six quarters, by 0.2% to 0.8%. We assume 0.6%, a little below the 0.8% and 0.7% beats of the last two quarters.
Professional services revenue is guided to $175 million for Q3 and $710 million for the year. We forecast $177 million.
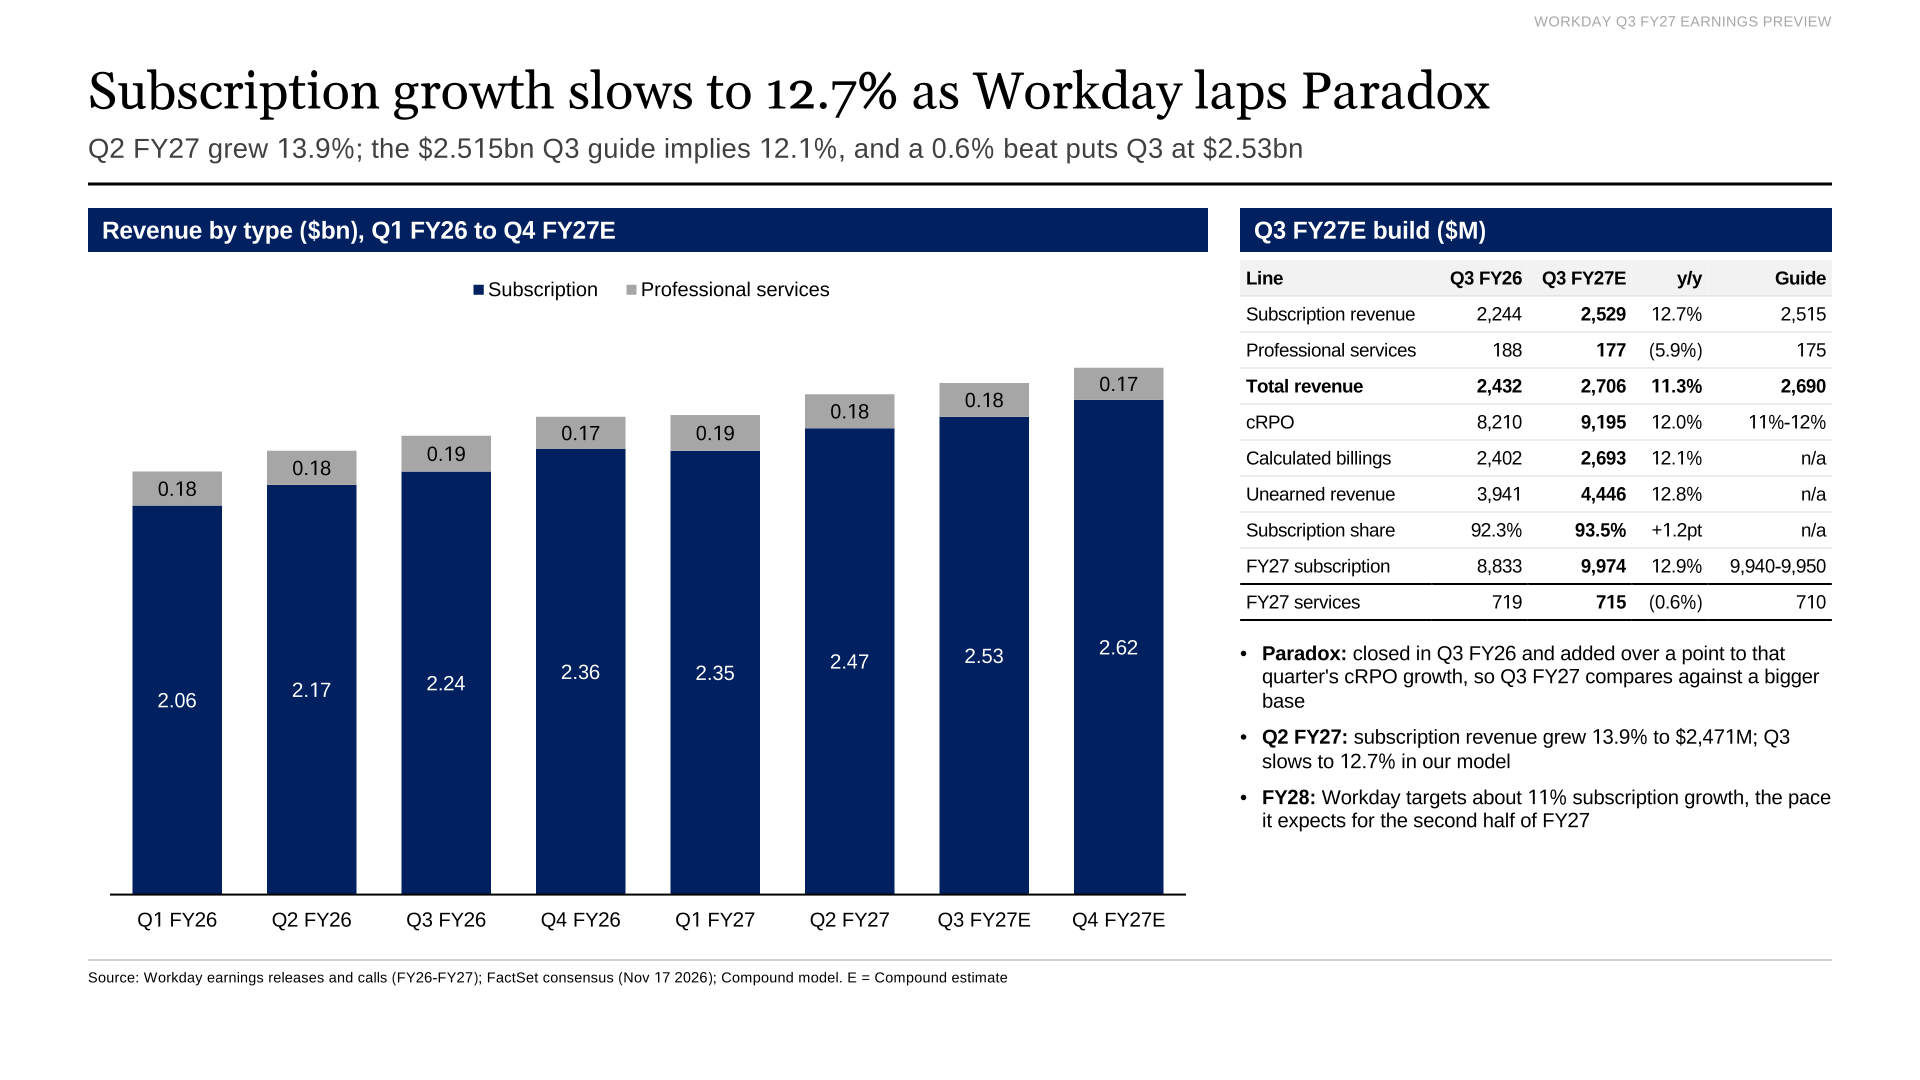
Subscription revenue by quarter, and the Q3 FY27 build against the year-earlier quarter and guidance.
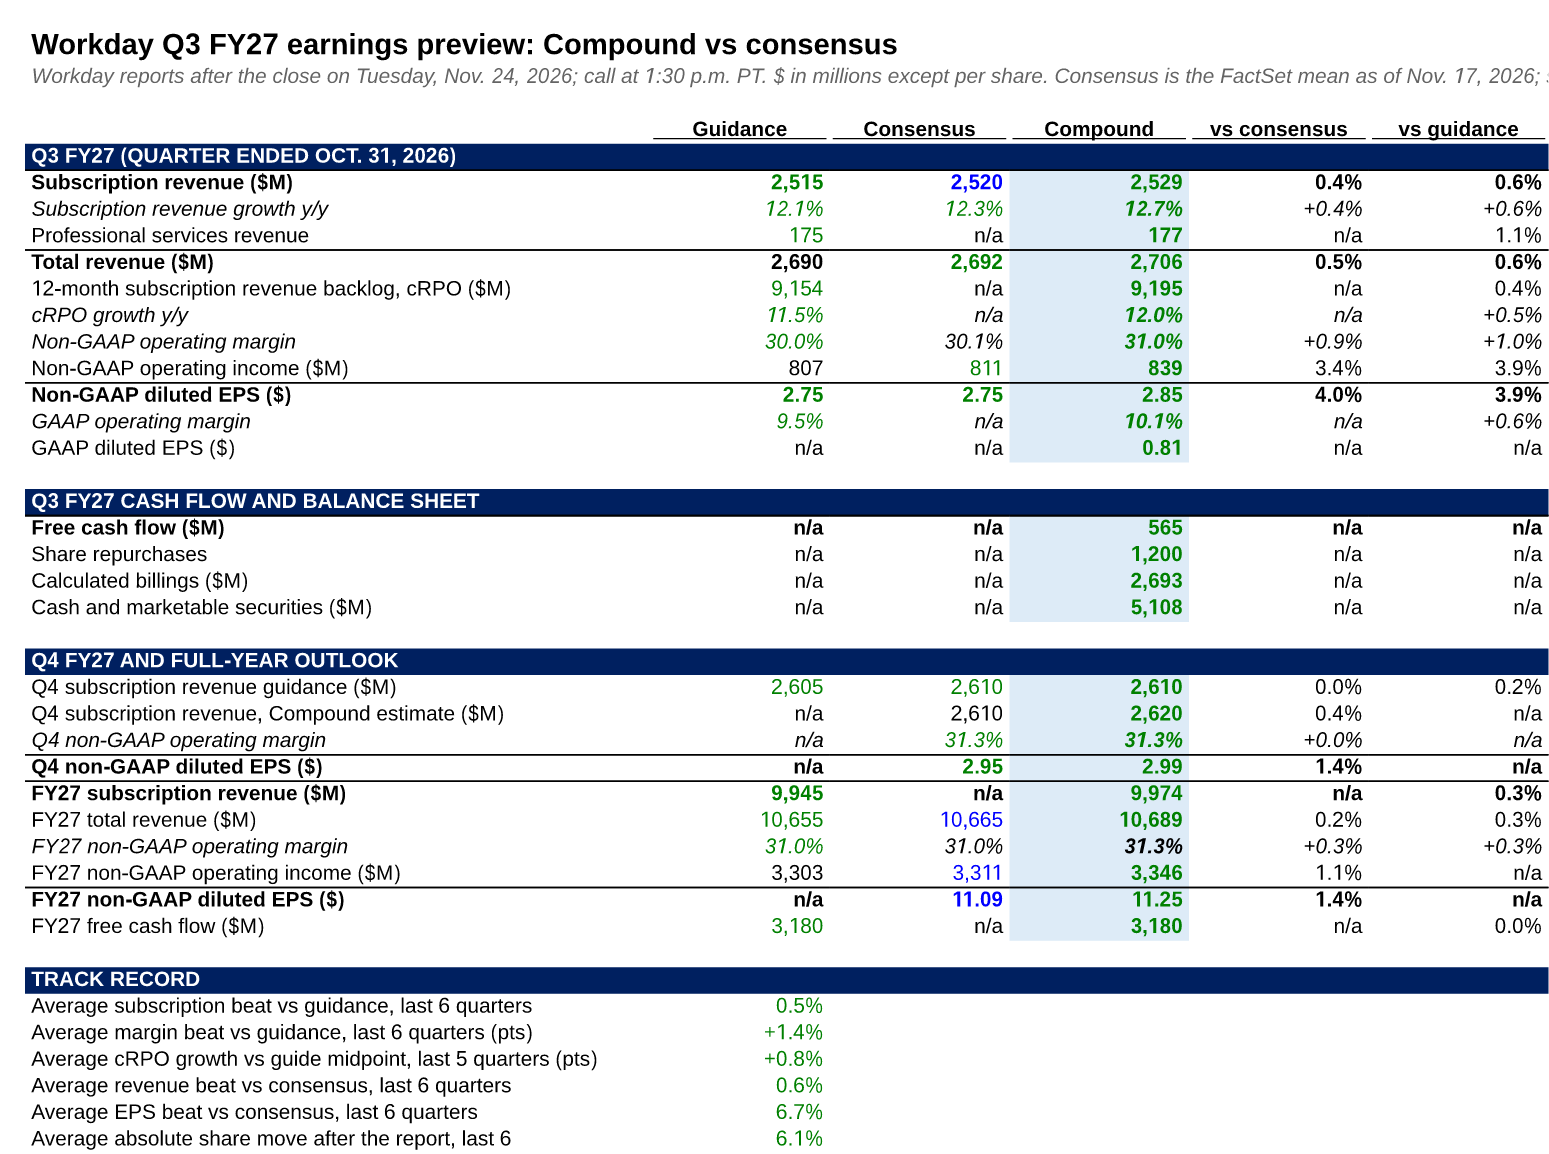
The Preview tab of the Excel model, which links every estimate to its drivers.
cRPO
Workday guided Q3 cRPO growth of 11% to 12% on Aug. 27. StreetAccount said the guide was about 2 percentage points below consensus at the time. In Q2, cRPO grew 14.2% to $9.03 billion, against StreetAccount consensus of $9.02 billion.
In the four quarters without an acquisition effect, reported cRPO growth landed 0.2 to 0.9 points above the midpoint of Workday's guidance. We forecast 12.0%.
Total subscription revenue backlog grew 8.0% to $27.4 billion in Q2. Chief financial officer Zane Rowe said the growth rate reflected a shift toward bookings from existing customers over new customers.
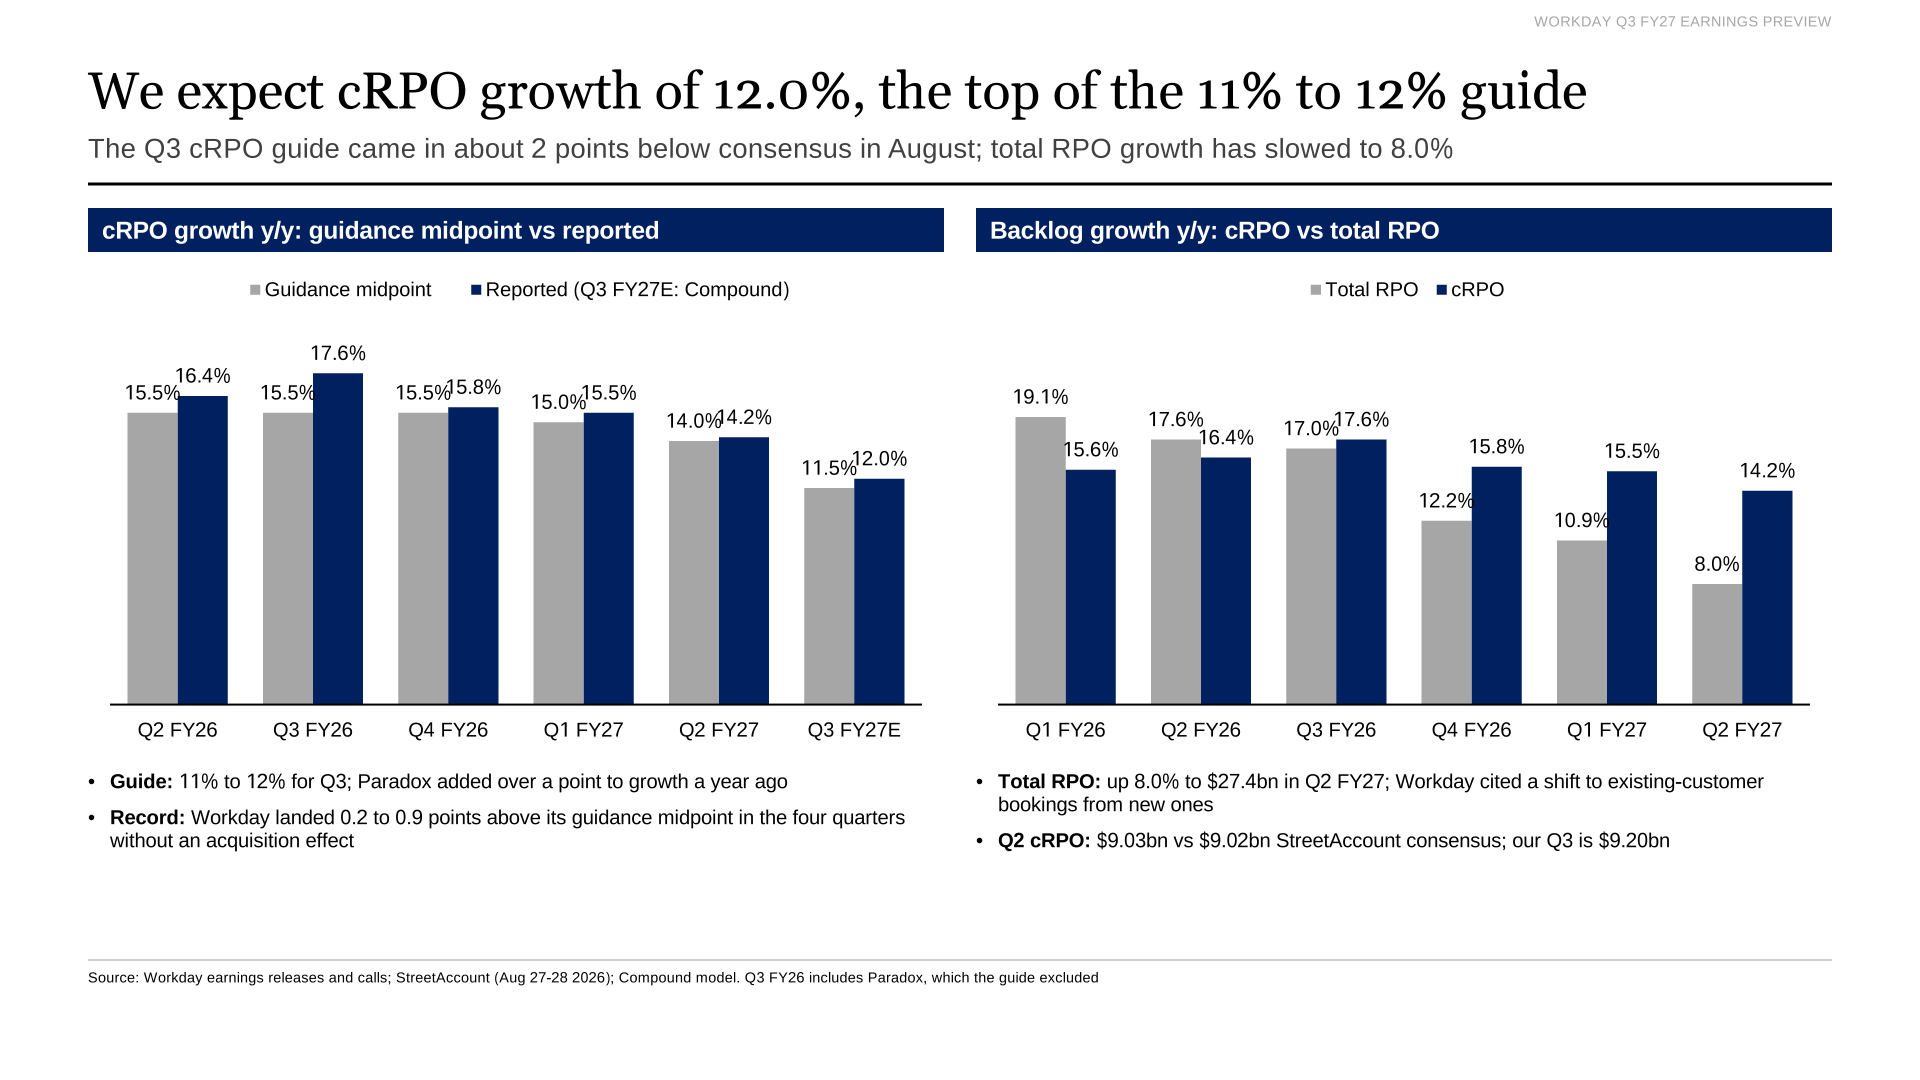
cRPO growth against the guidance midpoint, and cRPO against total backlog growth.
AI agent pricing
Workday said it had nearly $600 million of annual recurring revenue from AI products at the end of Q2, up more than 200% from a year earlier. It reported more than 5,500 customers using at least one of its own agents.
Workday sells agents through Flex Credits, a usage-based model. At its Oct. 13 analyst day, Workday said nearly 300 customers had moved onto Flex Credits, typically on one- to three-year commitments tied to outcomes such as the number of job applicants, not to tokens.
Rowe said on the Q2 call that the gap between agent users and Flex Credits sign-ups was a delay already factored into the cRPO and revenue guidance. Workday did not put its Self-Service Agent on the Flex Credit meter until late August or September, Gerrit Kazmaier, Workday's president of product and technology, said.
We model AI ARR of about $708 million for Q3, 18% above Q2. Nearly $600 million of AI ARR was about 6% of Workday's annualized Q2 subscription revenue.
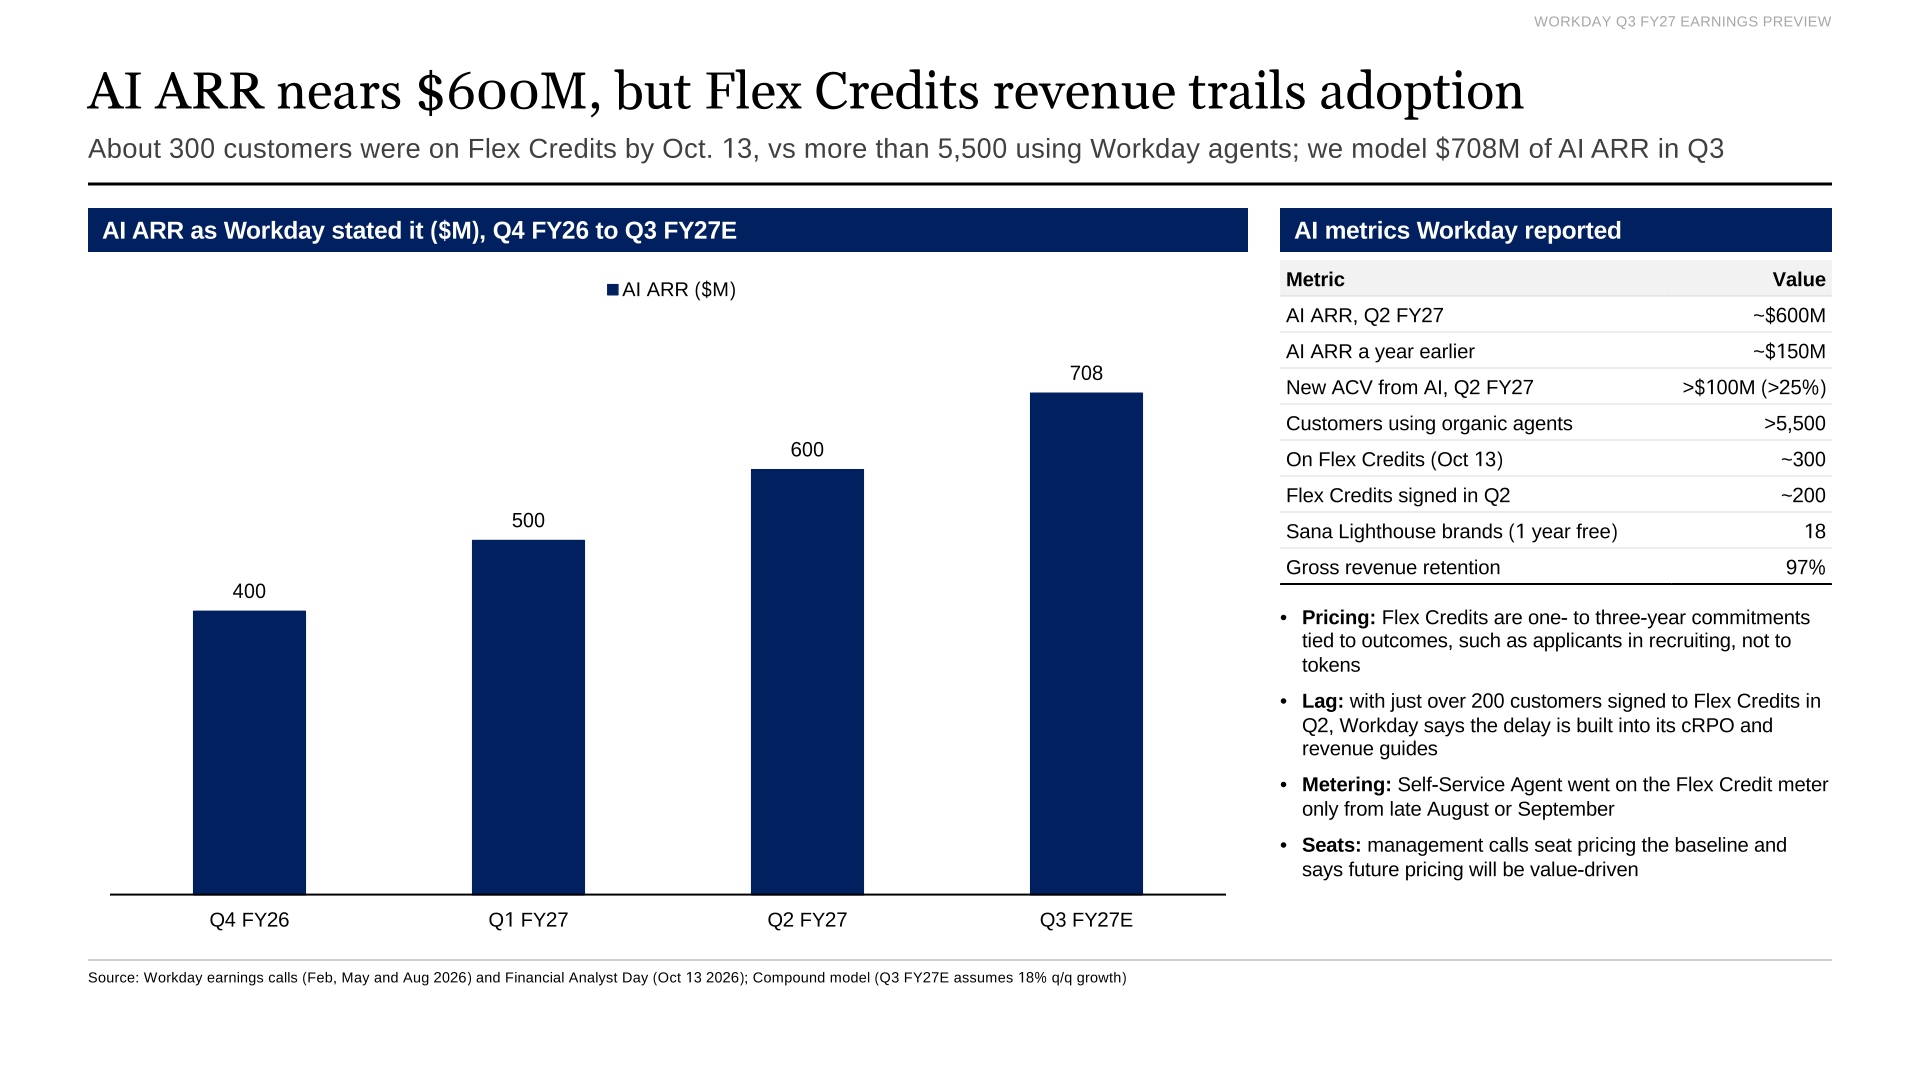
AI ARR as Workday stated it, and the AI metrics it has disclosed.
Operating margin
Workday guided a Q3 non-GAAP operating margin of 30.0% and raised its full-year margin guide to 31.0% from 30.5% in August. It beat its quarterly margin guide by 0.5 to 2.2 points in each of the last six quarters. We forecast 31.0%.
On Sept. 29, Workday announced a reorganization that cuts about 2.5% of its workforce, mostly in product and technology, according to an 8-K filing. It expects $55 million to $70 million of charges in Q3, excluded from non-GAAP results, and now guides Q3 GAAP operating margin 20 to 21 points below the non-GAAP margin.
Excluding stock pay, product development fell to 20.0% of revenue in Q2 from 20.9% a year earlier. The model's sensitivity table puts Q3 EPS at $2.75 to $2.96 for subscription growth of 12.1% to 13.3% and margins of 30% to 32%.
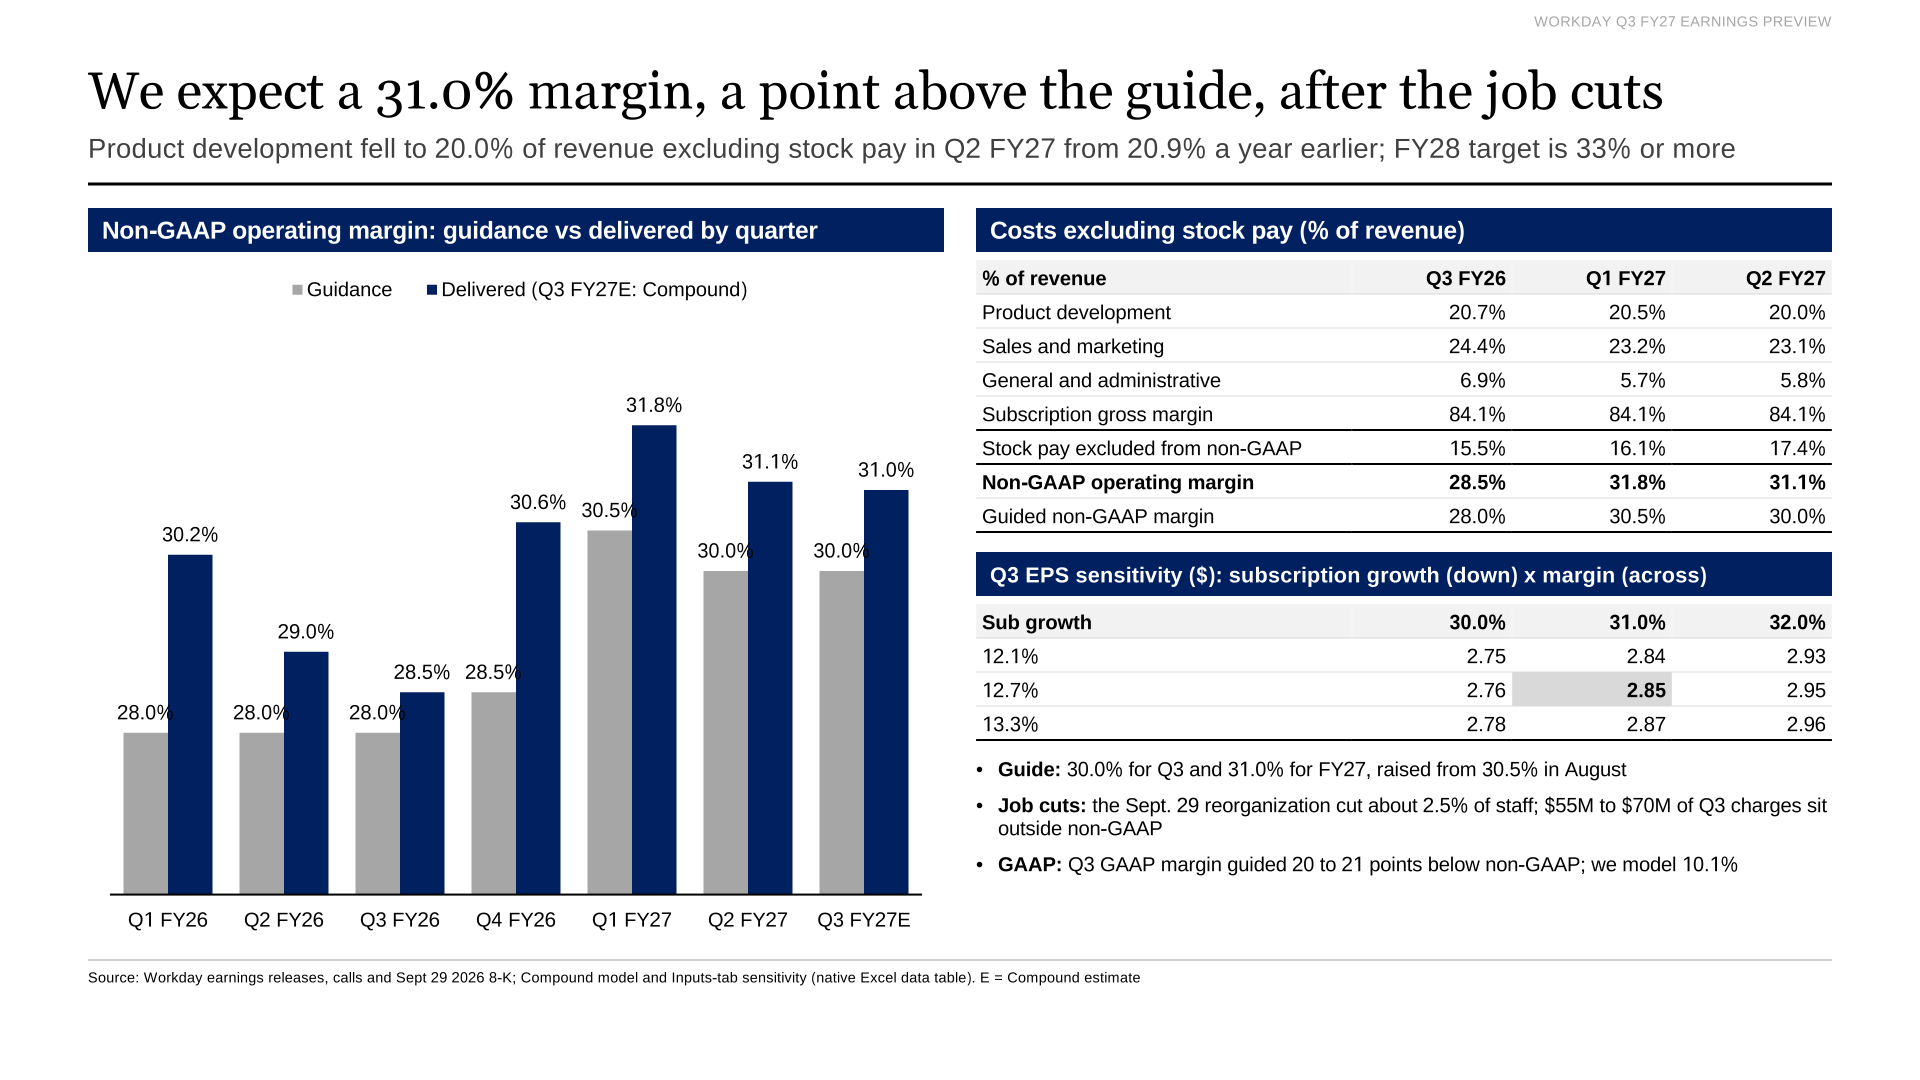
Non-GAAP operating margin against guidance by quarter, cost ratios excluding stock pay, and the EPS sensitivity.
Q4 guidance and fiscal 2028
Workday's FY27 subscription revenue guide of $9.940 billion to $9.950 billion implies about $2.605 billion for Q4 at the Q3 guide. We expect a Q4 guide of about $2.61 billion, in line with the consensus implied by FactSet's Q4 revenue estimate.
At its Oct. 13 analyst day, Workday kept its fiscal 2028 targets of about 11% subscription revenue growth and a non-GAAP operating margin above 33%. It also targets free cash flow of about $13 a share in FY27 and $15 in FY28.
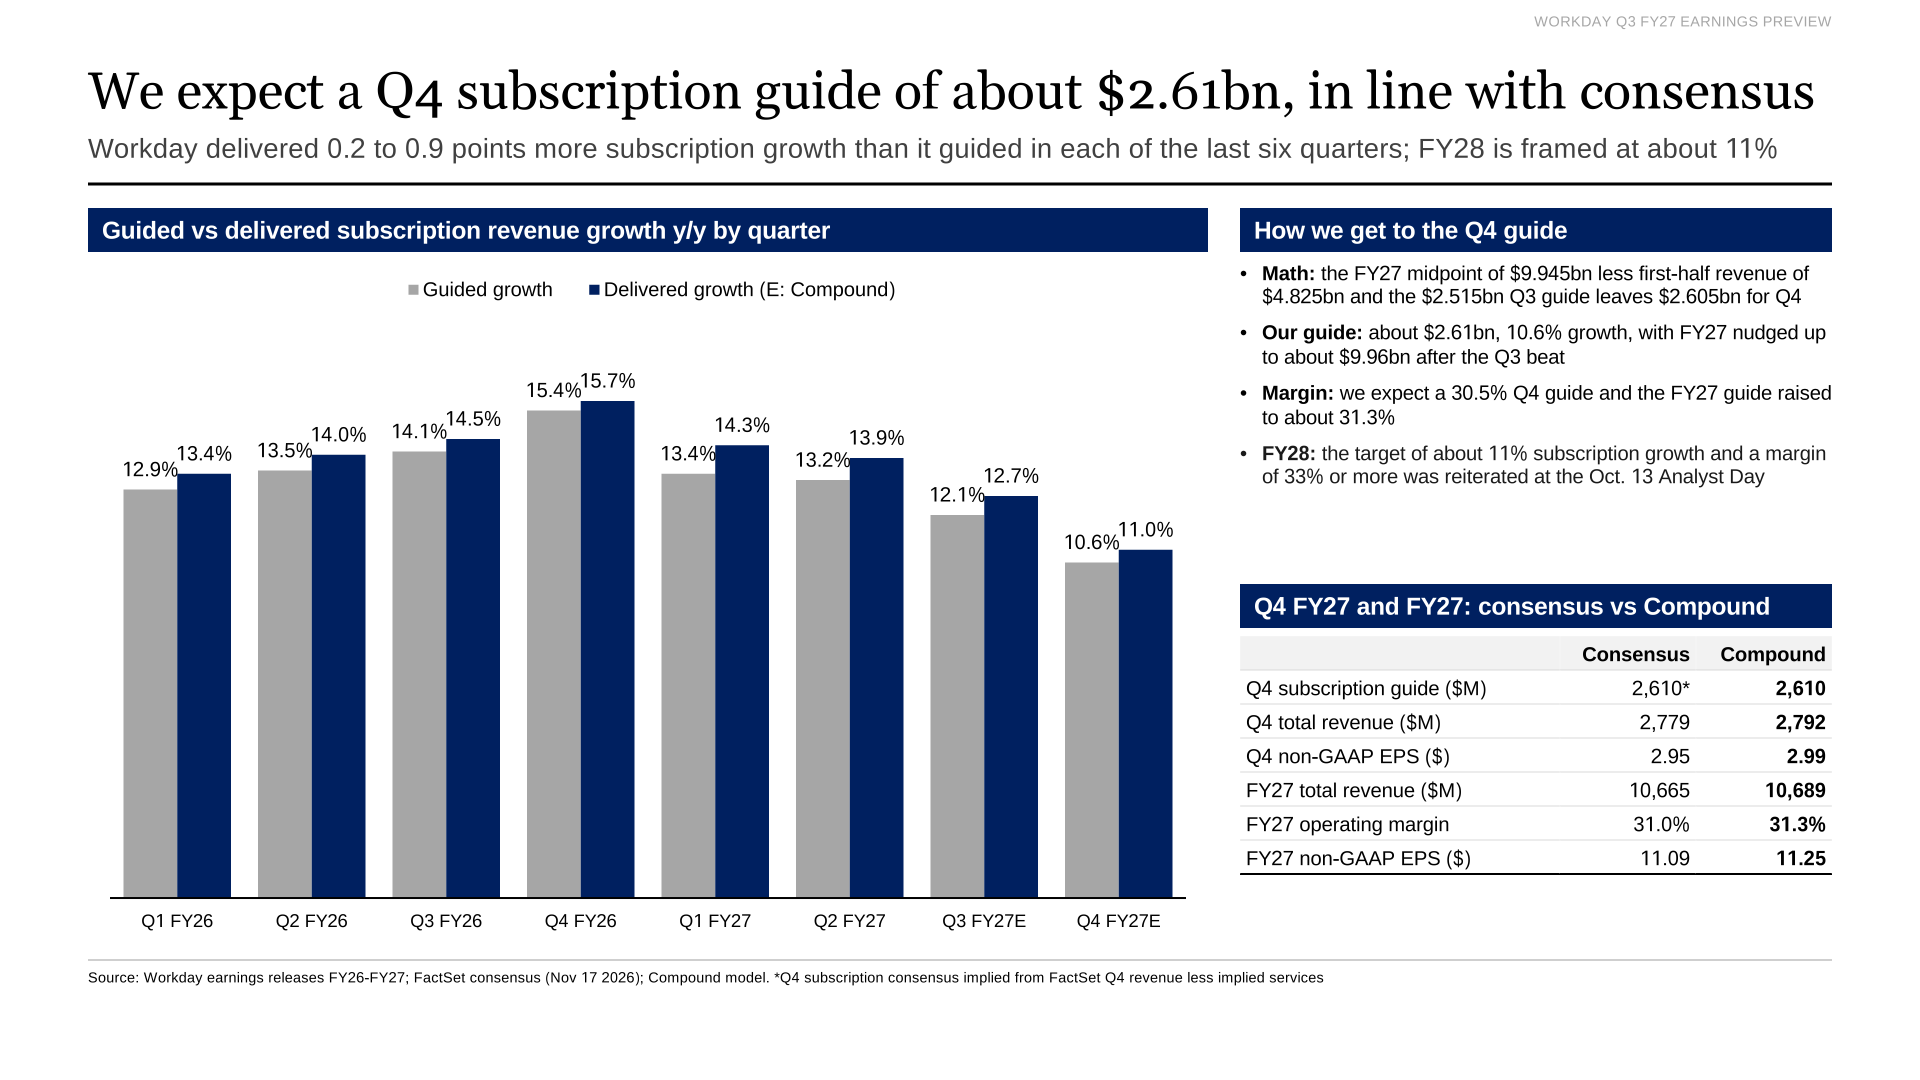
Guided against delivered subscription growth by quarter, and Q4 and FY27 consensus against Compound.
Share price and the Silver Lake talks
Reuters reported on Aug. 13 that Silver Lake was in talks to buy Workday, StreetAccount said. Workday shares rose 17.8% that day. On Sept. 17, CNBC's David Faber said efforts to finance a take-private bid were continuing. Chief executive Aneel Bhusri said on the Q2 call that he could not comment on the reports.
KeyBanc cut Workday to sector weight on Oct. 16, StreetAccount reported. The FactSet mean price target is $213.97.
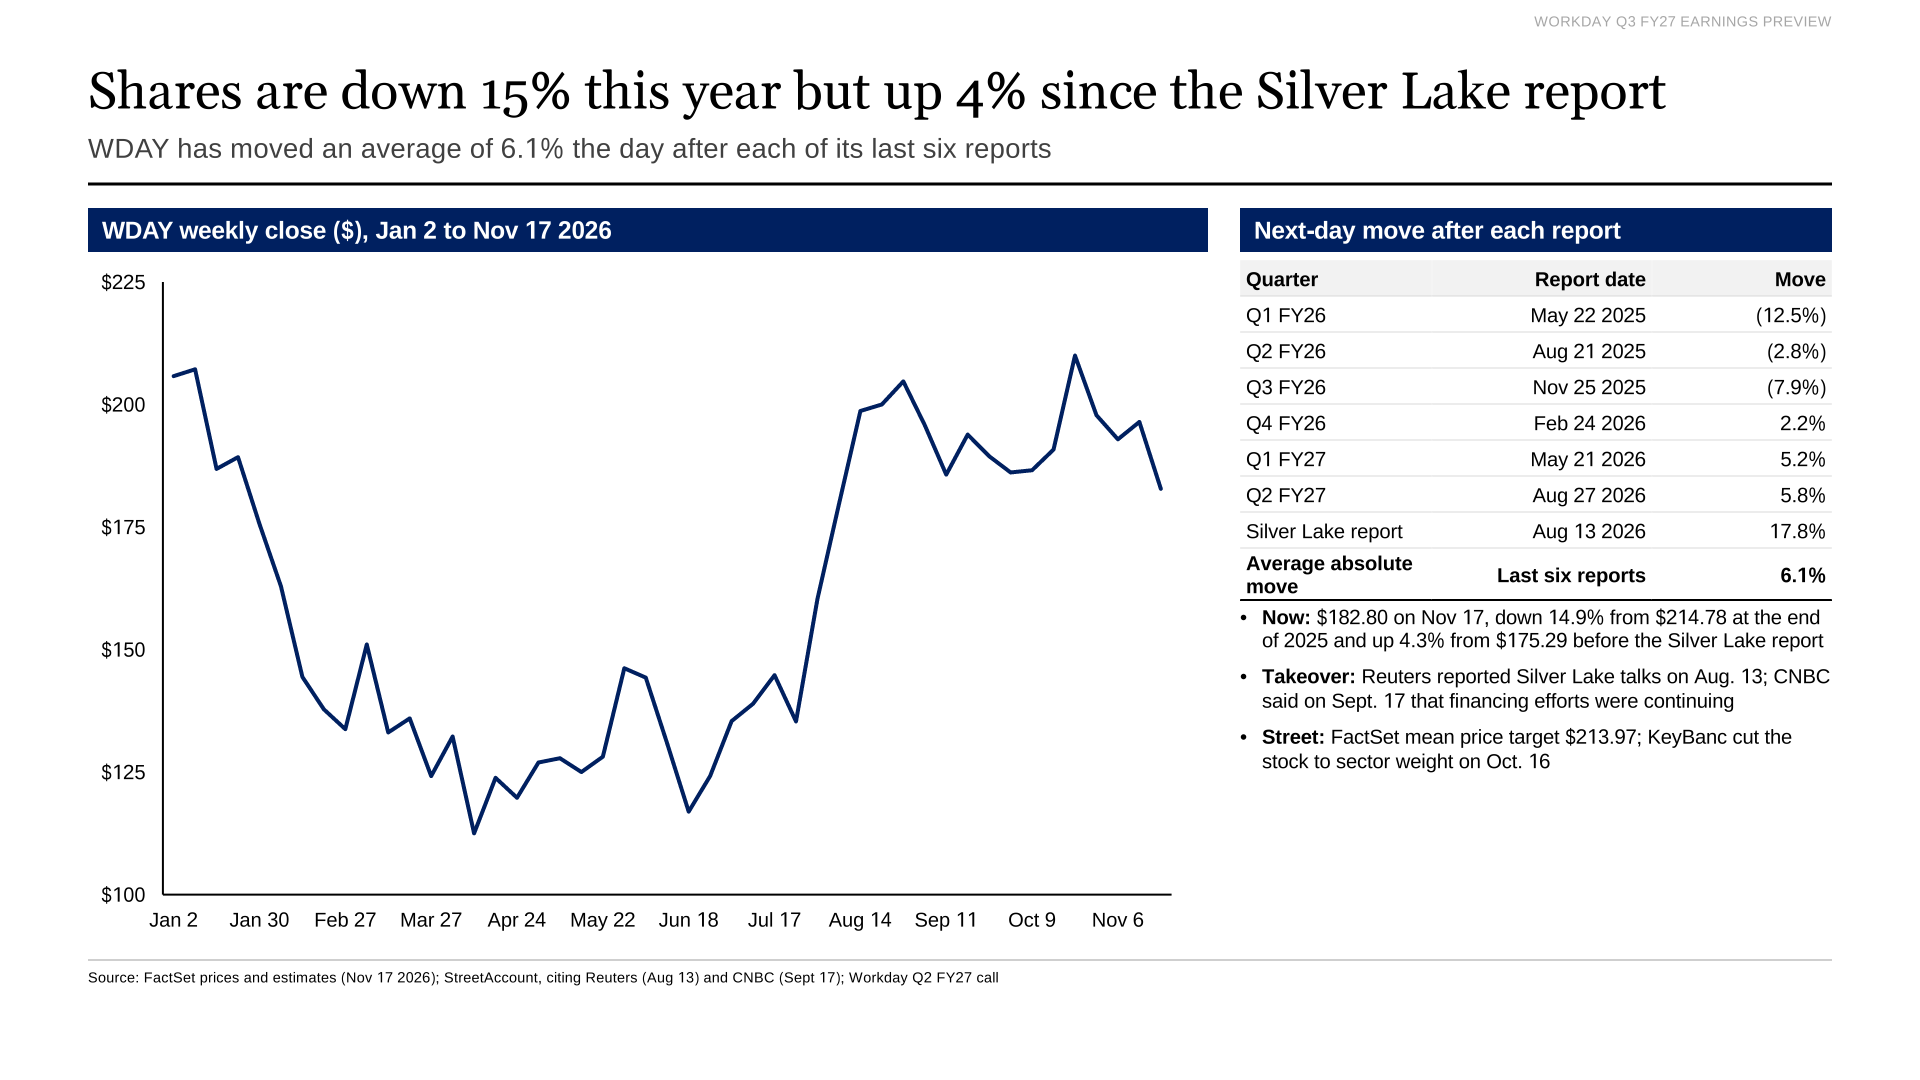
WDAY weekly close in 2026 and the next-day move after each report.
Cash flow and the new notes
Workday reiterated FY27 guidance of $3.45 billion of operating cash flow and $3.18 billion of free cash flow in August. We forecast Q3 free cash flow of $565 million.
On Oct. 23, Workday sold $2.5 billion of senior notes with coupons of 5.7% to 6.5%. It said it would use the proceeds to retire $1.0 billion of 3.5% notes due April 2027 and for general corporate purposes. The new notes add about $38 million of interest a quarter in our model.
Workday bought back $2.9 billion of stock in the first half and has a $4 billion open-ended authorization from August.
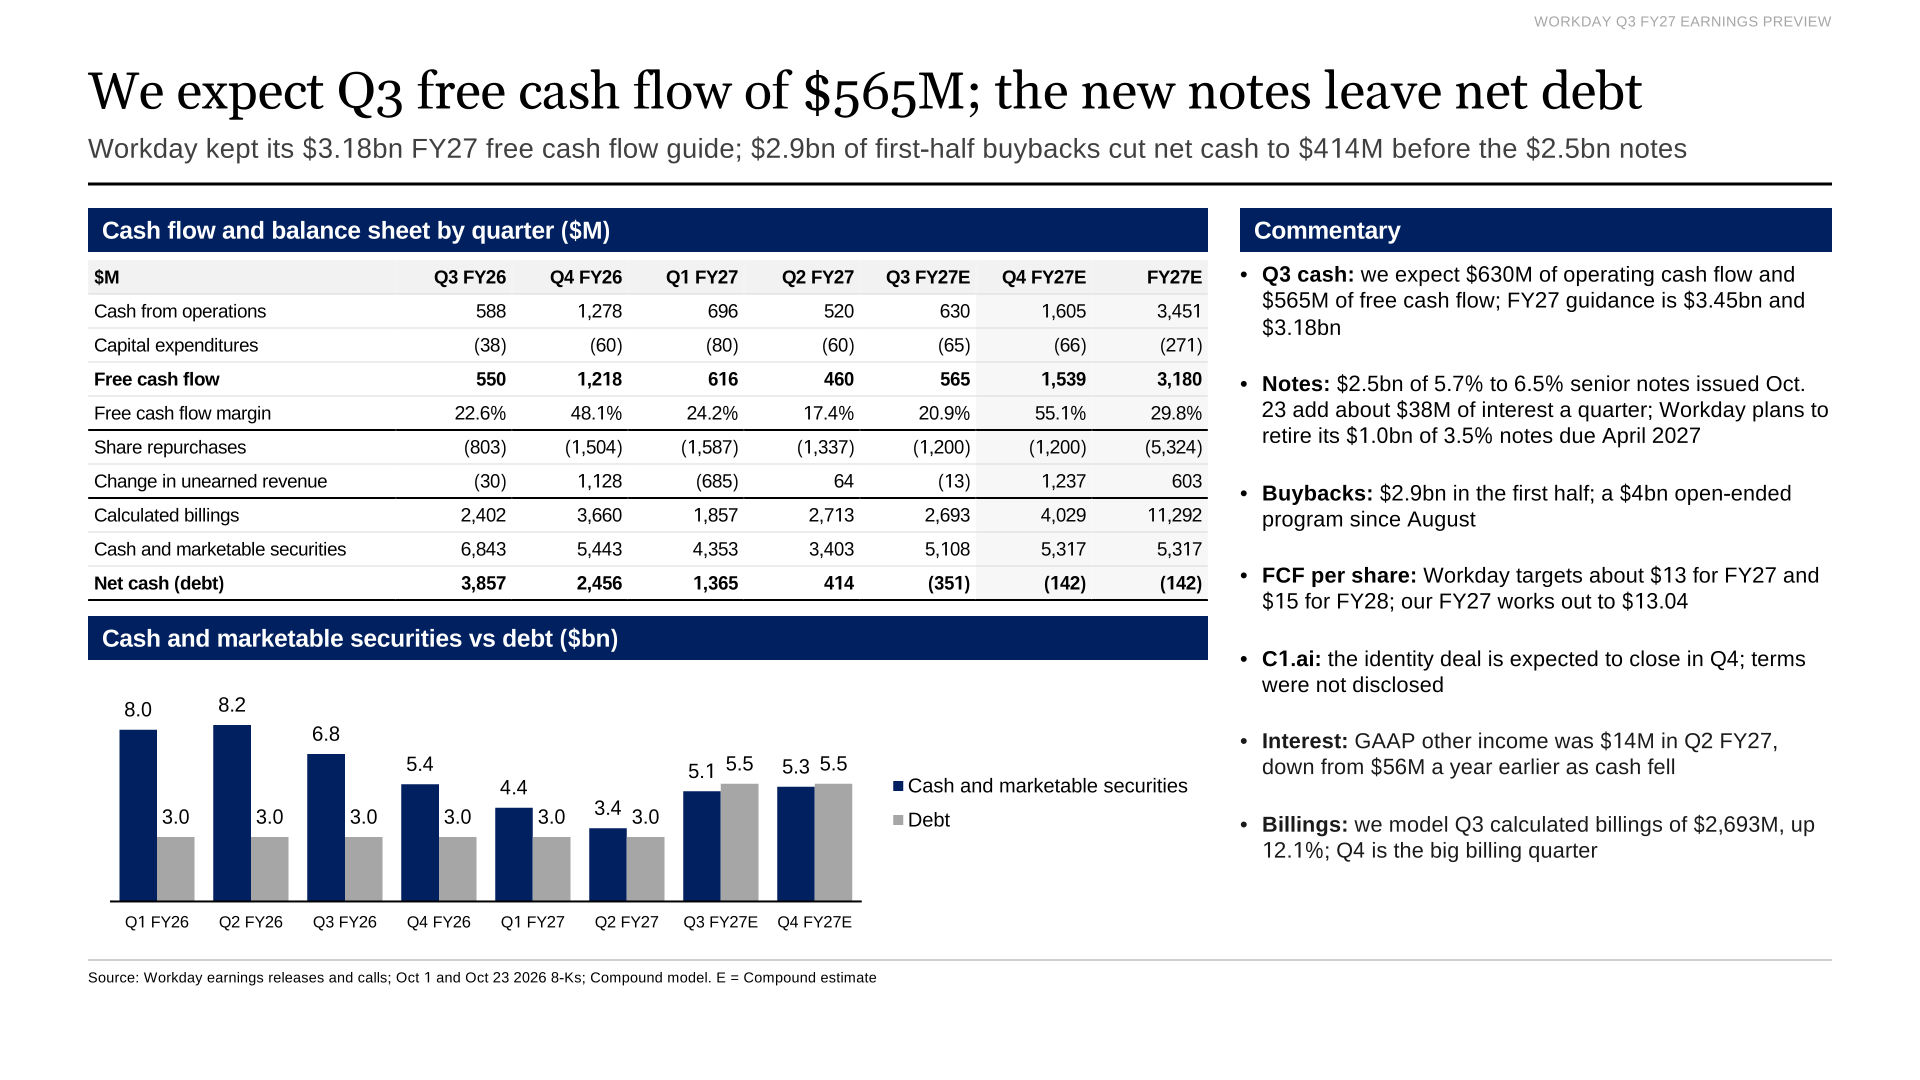
Cash flow by quarter and cash against debt after the October notes.
What to watch on Tuesday
- Q3 subscription revenue against the $2.515 billion guide and our $2.53 billion.
- cRPO growth against the 11% to 12% guide and our 12.0%.
- The Q4 subscription guide against our $2.61 billion, and whether the FY27 range moves above $9.95 billion.
- Non-GAAP operating margin against the 30.0% guide and our 31.0%, and any change to the 31.0% FY27 guide.
- AI ARR against our $708 million and an updated count of Flex Credits customers.
- Any change to the fiscal 2028 target of about 11% subscription growth.
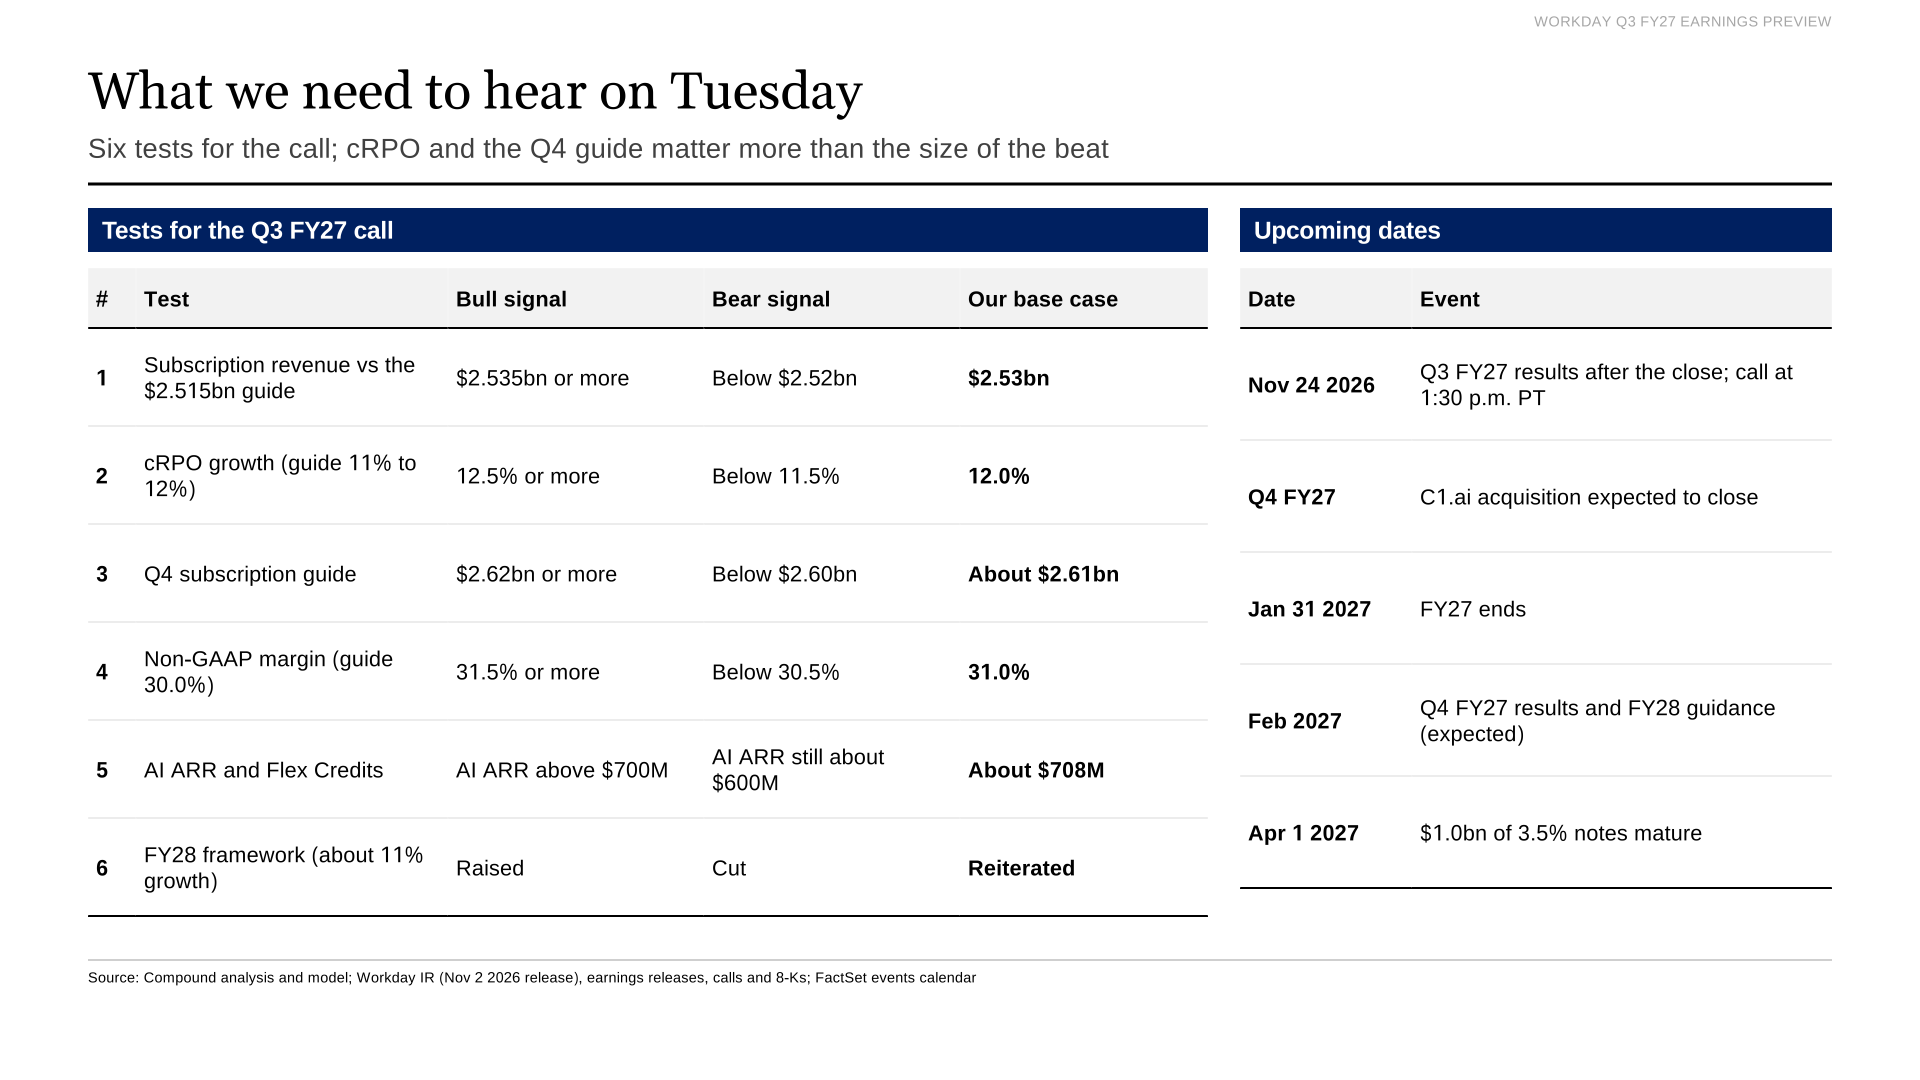
Six tests for the call and upcoming dates, including Q4 results expected in February.
 Workday Q3 FY27 earnings preview deck (PowerPoint)The 11-page preview: executive summary, forecast against consensus, subscription build, operating margin, Q4 guidance, AI pricing, cRPO, share price, cash flow and the checklist for the call, with editable charts and tables.Download · Free
 Workday Q3 FY27 earnings preview deck (PDF)The same 11 pages as a PDF.Download · Free
 Workday Q3 FY27 earnings model (Excel)Quarterly model from Q1 FY26: subscription and services build, cRPO and backlog, non-GAAP and GAAP income statements, cash flow, balance sheet and working capital, Compound's Q3 and Q4 estimates against guidance and consensus, the track record, AI and debt detail, and native Excel sensitivity tables, with formulas and sources.Download · Free
More from Compound News

Snowflake Q3 Earnings Preview: $0.69 EPS vs $0.60 Consensus
Snowflake reports Wednesday after the close. Our model puts product revenue 3.5% above the guidance midpoint and EPS at $0.69 against a $0.60 consensus. Remaining performance obligations have fallen for two quarters.
Read article →
Salesforce Q3 Earnings Preview: $3.51 EPS vs $3.45 Consensus
Salesforce reports Wednesday, Dec. 2, after the close. Our model puts third-quarter revenue at $11.50 billion, 0.3% above consensus, and non-GAAP EPS at $3.51 against $3.45. We expect the fourth-quarter revenue guide to land about 1.3% below the Street.
Read article →
Marvell Q3 Earnings Preview: $1.11 EPS vs $1.10 Consensus
Marvell reports Tuesday, Dec. 1, after pre-announcing Q3 revenue at its $3.15 billion guidance midpoint. Our model puts EPS at $1.11 against $1.10 and the Q4 revenue guide at about $3.75 billion. The stock is down 40.9% since Oct. 28.
Read article →