Ironvale Digital Infrastructure: Q1 FY26 portfolio company update
Halcyon Infrastructure Partners Fund IV, L.P. · Quarter ended 31 March 2026 · Investor Relations
Dear Limited Partners,
Ironvale, in which Fund IV holds a 62.0% fully diluted interest, had a solid first quarter. Revenue of $113.0M was 1.3% ahead of budget and 20.0% above Q1 FY25, adjusted EBITDA of $62.0M beat budget by $0.8M, and occupancy reached 91.9%. In May 2026 the company launched a sale process for 100% of its equity. On an illustrative basis of appraised campuses plus development at cost, less net debt, Fund IV’s interest is worth about $1,967M, 4.6x its invested capital.
- Equity value, 100%: $3,059.2M including development at cost, $2,551.2M on the campuses only Support workbook, Valuation C58:D58
- Fund IV share: $1,967.2M (4.6x), or $1,652.2M (3.9x) on the campuses only Valuation C64:D67
- Net debt / LTM adjusted EBITDA: 6.6x, management definition at 31 March 2026 Performance C50
You are on the investor relations team at Halcyon Infrastructure Partners. Fund IV holds 62.0% of Ironvale Digital Infrastructure, fully diluted: a US data center operator with 220 MW of commissioned capacity on six campuses and two buildings under construction. The quarter ended March 31, 2026, and the board pack is in: the Q1 board deck, the flash report, the monthly management accounts, the KPI dashboard and the quarter’s statements. The board authorized a process to sell 100% of the equity in April 2026, after authorizing a review of strategic alternatives in November 2025.
Your job is the quarterly update to Fund IV’s limited partners: a two-page letter, one summary slide and a workbook behind every number. This page takes it one step at a time, each step run in Compound. The answer at the end: a quarter ahead of plan, a funding gap the LPs need to hear about before the bids, and an illustrative value of $1,967M for Fund IV’s stake, or $1,652M on the operating buildings alone.
An LP report (or quarterly investor letter) is the GP’s account of the fund to its limited partners: performance and developments at each portfolio company, capital called and distributed, and the value of each holding. A board report goes the other way, from management to the company’s own board, and it is usually where the LP letter’s figures start. A capital account statement is the per-LP page of the same quarterly package: commitment, contributions, distributions and that LP’s share of net asset value.
Ironvale Digital Infrastructure, Project Voltaic and Halcyon are fictional: the company and its data room are the open data room of PE Bench, published under CC-BY-4.0. Everything Compound produced on this page is real: the letter, slide and workbook come from one Compound run on that room, quoted unedited apart from excerpts.
Quarterly results against budget and the prior quarter
The first step sets the quarter against budget, the prior quarter and the same quarter last year, every figure from the company’s own reporting.
| B | C | D | F | G | H | J | |
|---|---|---|---|---|---|---|---|
| 7 | Metric | Q1 FY26 actual | Q1 FY26 budget | Var vs budget % | Q4 FY25 | Var vs Q4 % | Var vs Q1 FY25 % |
| 8 | Total revenue | 113.0 | 111.5 | 1.3%1 | 104.4 | 8.2% | 20.0% |
| 9 | Net operating income (NOI) | 67.5 | 66.8 | 1.0% | 64.2 | 5.2% | 19.5% |
| 10 | Adjusted EBITDA | 62.0 | 61.2 | 1.3% | 57.7 | 7.5% | 23.0%2 |
| 11 | Adjusted EBITDA margin (%) | 54.9% | 54.9% | 55.2% | |||
| 13 | Leased MW (period end) | 202.2 | 201.0 | 200.7 | 0.8% | 7.2% | |
| 15 | Occupancy (%) | 91.9% | 91.4% | 91.2% |
- 1Earlier colocation starts at PHX I and higher metered power reimbursements, which are passed through at cost
- 2Adjusted EBITDA excludes $1.7M of sale-preparation costs
Revenue of $113.0M was $1.5M ahead of budget, and adjusted EBITDA of $62.0M beat it by $0.8M. Most of the beat came from colocation customers starting earlier than planned at PHX I. Uptime, power efficiency and retention held at last quarter’s levels, so the letter can say the quarter was solid in one line and move on.
Takeaway: a quarter slightly ahead of budget and 20.0% up on a year ago, but is the year-ago figure the board saw the same one?
Check the board deck against the management accounts
The second step ties the board deck’s own comparisons back to the monthly accounts, before any of them reach an LP.
| B | C | D | E | |
|---|---|---|---|---|
| 32 | Board deck (10.06 p2) | Mgmt accounts | Difference | |
| 33 | Q1 FY25 total revenue | 96.5 | 94.2 | 2.3 |
| 34 | Q4 FY25 total revenue | 108.71 | 104.4 | 4.3 |
| 35 | Q1 FY26 revenue growth vs Q1 FY25 (%) | 17.1%2 | 20.0% | (2.9%) |
- 1The board deck's revenue chart shows Q4 FY25 $4.3M above the three monthly P&Ls
- 2The deck's +17.1% headline starts from its own higher Q1 FY25 figure
The board deck’s revenue chart puts both prior quarters above what the monthly accounts add up to: Q1 FY25 by $2.3M and Q4 FY25 by $4.3M. Its growth headline, 17.1%, is computed from those higher figures. Compound’s letter uses the management accounts throughout and says so in its sources line, so an LP who compares this letter with last year’s sees the same Q1 FY25 revenue.
Takeaway: the board deck and the monthly accounts disagree on prior-quarter revenue, so the letter takes one source and names it, but which basis should the leverage figure use?
Capital deployment and leverage, on the management definition
The third step shows how the quarter’s capex was paid for and where leverage stood at quarter end, on the company’s own definition.
| B | C | |
|---|---|---|
| 38 | Value | |
| 39 | Development and maintenance capex | (75.7) |
| 40 | Construction facility draws | 65.0 |
| 41 | Distributions to members | (19.4) |
| 42 | Net cash from operating activities | 38.1 |
| 43 | Cash and cash equivalents, 31-Mar-26 | 91.2 |
| 44 | Term loan principal, 31-Mar-26 | 1,150.0 |
| 45 | Construction facilities drawn, 31-Mar-26 | 485.0 |
| 46 | Net debt (excl. lease liabilities), 31-Mar-26 | 1,543.8 |
| 48 | FY25 adjusted EBITDA | 224.0 |
| 49 | LTM adjusted EBITDA, Q1 FY26 | 235.61 |
| 50 | Net debt at 31-Mar-26 / LTM adjusted EBITDA, management definition (x) | 6.6x2 |
| 51 | Covenant maximum net leverage (x) | 7.5x |
- 1FY25 less Q1 FY25 plus Q1 FY26, on management's adjusted EBITDA definition
- 2Management definition at 31-Mar-26, not a buyer's diligence figure
Capex of $75.7M was funded by $38.1M of operating cash flow and $65.0M of construction draws, and the company still paid $19.4M of distributions to its members. Net debt of $1,543.8M is 6.6x LTM adjusted EBITDA of $235.6M, inside the 7.5x covenant. Both figures are on the management definition at March 31, 2026, and the letter, slide and workbook all say so. A buyer measures it differently: buy-side diligence puts FY25 adjusted EBITDA at $206.9M and net debt and debt-like items at $1,584.0M, as the financial due diligence example shows. The portfolio monitoring example retests the covenant on the credit agreement’s own definition.
Takeaway: leverage is 6.6x on the company’s own basis and labeled that way, but can the company fund the buildings it has under way?
The funding gap the LPs should hear about before the bids
The fourth step sets what is left to spend on the two buildings under construction against the financing committed to them.
| B | C | D | E | F | |
|---|---|---|---|---|---|
| 54 | Budget | Spent to 31-Mar-26 | Remaining | % spent | |
| 55 | PHX II (60 MW) | 618.0 | 412.0 | 206.0 | 66.7% |
| 56 | ATL II (36 MW) | 370.0 | 96.0 | 274.0 | 25.9% |
| 57 | Capacity in flight | 988.0 | 508.0 | 480.0 | 51.4% |
| 58 | Construction facility commitments (PHX II $450M + ATL II $150M) | 600.0 | |||
| 59 | Undrawn construction facilities | 115.0 | |||
| 60 | Remaining spend not covered by undrawn facilities | 365.01 | |||
| 62 | PHX II owner contingency | 14.0 | 2.2 | 4.0 | (1.8)2 |
- 1Must come from operating cash flow or new capital
- 2$11.8M of change orders cut the contingency from $14.0M to $2.2M, and $4.0M has been spent, with $206M of PHX II work to go
PHX II is on schedule for energization in October 2026 and 70% pre-leased. But its owner contingency is spent, and a disputed $4.6M HVAC claim sits outside the budget. Across both buildings, $480M remains to be spent against $115M of undrawn construction facilities. The letter puts the $365M gap in the capital deployment paragraph and again under the risks, because the bidders will find it in the data room.
Takeaway: $365M of the remaining build is unfunded and PHX II has no contingency left, so what is Fund IV’s stake worth with that in view?
Valuation: from the campus appraisals to Fund IV’s share
The fifth step builds an illustrative value for Fund IV’s stake that an LP can follow line by line, on two bases.
| B | C | D | |
|---|---|---|---|
| 53 | Incl. WIP at cost | Campuses only | |
| 54 | Appraised operating campuses, as is, 31-Mar-26 (operating buildings only) | 4,095.0 | 4,095.0 |
| 55 | Plus: development work in progress at cost (PHX II $412M + ATL II $96M) | 508.01 | 0.0 |
| 56 | Gross value | 4,603.0 | 4,095.0 |
| 57 | Less: net debt at 31-Mar-26 (term loan principal + construction facilities - cash) | (1,543.8) | (1,543.8) |
| 58 | Equity value, 100% | 3,059.2 | 2,551.2 |
| 59 | Fund IV at 62.0% fully diluted | 1,896.7 | 1,581.7 |
| 60 | Class B at 9.0% fully diluted (pro rata, before thresholds) | 275.3 | 229.6 |
| 61 | Class B actual value above thresholds | 171.92 | 126.2 |
| 62 | Class B value below thresholds, reallocated to Class A | 103.4 | 103.5 |
| 63 | Fund IV share of reallocation (62/91 of Class A) | 70.5 | 70.5 |
| 64 | Fund IV share of equity value | 1,967.23 | 1,652.24 |
| 65 | Check vs waterfall (row 33 / recomputed) | 0.0 | 0.0 |
| 67 | Fund IV value / invested capital (x) | 4.6x | 3.9x |
- 1Book cost of the two buildings under construction, which the appraisals do not cover
- 2The 2019 to 2023 grants, each valued at max(0, equity less its threshold) per unit
- 3Headline in the letter and on the slide: 64.3% of equity value, not 62.0%
- 4The operating buildings only, the basis of the 19.2x on the other Voltaic pages
The six independent appraisals value the operating campuses at $4,095M as is at March 31, 2026, the buildings only. That is the same $4,095M behind the 19.2x reference multiple on the other Voltaic pages, measured on FY25 EBITDA before other income of $212.8M, with no platform premium and no development pipeline. The campuses-only column stays on that basis and gives Fund IV $1,652M, 3.9x. The headline column adds the $508M already spent on PHX II and ATL II at book cost and gives $1,967M, 4.6x.
The Class B profits interests hold 9.0% of the units but share only in equity value above their distribution thresholds, so on the headline basis they are worth $171.9M rather than a pro rata $275.3M, and Fund IV picks up $70.5M of the difference.
The letter is plain that neither column is a fund mark and that the sale process, not the appraisals, will set the realized value. That process ends with a sponsor buying the company on December 31, 2026, as the add-on acquisition example picks up, and the CIM example shows how a buyer reads the same room.
Takeaway: Fund IV’s stake is worth an illustrative $1,967M with development at cost, or $1,652M on the buildings alone, and the gap from 62.0% is the Class B thresholds, so how does all of this read in the letter?
The quarterly LP letter and summary slide
The last step writes the letter and the one-page slide from the same workbook, so every figure in both matches.
Valuation basis: independent campus appraisals, illustrative
The data room holds no Fund IV carrying value, so this letter uses an illustrative basis that can be traced line by line in the table below. Independent as-is appraisals value the six operating campuses, the buildings only, at $4,095M at 31 March 2026. We add development work in progress at book cost of $508M (PHX II and ATL II, not appraised) and deduct net debt of $1,543.8M, giving an equity value of $3,059M. Fund IV’s 62.0% fully diluted share of that is $1,897M. Because the Class B profits interests share only in value above their distribution thresholds, a further $70M accrues to Fund IV, giving $1,967M, or 64.3% of equity. That is 4.6x invested capital of $425M (62/70 of the $480M invested in September 2019), before distributions. On the campuses alone, with no credit for work in progress, equity is $2,551M and Fund IV’s share $1,652M (3.9x). The sale process, not the appraisals, will set realized value.
Risks we are monitoring: three diligence findings could weigh on bids
Contracted term. The executed hyperscale leases expire between 2028 and 2032, while the rent roll and lease abstracts show terms re-dated to 2034 to 2037 with no amendment in the data room. On executed terms the portfolio WALT is about 4.0 years, against the 6.9 years the board materials present.
Power cost recovery. Interval data put FY25 utility cost at about $92.4M against $84.2M billed to tenants, so roughly $8.2M a year of power cost may not be recovered, although the accounts book power cost equal to reimbursements.
Development cost and funding. PHX II has no owner contingency left with $206M of work to complete, and $365M of the remaining capacity-in-flight spend is not covered by committed construction facilities.
The letter is what a GP sends, and it reads like one. It opens with the quarter in one paragraph, then gives a metrics table with a source column, the developments, capital deployment, the valuation bridge, the risks and the outlook against the FY26 budget. A sources line closes it, naming every document and page. Telling LPs about the diligence findings before the bids arrive is a choice a GP can argue with, and Compound states each one with its source so the deal team can decide.
Compound put the same quarter on one slide for the LP meeting.
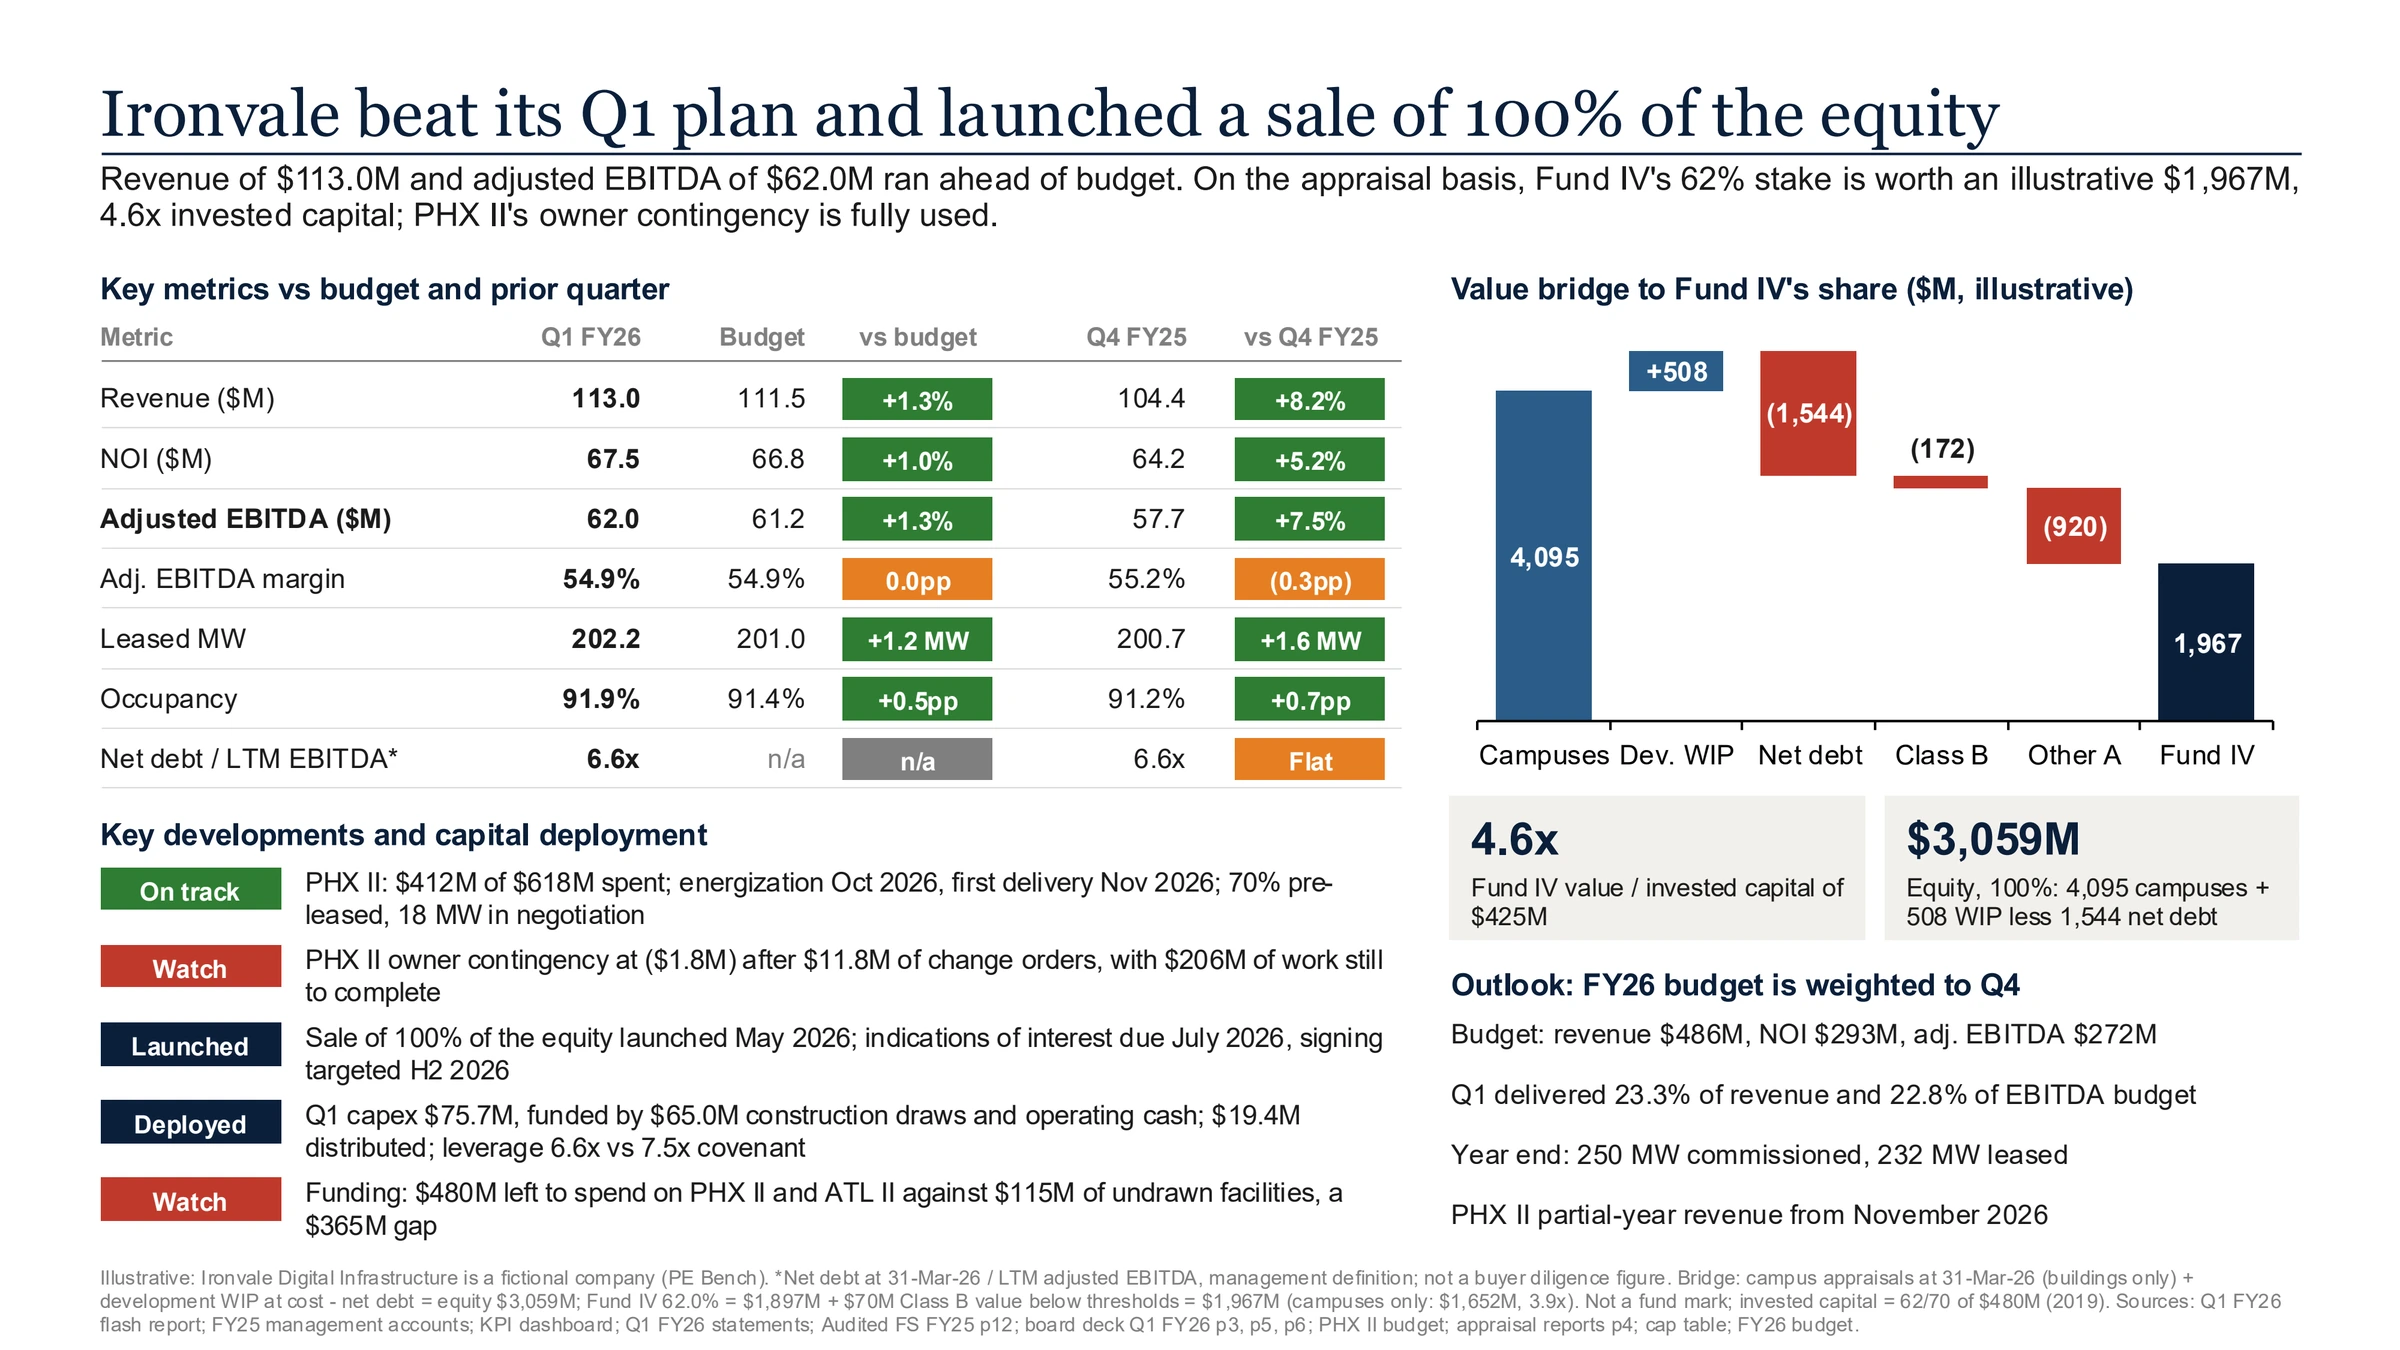
Takeaway: the letter, slide and workbook tell one story from one set of numbers: a quarter ahead of plan, a $365M funding gap and an illustrative $1,967M for Fund IV, $1,652M on the buildings alone.
Quarterly LP update letter (Word)Compound’s two-page letter to Fund IV’s limited partners: results against budget, key developments, capital deployment, the valuation bridge on both bases, risks and outlook, with a sources line. Use it as a quarterly investor letter template.Download · Free, no form LP update support workbook (Excel)Compound’s workbook behind the letter and slide: Performance (quarter against budget and prior periods, the board deck check, capital deployment, leverage, development funding, outlook) and Valuation (appraisals, Class B waterfall, the bridge on both bases), formulas intact.Download · Free, no form LP summary slide (PowerPoint)Compound’s one-page summary of the quarter: key metrics, status-tagged developments, the value bridge to Fund IV’s share and the outlook.Download · Free, no form